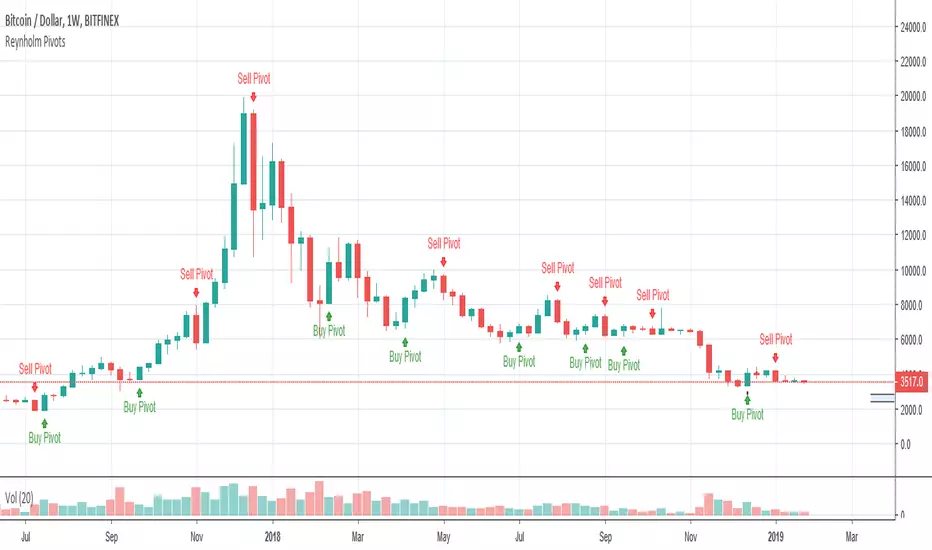
Reynholm PivotsReynholm Pivots are used by Forex, Futures and Stock Traders to flag possible reverse points. These pivots work best on higher times such as the monthly, weekly and daily time frames. I don't recommend using Reynholm Pivots on time frames lower than the daily chart. This pivots are not "buy" or" sell" signals and should not be used for this purpose, but used in conjunction with other technical and or fundamental analysis.
Pivot
Failure Swing Strategy (stop hunting) V1 (Made on XBT/USD 4h Bitmex)
This strategy is a first attempt to countertrade the false break of a key support/resistance.
If a candle breaks the level, but it comes back before close, it will trigger an order.
The Stop Loss is in %, the Take Profit is near the EMA.
There is a "volatility filter" to block orders when the price is near the EMA and a coefficient to adjust a little the Stop Loss and Take Profit according to the chart condition.

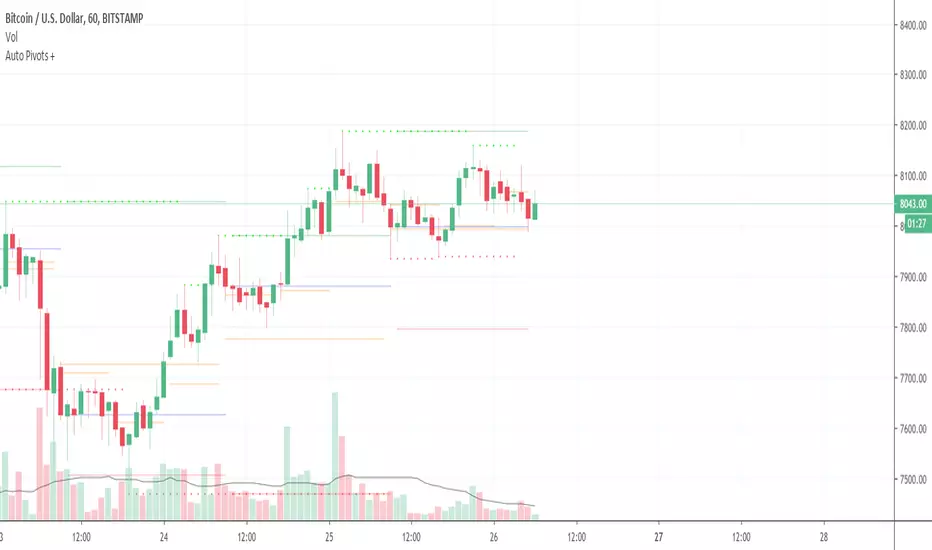
Auto Pivot PointsThis indicator plots a Pivot Point and 3 Support and Resistance lines that automatically adapt to the Timeframe
These can also be plotted against a Custom Timeframe
Protege Pivots Swings PointsThis is my version of my pivots points when i use it.
I use the same parameters that Gregory Mannarino use for his evolution system.
I just show it to be better for a quick view.
Trade at your own risk!

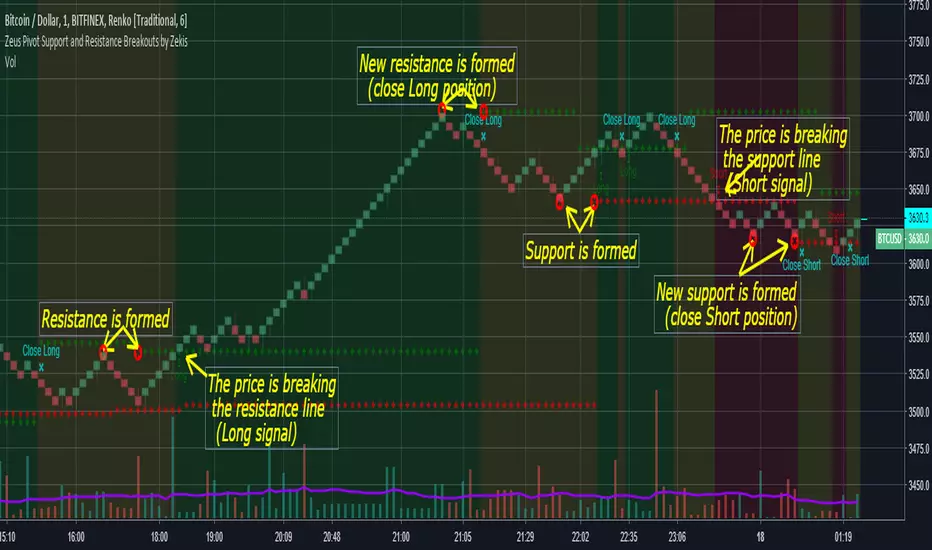
Zeus Pivot Points Support and Resistance Breakouts by ZekisZeus Pivot Support and Resistance Breakouts by Zekis
Is an indicator with big results, it forms new support /resistance according to the last higher high or lower low (it prints new ones only if it breaks through the last one)
Rules:
- enter Long or Short when the support or resistance is craked
- exit when new support or resistance is starts to form
Alerts for entries and exits
A moving average is added to filter signals (leave it at 1 for price close signals)
Bar colors can be added to see longs, shorts or no position
Background colors for longs, shorts or no position
Enjoy!
@Zekis

Pivot Boss EMASFrank Ochoa concept of Pivot based EMAs.
Changes color based on the position of fast and slow PEMAs.
Default values are 21,34,55 (Fibonacci numbers)
Ideal way of usage is to use in conjunction with PEMA Oscillator which I had posted few days back.

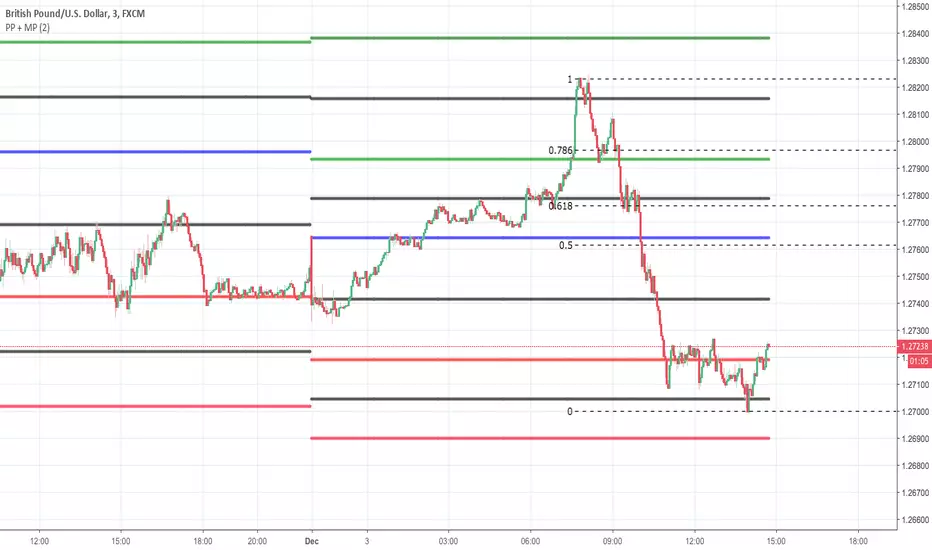
Pivot Point + MidPointsTraditional floor pivots with additional lines in between the s/r levels called Mid Points
If the Pivot Points are used as entering at s/r levels, you can use the Mid Points to scale out of a position or place Sl's behind
pivot point strategy(lirshah)The pivot point levels are composed of a pivot point, two higher resistance levels known as R1 and R2, and two lower pivot point supports known as S1 and S2.
Each resistance level is considered a pivot point.
this strategy gives signals based on valid pivot points( reactionary price level) and it has a good results on the variety of pairs in different markets.

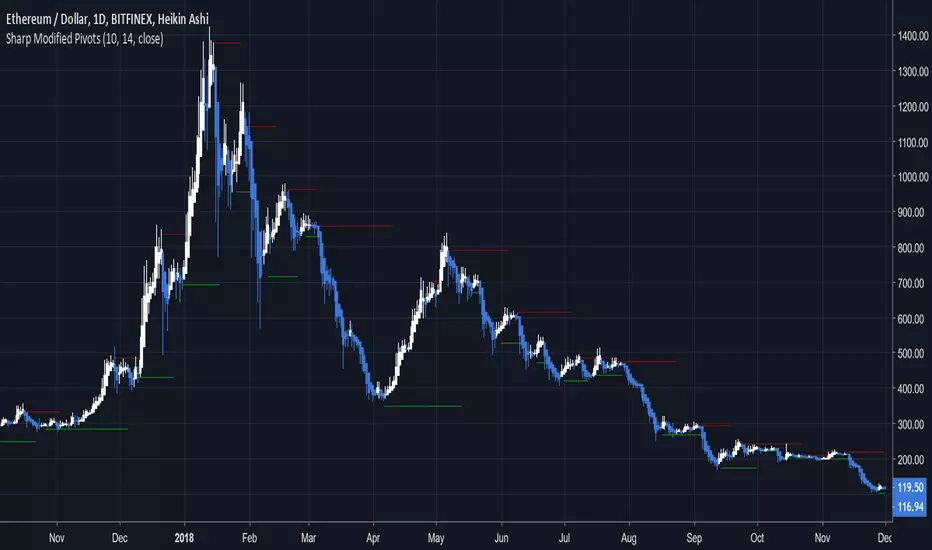
Sharp Modified PivotsThis uses everget's implementation of the Sharp Modified Moving Average to plot pivot points.
It can also show you when to exit your long or short positions if you toggle the option.
Check out everget's scripts at www.tradingview.com
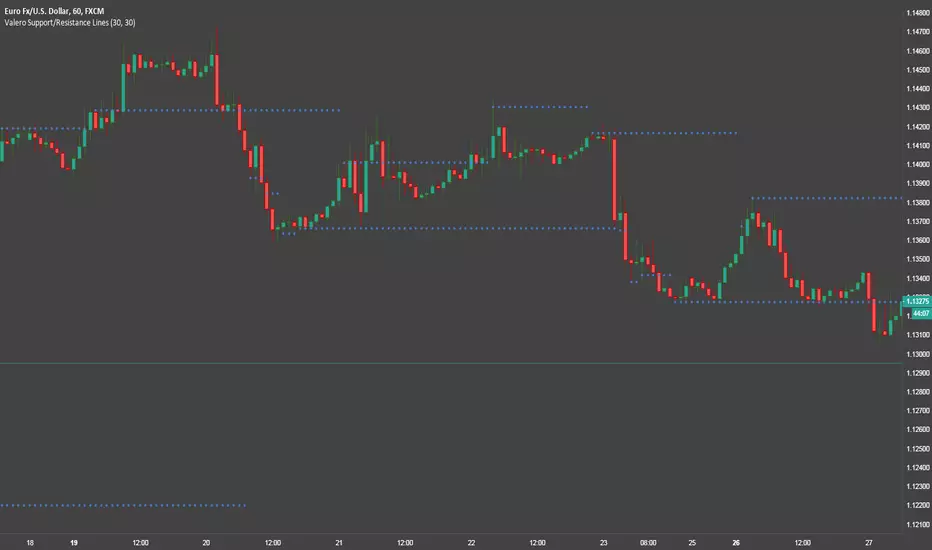
Valero Support/Resistance LinesThis is a pretty simple indicator that automatically draws Support and Resistance lines.
Pipo Trading System [by: Bijan Ajdary]Pipo Trading System
for Only Use in 15M TimeFrame
Thanks to Mr. Nima Azadi

Floor Trader Pivot PointsAdds plotting of daily pivot point which acts as a demarcation between bullish/bearish market sentiment.

Fibonacci Pivots: last days trade or user defined by irenabyssThis takes the high, low and close from day prior OR Allows the user to set a high, low and close then plots the fibonacci pivot points for the current days trading.
Recommended to use intraday (I use 5 min chart).

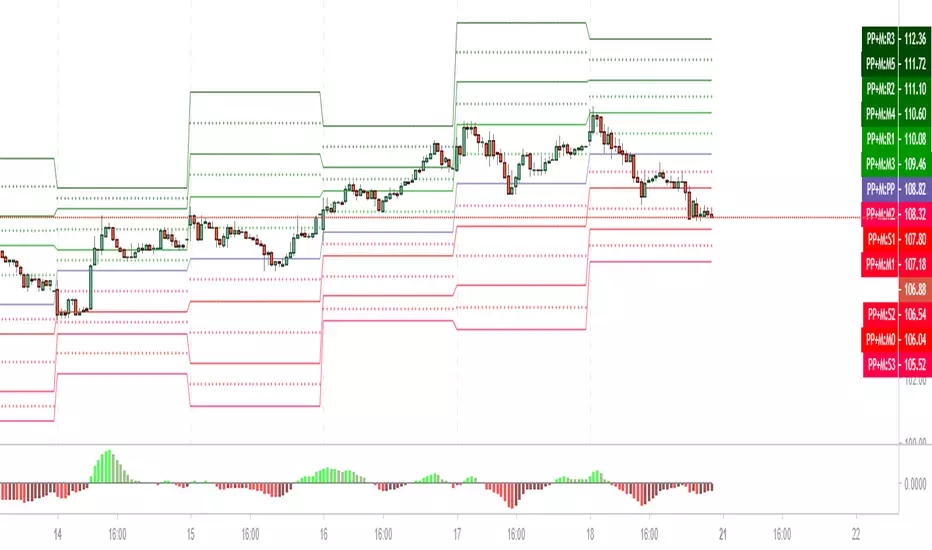
DMA: Pivot Point + Medians
Опорная точка (Pivot Point) – это уровень цены изменения направления рынка в конкретный день.
Зная уровни максимума, минимума и закрытия предыдущей сессии, и произведя простые арифметические действия, мы получим значения уровней поддержки и сопротивления.
Отличие этого метода анализа в том, что он помогает составить картину о направлении движения рынка на следующий день. Т.е. это очень удобный инструмент для торговли внутри дня, для интрадея.
Зная уровни закрытия, максимума, минимума дня сегодняшнего – можно рассчитать разворотные точки на день завтрашний.
Ввиду популярности данной теории, рынок часто реагирует на эти уровни.
Данный индикатор рассчитывает не только основные уровни Pivot Point (Floor), но и так называемые средние, медианы.
Формула расчета медиан:
Median0 = (S3 + S2)/2
Median1 = (S2 + S1)/2
Median2 = (S1 + Pivot)/2
Median3 = (PivotPoint + R1)/2
Median4 = (R1 + R2)/2
Median5 = (R2 + R3)/2

Tensor Toolbox Overlay BetaThis purpose of this script is to test new features we might want to implement in Tensor Cloud (See: . Also, to work towards a full, all-in-one indicator solution (Tensor Toolbox). In this first version of Tensor Toolbox Overlay, we propose two new features for Tensor Cloud:
The Veil.
Ichimoku Weight/Smoothing.
The Veil is an RSI filter. The Ichimoku smoothing takes Ichimoku and averages it with Tensor Cloud. The Ichimoku feature will probably not make it into Tensor Cloud but Veil might. Tensor Cloud should remain as pure as possible. It's all up to your feedback. Initial features of Tensor Toolbox Overlay:
Tensor Cloud.
Support & Resistance.
MACD background.
Long & Short potentials.
Tensor Toolbox Overlay needs a lot more features yet to remain elegant. A second edition called Tensor Toolbox Oscillator is coming as well (Can only fit so much on the chart). The goal with both is to have a suite that takes the best of all indicators and provides easy decision making, for those who like to keep control. For Overlay, I also intend to duplicate the functionality of MTPredictor at a fraction of the cost. Feedback appreciated.
Enjoy :)

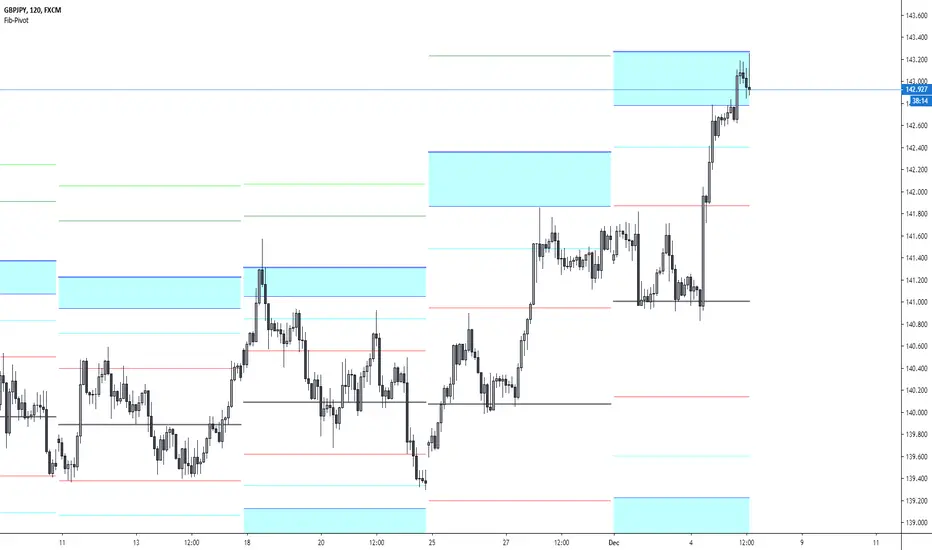
Fibonacci-Pivot PointFibonacci Pivot Point Indicator
Default Time Frame = Weekly
Buy Sell zones
Pivot Levels
PP 0.00% white line = Pivot point
SR red lines = Support Resistance Level 1, Fibonacci 38.2
SR aqua zones = Support Resistance Trading zone, Fibonacci 61.8~78.6
SR blue lines = Support Resistance Level 4, Fibonacci 100
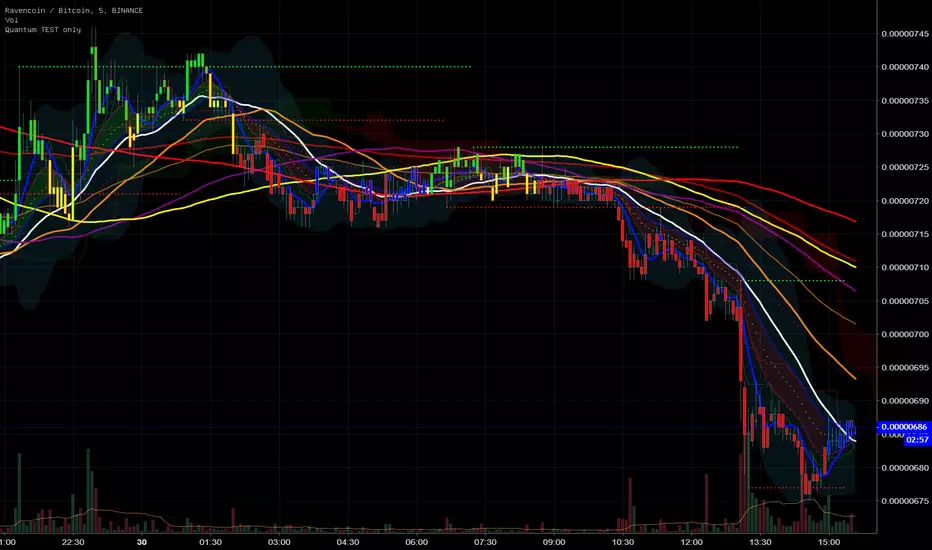
Quantum all in one Crypto indicator V1Quantum all in one Crypto indicator V1
Features:
Bollinger
Ichimoku
6 EMA
6 MA + Fast & Slow
CDC Strategy
Fractals
Pivots
.. and more
V 1.5 in progress
enjoy
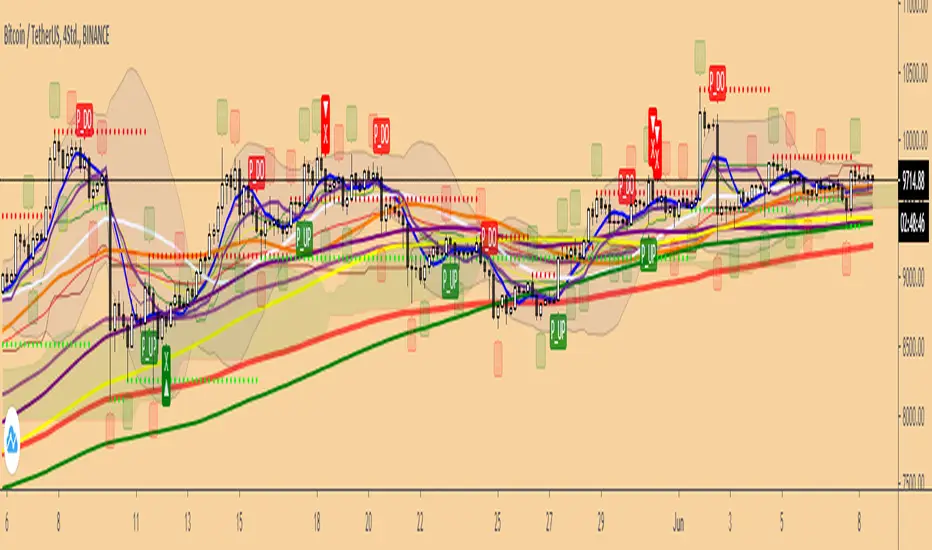
Quantum All in One Crypto Indicator V1Quantum All in One Crypto Indicator V1
Features
6 EMA
6 MA + Slow & Fast
Ichimoku
Bollinger
Fractals
CDC Strategy
Colored Bars
Pivot´s and more..
have fun
Version V1.5 in Progress
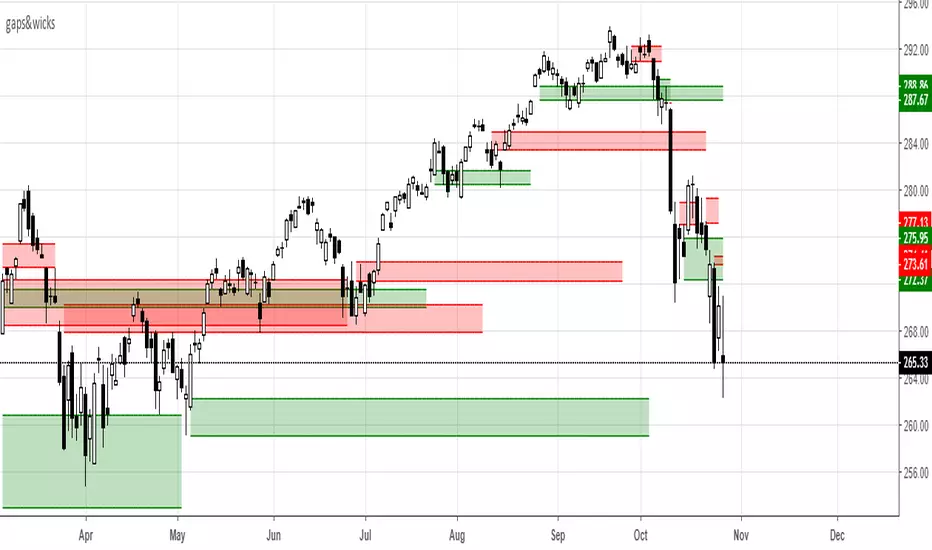
gaps&wicksA means for tracking price ranges for gap up/down and longer buying/selling tails. This may have some value for buying/selling opportunities based on the relative significance of the range. The look back period is adjustable and works for any time frame. If you have any success using it leave some feedback.
-Squam
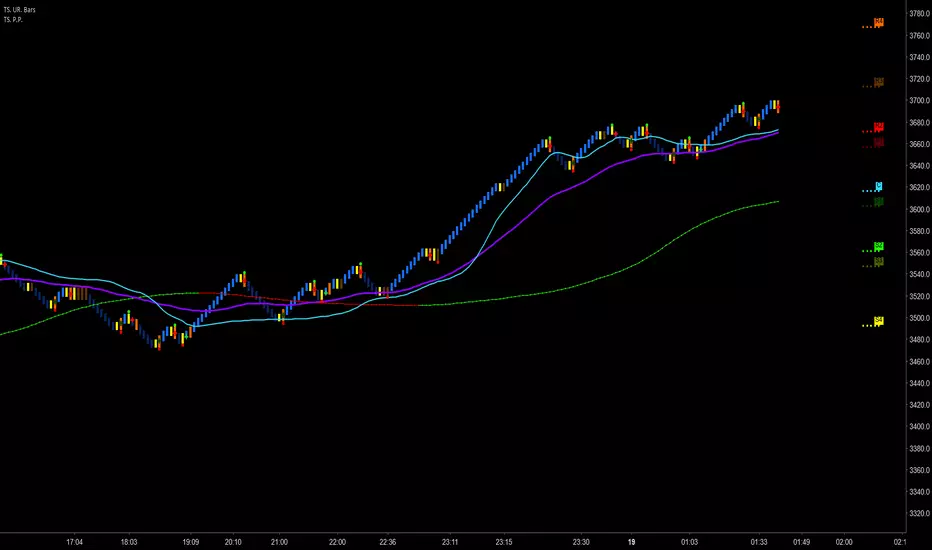
Trader Set - Pivot PointsThis is a Pivot Point indicator that has the ability to sit on top of Uni Renko Charts to show the center pivot (others don't work because of specifications of uni renko chart unless i figure something in future) but on price charts and range charts they work like charm.
Unlike the built in indicator, you can choose separately to draw each support or resistance level. Other than Standard draw from the built in indicator, all other types are included in this indicator.
Please, don't ask for access, only my students from my classes will have access to this indicator, at least for time being. If at any time in future I wish to sell, you will find the price and how to buy in the comments bellow.