NFP High/Low Levels PlusNFP High/Low Levels Plus
Description:
This indicator stores the 12 most recent NFP (Non-Farm-Payroll) days and their values.
Values are captured from 0830 (NFP Release) until close of market
The High and Low values for each NFP month are drawn on the chart with horizontal lines.
- Labels indicating the month's high or low line are placed after the line
- Optionally the high/low price can be displayed additionally
Support and Resistance boxes can be drawn at the closest NFP level above and below the
current price.
- Boxes will automatically update as prices cross the NFP value
Macro Indicator
- This option displays a small table in the top right corner that says "Up" or " Down"
- The Macro Indicator can be used to judge the potential direction for the current month
- Macro direction is calculated by the following:
- UP: If two consecutive days both open and close above the most recent NFP High level
- DOWN: If two consecutive days both open and close below the most recent NFP Low level
Micro Indicator
- This option displays a small table in the top right corner that says "Up" or " Down"
- The Micro Indicator can be used to judge the potential direction for low timeframes 1H or
lower
- Micro direction is calculated by the following:
- UP: If two consecutive 10m candles close above the 20EMA
- DOWN: If two consecutive 10m candles close below the 20EMA
NFP Session Bars
- This feature draws an arrow at the bottom of the chart for each candle that falls within the
NFP session day
- This is useful for identifying NFP Days
Support / Resistance Table
- This displays a table bottom center showing the nearest high and low NFP line level
What is an NFP Day and why is it useful to add to my chart?
- NFP Days are one of the most important data releases monthly
- NFP (Non-Farm-Payroll) is the official release of 80% of the US workforce employed in
manufacturing, construction, and goods
- It does not include those who work on farms, private households, non-profit and
government workers
- Historically these high/low levels for the day create strong support and resistance levels
- Having them displayed on the chart can help identify potential strong levels and pivot points
Full Indicator with all options enabled and identified
Easily update NFP Release Days in the indicator settings
Modify various options: Show/Hide lines, labels, directional indicator tables, values tables
Adjust line width, offsets, colors, font sizes, box widths
Enable individual Directional Indicators and modify colors
Example of full indicator enabled
You can find a list of the NFP Release Schedule on the official US Bureau of Labor Statistics website. This is useful for updating the indicator settings with the correct dates
Pivotlevels

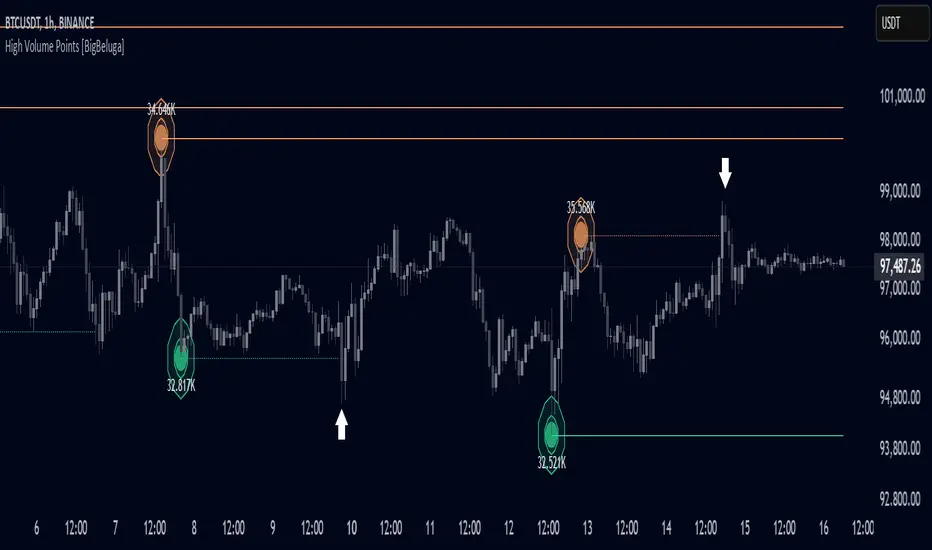
High Volume Points [BigBeluga]High Volume Points is a unique volume-based indicator designed to highlight key liquidity zones where significant market activity occurs. By visualizing high-volume pivots with dynamically sized markers and optional support/resistance levels, traders can easily identify areas of interest for potential breakouts, liquidity grabs, and trend reversals.
🔵 Key Features:
High Volume Points Visualization:
The indicator detects pivot highs and lows with exceptionally high trading volume.
Each high-volume point is displayed as a concentric circle, with its size dynamically increasing based on the volume magnitude.
The exact volume at the pivot is shown within the circle.
Dynamic Levels from Volume Pivots:
Horizontal levels are drawn from detected high-volume pivots to act as support or resistance.
Traders can use these levels to anticipate potential liquidity zones and market reactions.
Liquidity Grabs Detection:
If price crosses a high-volume level and grabs liquidity, the level automatically changes to a dashed line.
This feature helps traders track areas where institutional activity may have occurred.
Volume-Based Filtering:
Users can filter volume points by a customizable threshold from 0 to 6, allowing them to focus only on the most significant high-volume pivots.
Lower thresholds capture more volume points, while higher thresholds highlight only the most extreme liquidity events.
🔵 Usage:
Identify strong support/resistance zones based on high-volume pivots.
Track liquidity grabs when price crosses a high-volume level and converts it into a dashed line.
Filter volume points based on significance to remove noise and focus on key areas.
Use volume circles to gauge the intensity of market interest at specific price points.
High Volume Points is an essential tool for traders looking to track institutional activity, analyze liquidity zones, and refine their entries based on volume-driven market structure.
One Trading Setup for Life ICT [TradingFinder] Sweep Session FVG🔵 Introduction
ICT One Trading Setup for Life is a trading strategy based on liquidity and market structure shifts, utilizing the PM Session Sweep to determine price direction. In this strategy, the market first forms a price range during the PM Session (from 13:30 to 16:00 EST), which includes the highest high (PM Session High) and lowest low (PM Session Low).
In the next session, the price first touches one of these levels to trigger a Liquidity Hunt before confirming its trend by breaking the Change in State of Delivery (CISD) Level. After this confirmation, the price retraces toward a Fair Value Gap (FVG) or Order Block (OB), which serve as the best entry points in alignment with liquidity.
In financial markets, liquidity is the primary driver of price movement, and major market participants such as institutional investors and banks are constantly seeking liquidity at key levels. This process, known as Liquidity Hunt or Liquidity Sweep, occurs when the price reaches an area with a high concentration of orders, absorbs liquidity, and then reverses direction.
In this setup, the PM Session range acts as a trading framework, where its highs and lows function as key liquidity zones that influence the next session’s price movement. After the New York market opens at 9:30 EST, the price initially breaks one of these levels to capture liquidity.
However, for a trend shift to be confirmed, the CISD Level must be broken.
Once the CISD Level is breached, the price retraces toward an FVG or OB, which serve as optimal trade entry points.
Bullish Setup :
Bearish Setup :
🔵 How to Use
In this strategy, the PM Session range is first identified, which includes the highest high (PM Session High) and lowest low (PM Session Low) between 13:30 and 16:00 EST. In the following session, the price touches one of these levels for a Liquidity Hunt, followed by a break of the Change in State of Delivery (CISD) Level. The price then retraces toward a Fair Value Gap (FVG) or Order Block (OB), creating a trading opportunity.
This process can occur in two scenarios : bearish and bullish setups.
🟣 Bullish Setup
In a bullish scenario, the PM Session High and PM Session Low are identified. In the following session, the price first breaks the PM Session Low, absorbing liquidity. This process results in a Fake Breakout to the downside, misleading retail traders into taking short positions.
After the Liquidity Hunt, the CISD Level is broken, confirming a trend reversal. The price then retraces toward an FVG or OB, offering an optimal long entry opportunity.
The initial take-profit target is the PM Session High, but if higher timeframe liquidity levels exist, extended targets can be set.
The stop-loss should be placed below the Fake Breakout low or the first candle of the FVG.
🟣 Bearish Setup
In a bearish scenario, the market first defines its PM Session High and PM Session Low. In the next session, the price initially breaks the PM Session High, triggering a Liquidity Hunt. This movement often causes a Fake Breakout, misleading retail traders into taking incorrect positions.
After absorbing liquidity, the CISD Level breaks, indicating a shift in market structure. The price then retraces toward an FVG or OB, offering the best short entry opportunity.
The initial take-profit target is the PM Session Low, but if additional liquidity exists on higher timeframes, lower targets can be considered.
The stop-loss should be placed above the Fake Breakout high or the first candle of the FVG.
🔵 Setting
CISD Bar Back Check : The Bar Back Check option enables traders to specify the number of past candles checked for identifying the CISD Level, enhancing CISD Level accuracy on the chart.
Order Block Validity : The number of candles that determine the validity of an Order Block.
FVG Validity : The duration for which a Fair Value Gap remains valid.
CISD Level Validity : The duration for which a CISD Level remains valid after being broken.
New York PM Session : Defines the PM Session range from 13:30 to 16:00 EST.
New York AM Session : Defines the AM Session range from 9:30 to 16:00 EST.
Refine Order Block : Enables finer adjustments to Order Block levels for more accurate price responses.
Mitigation Level OB : Allows users to set specific reaction points within an Order Block, including: Proximal: Closest level to the current price. 50% OB: Midpoint of the Order Block. Distal: Farthest level from the current price.
FVG Filter : The Judas Swing indicator includes a filter for Fair Value Gap (FVG), allowing different filtering based on FVG width: FVG Filter Type: Can be set to "Very Aggressive," "Aggressive," "Defensive," or "Very Defensive." Higher defensiveness narrows the FVG width, focusing on narrower gaps.
Mitigation Level FVG : Like the Order Block, you can set price reaction levels for FVG with options such as Proximal, 50% OB, and Distal.
Demand Order Block : Enables or disables bullish Order Block.
Supply Order Block : Enables or disables bearish Order Blocks.
Demand FVG : Enables or disables bullish FVG.
Supply FVG : Enables or disables bearish FVGs.
Show All CISD : Enables or disables the display of all CISD Levels.
Show High CISD : Enables or disables high CISD levels.
Show Low CISD : Enables or disables low CISD levels.
🔵 Conclusion
The ICT One Trading Setup for Life is a liquidity-based strategy that leverages market structure shifts and precise entry points to identify high-probability trade opportunities. By focusing on PM Session High and PM Session Low, this setup first captures liquidity at these levels and then confirms trend shifts with a break of the Change in State of Delivery (CISD) Level.
Entering a trade after a retracement to an FVG or OB allows traders to position themselves at optimal liquidity levels, ensuring high reward-to-risk trades. When used in conjunction with higher timeframe bias, order flow, and liquidity analysis, this strategy can become one of the most effective trading methods within the ICT Concept framework.
Successful execution of this setup requires risk management, patience, and a deep understanding of liquidity dynamics. Traders can enhance their confidence in this strategy by conducting extensive backtesting and analyzing past market data to optimize their approach for different assets.

Dynamic Support and Resistance Pivot Strategy The Dynamic Support and Resistance Pivot Strategy is a flexible and adaptive tool designed to identify short-term support and resistance levels using the concept of price pivots.
### Key Elements of the Strategy
1. Pivot points as support and resistance levels
Pivots are significant turning points on the price chart, often marking local highs and lows where the price has reversed direction. A pivot high occurs when the price forms a local peak, while a pivot low occurs when the price forms a local trough. When a new pivot high is formed, it creates a resistance level. Conversely, when a new pivot low is formed, it creates a support level.
The strategy continuously updates these levels as new pivots are detected, ensuring they remain relevant to the current market conditions. By identifying these price levels, the strategy dynamically adjusts to market conditions, allowing it to adapt to both trending and ranging markets, since it has a long target and can perform reversal operations.
2. Entry Criteria
- Buy (Long): A long position is triggered when the price is near the support level and then crosses it from below to above. This suggests that the price has found support and may start moving upwards.
- Sell (Short): A short position is triggered when the price is near the resistance level and then crosses it from above to below. This indicates that the price may be reversing and moving downward.
3. Support/Resistance distance (%)
- This parameter establishes a percentage range around the identified support and resistance level. For example, if the Support Resistance Distance is 0.4% (default), the closing price must be within a range of 0.4% above support or below the resistance to be considered "close" and trigger a trade.
4. Exit criteria
- Take profit = 27 %
- Stop loss = 10 %
- Reversal if a new entry point is identified in the opposite direction
5. No Repainting
- The Dynamic Support and Resistance Pivot Strategy is not subject to repainting.
6. Position Sizing by Equity and risk management
- This strategy has a default configuration to operate with 35% of the equity. The stop loss is set to 10% from the entry price. This way, the strategy is putting at risk about 10% of 35% of equity, that is, around 3.5% of equity for each trade. The percentage of equity and stop loss can be adjusted by the user according to their risk management.
7. Backtest results
- This strategy was subjected to backtest and operations in replay mode on **1000000MOGUSDT.P**, with the inclusion of transaction fees at 0.12% and slipagge of 5 ticks, and the past results have shown consistent profitability. Past results are no guarantee of future results. The strategy's backtest results may even be due to overfitting with past data.
8. Chart Visualization
- Support and resistance levels are displayed as green (support) and red (resistance) lines.
- Pivot prices are displayed as green (pivot low) and red (pivot high) labels.
In this image above, the Support/Resistance distance (%) parameter was set to 0.8.
9. Default Configuration
Chart Timeframe: 1h
Pivot Lengh: 2
Support/Resistance distance (%): 0.4*
Stop Loss: 10 %
Take Profit: 27 %
* This parameter can alternatively be set to 0.8.
10. Alternative Configuration
Chart Timeframe: 20 min
Pivot Lengh: 4
Support/Resistance distance (%): 0.1
Stop Loss: 10 %
Take Profit: 25 %
BYBIT:1000000MOGUSDT.P

Supports and Resistances Multi Timeframe - VK TradingThe Supports and Resistances Multi Timeframe - VK Trading indicator is designed to help traders identify key support and resistance levels across multiple timeframes. It integrates real-time market data with smooth, customizable visual markers, allowing traders to quickly spot potential entry and exit points. This tool is particularly valuable for trend-following traders who want to see the most critical levels of price action on various timeframes.
Features:
Multi-Timeframe Support: Display support and resistance levels for the current, first, and second timeframes, helping traders identify price points across different market cycles.
Customizable Appearance: Choose from various colors for levels and bands, as well as transparency settings to match your chart's design.
ATR-based Bands: Uses the Average True Range (ATR) to dynamically adjust the width of support and resistance bands, offering more accurate price movement insights.
Pivot Points: Identifies pivot highs and lows, offering precise support and resistance levels based on the price action.
Smoothing Options: Customize the ATR smoothing method with options like RMA, SMA, EMA, and WMA for better alignment with your trading strategy.
Functionalities:
Quick Level Detection: The indicator highlights the most recent high and low levels on the current timeframe, ensuring you’re always aware of nearby price barriers.
Support and Resistance Visualization: Easily visualize the major support and resistance levels on multiple timeframes, improving decision-making and trade management.
Dynamic Band Widths: Customize the ATR multiplier for each timeframe, adapting the support and resistance bands based on the volatility of the market.
Multi-Timeframe Integration: View price action levels from a broader perspective with support and resistance data from the current, first, and second timeframes all in one chart.
Flexible Timeframe Selection: Choose your preferred timeframes for support and resistance levels, from daily, weekly, to monthly, for broader or narrower market views.
How it Helps Traders:
This indicator is ideal for traders who rely on multi-timeframe analysis to make well-informed trading decisions. By visualizing key support and resistance levels across several timeframes, traders can improve the precision of their entries and exits, better manage risk, and enhance their market timing. The tool provides a comprehensive view of price action, allowing traders to spot potential reversals and breakouts, making it easier to execute strategies effectively.
Disclaimer:
This script is an educational and analytical tool. It does not guarantee specific results or eliminate trading risk. Trading in the financial markets involves significant risks; use this script at your own risk.

Key Prices & LevelsThis indicator is designed to visualize key price levels & areas for NY trading sessions based on the price action from previous day, pre-market activity and key areas from NY session itself. The purpose is to unify all key levels into a single indicator, while allowing a user to control which levels they want to visualize and how.
The indicator identifies the following:
Asia Range High/Lows, along with ability to visualize with a box
London Range High/Lows, along with ability to visualize with a box
Previous Day PM Session High/Lows
Current Day Lunch Session High/Lows, starts appearing after 12pm EST once the lunch session starts
New York Open (8:30am EST) price
9:53 Open (root candle) price
New York Midnight (12:00am EST) price
Previous Day High/Lows
First 1m FVG after NY Session Start (after 9:30am), with the ability to configure minimum FVG size.
Opening Range Gap, showing regular market hours close price (previous day 16:15pm EST close), new session open price (9:30am EST open) and optionally the mid-point between the two
Asia Range 50% along with 2, 2.5, 4 and 4.5 deviations of the Asia range in both directions
Configurability:
Each price level can be turned off
Styles in terms of line type, color
Ability to turn on/off labels for price levels and highlighting of prices on price scale
Ability to control label text for price levels
How is it different:
Identifies novel concepts such as 9:53 open, root candle that can be used as a bounce/resistance area during AM/PM sessions as well as confirmation of direction once closed over/under to indicate price's willingness to continue moving in the same direction.
It also shows 1st 1m FVG after New York Session open, that can be used to determine direction of the price action depending on PA's reaction to that area. While both 9:53 and 1m FVG are 1m based markers, these levels are visualized by the indicator on all timeframes from 15s to 1h.
Additionally the indicator is able to both highlight key prices in the price scale pane as well as combine labels to minimize clutter when multiple levels have the same price.
Lastly for in-session ranges such as Lunch High/Low the indicator updates the range in real-time as opposed to waiting for the lunch session to be over.
Swing Percentile Lines [QuantVue]The Swing High/Low Percentile Indicator is designed to help traders identify key price levels based on the most recent swing high and low. By anchoring to the most recent swing high and swing low, the indicator automatically generates percentile lines ( 25%, 50%, 75%) that act as dynamic support and resistance levels.
What Does the Indicator Do?
The Swing High/Low Percentile Indicator works by identifying the most recent significant price swings, whether it's a swing high or swing low. It then calculates the range between these points and divides the distance into percentage-based levels. These levels are plotted on the chart as clear, easy-to-read lines at 25%, 50%, and 75% of the range between the swing high and low.
These percentile lines serve as dynamic price zones where traders can anticipate potential reactions, whether the market is trending or consolidating.
How Can Traders Use the Indicator?
Support and Resistance: The percentile lines act as evolving support and resistance zones. Traders can anticipate price bounces or breaks at these levels, providing opportunities for trend-following or reversal trades.
Trend Identification: The indicator helps traders determine the strength of a trend. In a strong uptrend, price will likely stay above the 50% or 75% lines, while in a downtrend, it may remain below the 50% or 25% lines. This gives traders an edge in recognizing the overall market direction.
Entry and Exit Points: Traders can use the percentile lines to time their entries and exits. For example, entering a trade on a pullback to the 25% or 50% line offers a favorable risk-to-reward ratio. Similarly, the percentile lines serve as natural profit targets, allowing traders to plan exits as the price approaches the 50% or 75% levels.
Risk Management: The clear delineation of price levels makes it easy for traders to set stop-loss orders. For example, if price falls below the 25% line in an uptrend, it may signal weakness, prompting an exit or reduced position size.
Breakout and Breakdown Scenarios: When price breaks above a recent swing high or below a swing low, the percentile lines provide traders with pullback entry opportunities or key levels to watch for continuation of the move.

Support and Resistance DynamicThis indicator is designed to plot horizontal lines on significant Support and Resistance based on custom user-defined lookback periods. It helps traders identify key levels of support and resistance, improving their ability to detect potential trend reversals or breakout zones.
Key Features:
1. Custom Number of Support and Resistance Lines:
- The script allows users to independently control the number of horizontal lines for Support and Resistance, helping to focus on the most important levels.
2. Adjustable Lookback Period
- Customize the lookback periods for detecting support and resistance, giving you the flexibility to capture different swing points in various market conditions.
3. Minimum Difference Filter:
- The script includes a customizable minimum difference percentage filter to ensure only significant pivots are plotted, avoiding clutter and focusing on more meaningful levels.
4. Automatic Line Extension:
- Pivot high and low lines automatically extend to the right, clearly marking key levels until they are broken or surpassed by price action.
This tool is ideal for technical traders who rely on support and resistance zones for making trading decisions. Whether you are swing trading, day trading, or scalping, these key levels can help enhance your chart analysis.
How to Use:
- Customize the number of support and resistance lines to suit your strategy.
- Adjust the lookback settings to match your timeframe or market conditions.
- Fine-tune the minimum difference percentage to filter out noise and focus on stronger support and resistance.
This script provides a dynamic and customizable way to visualize support and resistance, helping you spot key turning points and make informed trading decisions.
Fractal Levels [BigBeluga]The Fractal Levels - BigBeluga indicator is a specialized tool that detects significant market highs and lows, ranking them by their normalized volume. This indicator is designed to help traders identify crucial price levels that are likely to influence market behavior, enabling better decision-making in trading. By gathering normalized volume around each fractal point, it creates a comprehensive view of the strength and relevance of price reversal points, which can be visualized as numbers or zones on the chart.
🔵KEY FEATURES & USAGE
● High and Low Detection with Volume Ranking:
The indicator detects market highs and lows using a user-defined length setting. For each detected fractal point (high or low), it collects normalized volume from a set number of bars before and after the fractal point (the number is based on the length input). This collection allows the indicator to produce an average of the normalized volume, which is then displayed as a number above or below the corresponding fractal arrows, visually indicating the importance of the high or low.
● Plotting Levels from Fractals:
From these high and low points, the indicator plots key levels. In settings, traders can choose between a wide or tight zone type.
If a price level coincides with multiple pivot points, the indicator highlights this as a significant zone. These zones represent areas where price tends to react, making them critical for identifying potential support and resistance levels.
● Fractal Boxes with Delta Volume Data:
Fractal boxes are shown as gray boxes, representing areas where price pivots occurred, and they also contain delta volume information. Delta volume is calculated by summing the positive and negative volumes within the length range, producing the total delta inside each fractal box. This is particularly useful for analyzing volume shifts around key levels.
● Broken Levels Highlighting:
When a plotted level is broken (price closes above or below it), the level can be removed from the chart automatically. However, in the settings, you can enable a feature to highlight broken levels as gray areas, providing insight into past price behavior. This is helpful for tracking historical support and resistance zones.
> Important note: If no volume data provided indicator wont work
🔵 CUSTOMIZATION
Fractal Length and Filter Settings:
Adjust the Length parameter to control the number of bars used to detect pivot highs and lows. A longer length will result in fewer fractals being identified, focusing on more significant price moves. The Filter option allows you to set a volume threshold, filtering out minor fractals that do not meet the minimum volume requirements.
Levels Detection (Wide or Tight):
Choose between Wide and Tight zones for fractal levels detection. A tight zone focuses on smaller price areas around pivot points, while a wide zone expands the detection range, highlighting larger zones of influence around fractals.
Delta Volume Display for Fractals:
Toggle Delta Volume Fractals to show or hide the delta volume information inside fractal boxes. When enabled, the indicator calculates and displays the total delta volume within the range of bars surrounding each fractal point.
Broken Levels Visibility:
Enable Broken Levels to highlight levels that have been crossed by price. When disabled, broken fractal levels will be removed from the chart after price crosses them.
🔵CONCLUSION
The Fractal Levels indicator provides traders with an advanced way to analyze price highs and lows by combining fractal detection with volume dynamics. By identifying key market levels through normalized volume ranking, delta volume analysis, and level plotting, this tool is invaluable for spotting potential support and resistance zones. Whether you're focusing on short-term trading or longer-term price movements, Fractal Levels offers the precision and flexibility needed to optimize your strategy.

Pivot Data [QuantVue]The Pivot Data Indicator is designed to provide traders with valuable insights by identifying and analyzing pivot points on the price chart. It calculates both pivot highs and lows, then presents detailed statistics on the distance and time between these pivots.
a pivot point is defined as a specific point on the chart where the price either reaches a high or a low, with no bars higher or lower than it for a set number of bars on both sides (left and right). Essentially, it's a local high or low point, with the market moving in the opposite direction after the pivot forms.
For example:
A pivot high occurs when there are no bars with higher prices for a specified number of bars before and after that point.
A pivot low occurs when there are no bars with lower prices for the same number of bars on either side.
The number of bars to the left and right is adjustable via the Pivot Lookback Bars setting, allowing you to define how many bars are used to determine these pivot points.
Key features include:
Pivot Highs and Lows Identification: Automatically marks significant pivot highs and lows based on a user-defined lookback period, helping traders identify potential trend reversals or continuation points.
Prediction Labels: Provides forecasted pivot levels based on historical pivot price and time patterns, with options to show predictions for pivot highs, lows, or any pivot point.
Customizable Table Display: Displays a table summarizing important statistics, such as the average price percentage and the number of bars between pivots, along with the distance and time from the most recent pivot.
Traders can use this tool to map out potential levels of support and resistance based on historical data on pivot points.

Pivot Point Profile [LuxAlgo]The Pivot Point Profile indicator groups and displays data accumulated from previous pivot points, providing a comprehensive method for prioritizing and displaying areas of interest directly given by swing highs and lows.
Users have access to common settings present in other profile-type indicators.
🔶 USAGE
The Pivot Point Profile is particularly helpful in identifying highly active reversal zones that have been visited multiple times by price. Because of this, we could generally expect these areas to serve as future points of interest, often acting as support or resistance when re-visited.
The profile displays data associated with both Pivot Highs and Pivot Lows. Each row consists of pivot high and pivot low counts side-by-side, forming the total width of the row.
By analyzing the row as a whole, we can gain a better understanding of WHERE to look for interactions.
By analyzing the pivot counts independently, we can gain a better understanding of WHAT to expect when returning to these areas.
For example:
If a row in the profile contains entirely Pivot Lows, this could be seen as an indication to look for buyers to hold that level for a continuation upwards. A break of this level could be interpreted as a lack of interest from previous buyers at this level, indicating a further move down.
🔹 Concentrated Areas
Each row in the profile displays the current count of high pivots and low pivots within the selected lookback. The largest count for each pivot direction is identified as a "Concentrated Area (CA)", these CAs are highlighted over the chart with a line displaying the average of all pivots within that CA. The CA Average is the average of all pivot points (in the majority direction) within the given row.
These can hold more importance as potential support/resistance areas.
Note: The CA Threshold can be manually adjusted to highlight all rows based on a user-selected value.
🔶 DETAILS
🔹 Calculation
The idea behind the Pivot Point Profile is a new analysis method for pivot points, taking the idea of a volume profile and adapting it to display pivot points instead of volume. By using this data, in theory, we should be able to better prioritize zones to anticipate reversals, as well as identify key levels to watch for buyer & seller interactions to use as confirmations in direction.
The (vertical) width of each row is the product of the script's "Row Size", this is the number of rows that the profile will consist of. With a max of 250, the profile can be decently granular. That being said, A more granular profile will have fewer overlapping pivot points. By decreasing the row size (Using fewer rows in the profile) you will increase the tolerance for grouping pivot points. Potentially leading to a more comprehensive Profile. Inversely, By reducing the tolerance for grouping, you will better visualize only similar highs and lows but may have noisier data to sift through.
The Profile is calculated based on a "Lookback" parameter, using only the lookback amount of previous high and low pivots to calculate the profile. Configuring this parameter alongside "Pivot Length", will allow for great control over the frame of reference of the profile.
Note: This indicator is capable of utilizing the full chart history of pivot points, this can be done by enabling the "Use Full Chart History" setting, this will cause the script will calculate from everything it has access to on your current chart.
🔹 Display
The Pivot Point Profile display can be customized to fit a various range of chart styles and visual needs. The specific settings to adjust these can be located in the "Profile Display" Section of the User Inputs.
Profile Width: Sets the Left to Right Width of the Profile. This is the maximum width that the profile will occupy and will scale to fit within this width.
Profile Offset: Sets the distance of the Profile's Axis from the current chart candle. This moves the entire profile left and right to enable to user to set the distance between the profile and the current candle.
Direction: Changes the display direction of the profile, allowing for "Left", "Right", or "Center" display styles.
🔶 SETTINGS
🔹 Pivot Point Parameters
Pivot Type: Choose between "Fractal Pivots" or "SMC Structure" to use as the basis for pivots.
Length: Sets the length for the pivot calculations.
🔹 Profile Calculations Parameters
Lookback: Sets the number of pivots to calculate within, in increments of high and low pairs. (Setting this to 1 = 1 Pivot High & 1 Pivot Low)
Use Full Chart History: Disregards the set lookback and instead uses all available chart data to calculate from.
Row Size: Sets the total number of rows to calculate the profile with.
🔹 Profile Display
Profile Width: Sets the max left & right width (in bars) that the profile will occupy.
Profile Offset: Sets the distance of the profile axis from the last chart bar.
Direction: Sets the display direction
🔹 Concentrated Areas
Highlight CAs: Extends the rows left from concentrated areas.
CA Threshold: Manually set the threshold for determining concentrated areas, when disabled, only the largest rows will be displayed.
CA Averages: Toggles the concentrated area averages for each pivot direction.
Note: CA Averages can be displayed independently without CA Highlights being displayed, and vice versa.

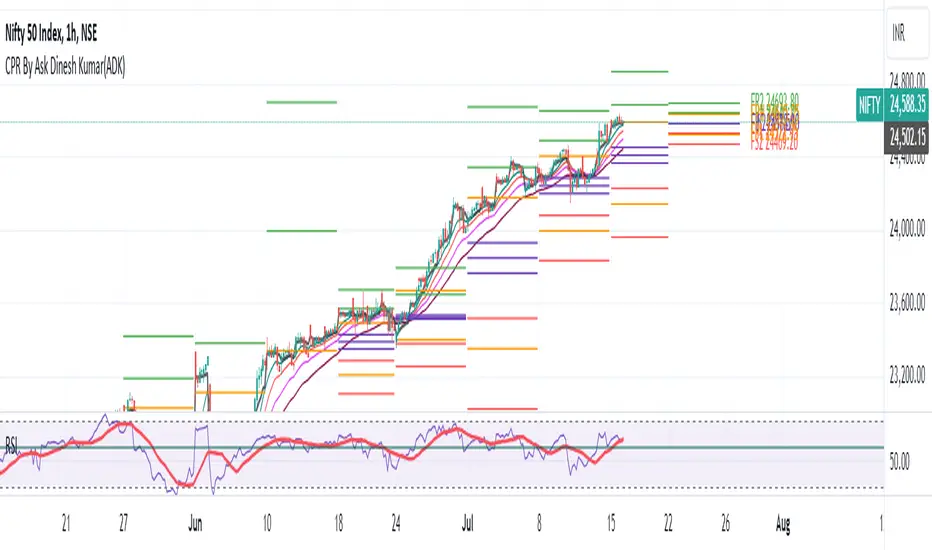
CPR By Ask Dinesh Kumar(ADK)Simple CPR Indicator to increase probability of profitable trades:
The Central Pivot Range (CPR) is a trading tool used by traders to identify potential support and resistance levels in the market. Here's a simplified explanation of how traders can potentially profit using the Central Pivot Range with 10 lines:
1. *Understanding CPR*: CPR consists of three lines: the pivot point (PP), upper resistance level (R1), and lower support level (S1). Additionally, traders often add five more of profitable tradeslines above and below the PP to create a 10-line CPR.
2. *Identify Trend*: Determine the prevailing market trend. If the market is bullish, traders will look for buying opportunities near support levels. If the market is bearish, they'll seek selling opportunities near resistance levels.
3. *Entry Points*: Look for entry points near the support (S1) or resistance (R1) levels within the CPR. These levels can act as potential turning points where price may reverse.
4. *Risk Management*: Set stop-loss orders to manage risk. Stop-loss orders should be placed slightly below support levels for long positions and slightly above resistance levels for short positions.
5. *Profit Targets*: Determine profit targets based on the distance between entry point and the next support or resistance level. Some traders use a risk-reward ratio to ensure potential profits outweigh potential losses.
6. *Confirmation*: Use additional technical indicators or price action patterns to confirm potential entry or exit points within the CPR.
7. *Monitor Price Action*: Continuously monitor price action around the CPR levels. Traders should be prepared to adjust their positions if price breaks through support or resistance levels convincingly.
8. *Trade Management*: Once in a trade, actively manage it by adjusting stop-loss orders, trailing stops, or taking partial profits as price moves in the desired direction.
9. *Market Conditions*: Consider broader market conditions, such as economic indicators, geopolitical events, or news releases, which can impact price movements and the effectiveness of CPR.
10. *Practice and Analysis*: Practice using CPR on historical price charts and analyze past trades to refine strategies and improve decision-making skills.
Remember, trading involves risks, and no strategy guarantees profits. It's essential to thoroughly understand the concepts behind CPR and practice disciplined risk management to increase the likelihood of successful trades.
How does central pivot range work:
Sure here's a concise explanation of how the Central Pivot Range (CPR) works in 10 points:
1. *Calculation*: CPR is calculated using the previous day's high (H), low (L), and close (C) prices.
2. *Pivot Point (PP)*: The central point of CPR is the average of the previous day's high, low, and close prices: PP = (H + L + C) / 3.
3. *Upper Resistance Levels (R1, R2, R3)*: These are potential price levels above the pivot point where resistance may occur. They are calculated by adding a multiple of the range (H - L) to the pivot point: R1 = (2 * PP) - L, R2 = PP + (H - L), R3 = PP + 2 * (H - L).
4. *Lower Support Levels (S1, S2, S3)*: These are potential price levels below the pivot point where support may occur. They are calculated similarly to resistance levels but subtracting multiples of the range from the pivot point: S1 = (2 * PP) - H, S2 = PP - (H - L), S3 = PP - 2 * (H - L).
5. *Trading Signals*: Traders use CPR to identify potential support and resistance levels where price may reverse or stall.
6. *Range Bound Markets*: In range-bound markets, traders may buy near support levels (S1, S2, S3) and sell near resistance levels (R1, R2, R3).
7. *Breakout Trading*: When price breaks through a CPR level convincingly, it may indicate a potential trend continuation or reversal, providing breakout trading opportunities.
8. *Volume and Momentum*: Traders often look for confirmation from volume and momentum indicators when price approaches CPR levels.
9. *Intraday Trading*: CPR can be applied to intraday timeframes as well, providing shorter-term traders with potential trading levels for the day.
10. *Dynamic Indicator*: CPR is dynamic and recalculates daily based on new price data, allowing traders to adapt their strategies to current market conditions.
Understanding how to interpret CPR levels and integrate them into a trading strategy can help traders identify potential entry and exit points in the market.
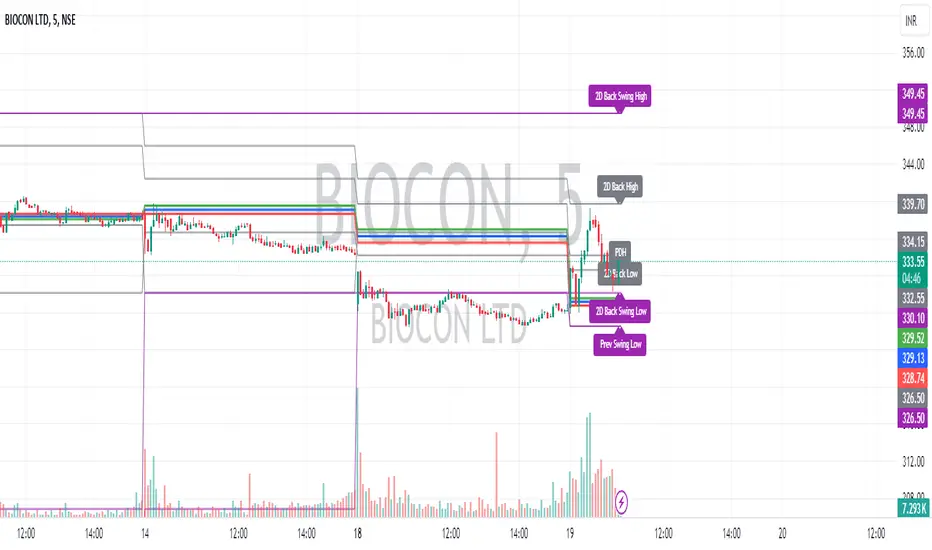
Intraday CPR with Previous Highs and Lows and Swing Highs/LowsThis Pine Script indicator plots the Central Pivot Range (CPR) for the current trading day along with previous day's high (PDH), low (PDL), and swing high/low (Swing H/L) values. It also includes the high, low, and swing high/low values from two days back for reference.
Key Features:
Central Pivot Range (CPR):
Pivot Point (PP): The central pivot point.
Bottom Central Pivot (BC): The lower boundary of the CPR.
Top Central Pivot (TC): The upper boundary of the CPR.
The area between the BC and TC is shaded for better visualization.
Previous Day and Two Days Back Values:
Previous Day High (PDH) and Low (PDL): Plots the high and low of the previous trading day.
Two Days Back High and Low: Plots the high and low from two trading days ago.
Previous Day Swing High/Low: The highest high and lowest low from a specified period (swing period) of the previous trading day.
Two Days Back Swing High/Low: The highest high and lowest low from a specified period (swing period) of two trading days ago.
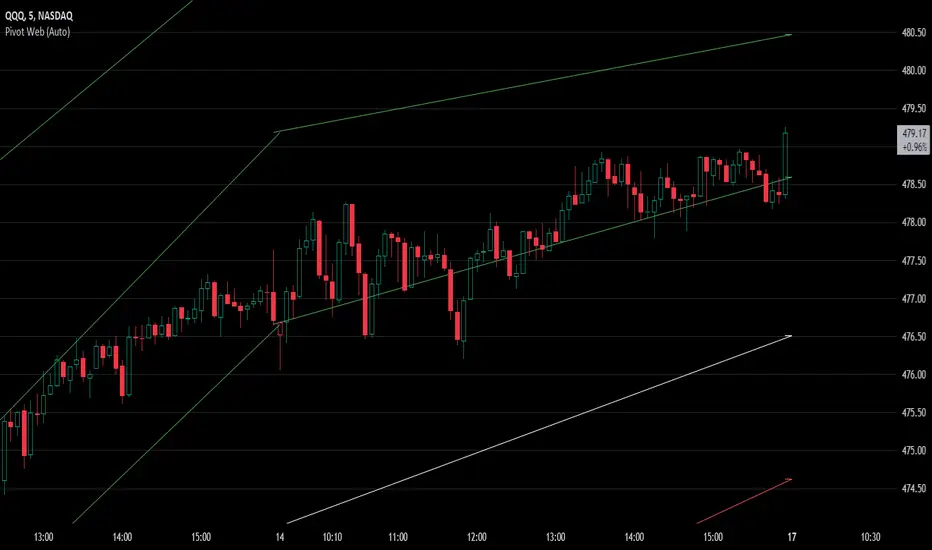
Pivot WebThe Pivot Web is a prototype with its base derived from TradingView's standard pivot point indicator plus inspiration from LuxAlgo's trendline work alongside my own observations/experiences.
The theory is that there's legitimacy, from a technical standpoint, pivot point calculations are an adequate gauge of momentum and sentiment because the same math was used under pressure by floor traders themselves. That calculation is centered on the average of high, low, and closing prices. This indicator creates trendlines connecting the last pivot, support, and resistance levels to the current ones. A dynamic visual cue could make it easier to assess if the price will continue or reverse the current trajectory. This method also shows us an excellent visual for volatility.
Key Takeaways:
This indicator draws new dynamic trendlines.
These new trendlines connect the past and present pivot point levels based on the timeframe you select.
Shorter timeframes = More trendlines
Price adherence to the path of these lines may offer insight for trading.
Lastly, note the first set of data in each new timeframe displays the current original pivot point levels along with the trendlines attached to their ending point. Most of the time this indicator leaves room by briefly highlighting the original static levels with all levels also being optional displays. Also note that a more stable asset may not require the outermost support and resistance levels. Like most time series analysis tools, the Pivot Web requires current data to function properly.
"Nature is pleased with simplicity, and nature is no dummy."
Stop Hunts [MK]Liquidity rests above/below previous highs and lows because these are the areas where traders are most likely to leave their orders/stop losses. The market can tap into this liquidity source by going beyond the previous highs and lows, this liquidity can then be used to reverse the market in the opposite direction.
As traders we may want to know if price will continue beyond previous highs and lows, or reverse the market. If price looks to be reversing after tapping into liquidity, this can be a good area to enter a trade. The same area can be used as a take profit level also.
The indicator identifies previous high/lows in two ways:
1. previous high/lows using 'PIVOT POINTS'. Pivots are easy to spot and are obvious within a price trend. Also called 'higher highs", "lower lows" etc. The number of candles required to form the pivot point can be adjusted in the script settings.
see below example of pivot point and stop hunt:
www.tradingview.com
see how price reversed upwards after stop hunt on pivot point above.
2. previous candle high/lows. A previous candles high and low are also good areas of liquidity.
see below example of previous candle stop hunt:
see how price reversed upwards after stop hunt on previous candle low above.
Personally, I use the pivot point stop hunts on lower timeframes and previous candle stop hunts on higher timeframes. However users can adjust on which timeframes to show the indicator depending on their own trading style.
As ever all items within 'settings' are customizable.
The indicator is by no means a 'trading strategy' and users should be fully aware of the stop hunt concept and have conducted extensive back-testing before using with 'live' accounts.
The indicator may also serve as a 'teaching aid' to new students and as a reminder to more experienced traders.

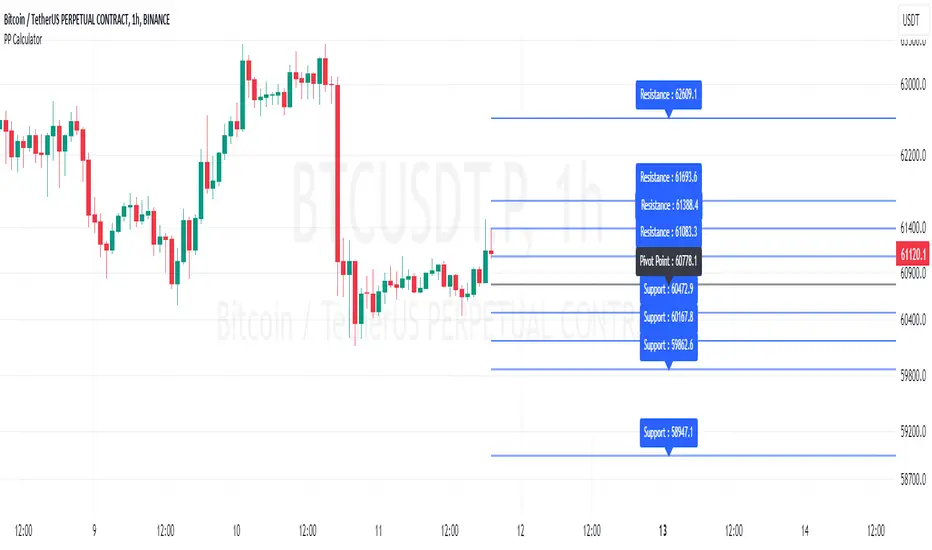
Pivot Point Calculator [JP&Dia]English User Guide
Script Name: Pivot Point Calculator
What Does This Script Do? This script calculates classic and Camarilla pivot points used in financial markets. Pivot points are used to identify key support and resistance levels, and this script helps traders better understand market movements.
How to Use It?
Add the script to your charts on TradingView.
Enter your desired time frame in the “Enter Time Frame” field (e.g., M, W, D).
Choose either or both “Classic Pivot” and “Camarilla Pivot” options to display them.
The script will automatically calculate the pivot points and display them on the chart.
Why Is This Script Unique? This script combines both classic and Camarilla pivot calculations, allowing users to easily utilize both pivot styles through a single script.
How Can People Benefit? Traders can use this script to identify potential buy-sell points and market trends. They can also conduct their market analyses more efficiently and effectively.
Script Adı: Pivot Noktası Hesaplayıcı
Script Ne İşe Yarar? Bu script, finansal piyasalarda kullanılan klasik ve Camarilla pivot noktalarını hesaplar. Pivot noktaları, önemli destek ve direnç seviyelerini belirlemek için kullanılır ve bu script, yatırımcıların piyasa hareketlerini daha iyi anlamalarına yardımcı olur.
Nasıl Kullanılır?
Scripti TradingView’deki grafiklerinize ekleyin.
“Zaman Dilimi Girin” alanına istediğiniz zaman dilimini girin (Örneğin: M, W, D).
“Classic Pivot” ve “Camarilla Pivot” seçeneklerinden birini veya her ikisini de seçerek gösterilmesini sağlayabilirsiniz.
Script otomatik olarak pivot noktalarını hesaplayacak ve grafik üzerinde gösterecektir.
Neden Özgü Bir Script? Bu script, hem klasik hem de Camarilla pivot hesaplamalarını birleştirir ve kullanıcıların her iki pivot stilini de tek bir script üzerinden kolayca kullanmalarını sağlar.
İnsanlar Nasıl Faydalanabilir? Yatırımcılar, bu scripti kullanarak potansiyel alım-satım noktalarını ve piyasa trendlerini belirleyebilirler. Ayrıca, piyasa analizlerini daha verimli ve etkili bir şekilde yapabilirler.
Fib Pivot Points HLThis TradingView indicator allows users to select a specific timeframe (TF) and then analyzes the high, low, and closing prices from the past period within that TF to calculate a central pivot point. The pivot point is determined using the formula (High + Close + Low) / 3, providing a key level around which the market is expected to pivot or change direction.
In addition to the central pivot point, the indicator enhances its utility by incorporating Fibonacci levels. These levels are calculated based on the range from the low to the high of the selected timeframe. For instance, a Fibonacci level like R0.38 would be calculated by adding 38% of the high-low range to the pivot point, giving traders potential resistance levels above the pivot.
Key features of this indicator include:
Timeframe Selection: Users can choose their desired timeframe, such as weekly, daily, etc., for analysis.
Pivot Point Calculation: The indicator calculates the pivot point based on the previous period's high, low, and closing prices within the selected timeframe.
Fibonacci Levels: Adds Fibonacci retracement levels to the pivot point, offering traders additional layers of potential support and resistance based on the natural Fibonacci sequence.
This indicator is particularly useful for traders looking to identify potential turning points in the market and key levels of support and resistance based on historical price action and the Fibonacci sequence, which is widely regarded for its ability to predict market movements.
Example:
Suppose you're analyzing the EUR/USD currency pair using this indicator with a weekly timeframe setting. The previous week's price action showed a high of 1.2100, a low of 1.1900, and the week closed at 1.2000.
Using the formula ( High + Close + Low ) / 3 (High+Close+Low)/3, the pivot point would be calculated as ( 1.2100 + 1.2000 + 1.1900 ) / 3 = 1.2000. Thus, the central pivot point for the current week is at 1.2000.
The range from the low to the high is 1.2100 − 1.1900 = 0.0200 1.2100−1.1900=0.0200.
To calculate a specific Fibonacci level, such as R0.38, you would add 38% of the high-low range to the pivot point: 1.2000 + ( 0.0200 ∗ 0.38 ) = 1.2076 1.2000+(0.0200∗0.38)=1.2076. Thus, the R0.38 Fibonacci resistance level is at 1.2076.
Similarly, you can calculate other Fibonacci levels such as S0.38 (Support level at 38% retracement) by subtracting 38% of the high-low range from the pivot point.
Traders can use the pivot point as a reference for the market's directional bias: prices above the pivot point suggest bullish sentiment, while prices below indicate bearish sentiment. The Fibonacci levels act as potential stepping stones for price movements, offering strategic points for entry, exit, or placing stop-loss orders.

Alpha Edge Pro - Intraday [LevelUp]Alpha Edge Pro™ is a collection of tools for intraday analysis built in collaboration with Brian Shannon, CMT, creator of the anchored VWAP (AVWAP) and the author of two best-selling books on technical analysis.
🔹—— Key Features ——🔹
▪ AVWAP auto-anchored on 1-day, 2-day, week-to-date and month-to-date.
▪ AVWAP works with any global exchange, respecting trading days, hours & holidays.
▪ AVWAP and the TradingView Replay are excellent for historical analysis.
▪ 5-day moving average auto-calculated based on the chart timeframe.
▪ 5-day moving average auto-adjusts the minutes in the trading day for crypto and futures.
▪ View up to two daily moving averages on intraday charts.
▪ Pivot points (floor trader pivots) highlight support/resistance levels (R1/S1, R2/S2, etc).
▪ Highlight current and prior day highs/lows as these are areas of potential support and resistance.
▪ Comprehensive stats tables for AVWAP, price highs/low, pivots and ATR (average true range).
▪ Custom alerts for AVWAP, pivot points and 5-day moving average.
🔹—— AVWAP ——🔹
The Volume Weighted Average Price (VWAP) is the cumulative average price a stock traded for one day. AVWAP is the same as the VWAP with the exception that the start point (the anchor) is configurable based on a trader's preference, not simply the start of the trading day. From the anchor point forward, on each bar, AVWAP is calculated based on the cumulative volume and average price.
The AVWAP shows the relationship between price and volume over any time period based on the anchor point. At a glance we can see who is in control, the buyers (bulls) or the sellers (bears).
AVWAP Concepts
▪ When a stock is above an advancing AVWAP, buyers are in control for that timeframe, as the average price is increasing.
▪ When prices are below a declining AVWAP, sellers are in control for that timeframe, as the average price is declining.
▪ When prices oscillate above and below the AVWAP it indicates indecision for that timeframe.
What's unique about AVWAP in this indicator is that it is auto-anchored on 1-day, 2-day, week-to-date and month-to-date. In addition, Alpha Edge supports any exchange around the globe, respecting trading days, hours and holidays. You can also use the TradingView Replay feature with this indicator, a powerful tool for historical and post-mortem analysis.
▪ 1-Day, 2-Day and Week-To-Date
▪ Saudi Exchange (Tadāwul)
Trading Days: Sunday to Thursday, 10:00am to 3:00pm.
Auto-Anchor: Detects start of trading week.
▪ London Stock Exchange (LSE)
Trading days: Monday to Friday, 8:00am to 4:30pm.
Auto-Anchor: Detects U.K. bank holiday.
▪ Review Historical Data and Past Trades
🔹—— 5-Day Moving Average ——🔹
A common trend following theme is to look for stocks where the trend of the 50-SMA is upward. We can view intraday charts to see if the price action is setting up for a low risk trade by verifying that the shorter timeframe aligns with the longer. As we look at various timeframes, we need to make sure the moving average is consistent across the timeframes, which is done via the 5-day moving average as explained by Brian Shannon:
"If you want to see a five DAY moving average on a chart with 10 minute candles, you have to consider how many 10 minute periods of trading there are in the trading day. The US equities markets are open from 9:30- 4:00 each day, which is 6.5 hours per trading day. In each hour of trading, there are 6-10 minute periods, so during the regular session for equities, the market is open for 390 minutes or 39-10 minute periods per day. If we are to get a five day moving average, we would take the 39-10 minute periods the market is open each day and then multiply that by five days. 39 x 5 = 195. So a 5 DAY moving average is represented by a 195 PERIOD moving average when looking at a 10 minute timeframe."
As trend followers, our goal is to find stocks where the 5-day moving average is trending up.
In Alpha Edge, the default value for the minutes per day is 390, the number of minutes in one trading day in the U.S. This value can be changed to match any exchange. For example, if trading the India National Stock Exchange (NSE), which is open from 9:15am to 3:30pm, the minutes per day could be set to 375.
Minutes per day are auto-adjusted for crypto and futures:
▪ Crypto: 1440 minutes per day based on 24 hrs per day.
▪ Futures: 1380 minutes per day based on 23 hrs per day.
▪ 5-Day Moving Average Trending Up
Important Note: Based on the math as described above using the minutes in the trading day, there will be chart timeframes where the 5-day moving average is not shown. If you have the 5-day moving average enabled from within the indicator Settings, yet the 5-day line is not visible, try changing to another timeframe.
🔹—— Vertical Start Line - Anticipating Direction ——🔹
By placing a vertical line on the bar where the 5-day moving average begins, one can anticipate the trend by viewing the bars that will fall off the moving average as new bars are added. This can be helpful to gauge if the trend will continue in its current trajectory or begin to move in a different direction.
▪ 5-Day Vertical Line
🔹—— Intraday and Daily Moving Averages ——🔹
In addition to custom moving averages based on intraday price action, there are two configurable daily moving averages. Viewing daily moving averages on intraday charts can be helpful as they often act as areas of support/resistance.
▪ Daily 10-EMA on Intraday Chart - Acting as Support
▪ Daily 50-SMA on Intraday Chart - Acting as Resistance
🔹—— Current and Prior Day Highs & Lows ——🔹
Linda Raschke, a legendary trader featured in Jack Schwager’s book, New Market Wizards, on the importance of tracking the previous day's price range:
"If I could trade with only one indicator, it would be with the previous day’s high and low. The reason why they are so important is this is where support and resistance come in and they are also the most visible chart points for all market participants. They are very strong psychological markers.”
With Alpha Edge, there are clear visual indicators, with optional price data, marking both current and prior day high/low values. This makes it easy to view potential areas of support/resistance. These areas can also be considered for entering, exiting or profit taking.
▪ Prior Day & Current Day Highs/Lows
🔹—— Pivot Points ——🔹
Floor trader pivot points are price levels that may act as areas of support or resistance. These pivot points were initially created by floor traders operating within the trading pits of the equity futures exchange in Chicago, Illinois.
The calculations for determining these pivots are based on the prior day's high, low and close:
Pivot (P) = (prevHigh + prevLow + prevClose) / 3
Resistance R1 = (2 * P) - prevLow
Support S1 = (2 * P) - prevHigh
Resistance R2 = P + (prevHigh - prevLow)
Support S2 = P - (prevHigh - prevLow)
Resistance R3 = prevHigh + (2 * (pivot - prevLow))
Support S3 = prevLow - (2 * (prevHigh - pivot))
▪ R1 Acting as Resistance
▪ S1 Acting as Support
🔹—— Stats Table ——🔹
With the stats table, at a glance you can view AVWAP values, current and prior days highs/lows, pivot points as well as the ATR (average true range). Each section in the table can be toggled on/off.
▪ Stats Table
🔹—— Custom Alerts ——🔹
Alpha Edge indicator supports the following custom alerts:
▪ 1-day & 2-day AVWAP cross.
▪ WTD/MTD AVWAP cross.
▪ R1/R2 and S1/S2 cross.
▪ 5-day moving average cross.
🔹—— Best Practices ——🔹
▪ Look for confirmation of an uptrend on multiple timeframes.
▪ Use multiple signals and/or patterns for confirmation of the trend.
▪ Avoid chasing extended stocks.
▪ Always define risk before entering a trade — know where you’ll exit.
▪ Size positions based on volatility and conviction, not emotion.
▪ Be patient — trends take time to develop.
付費腳本

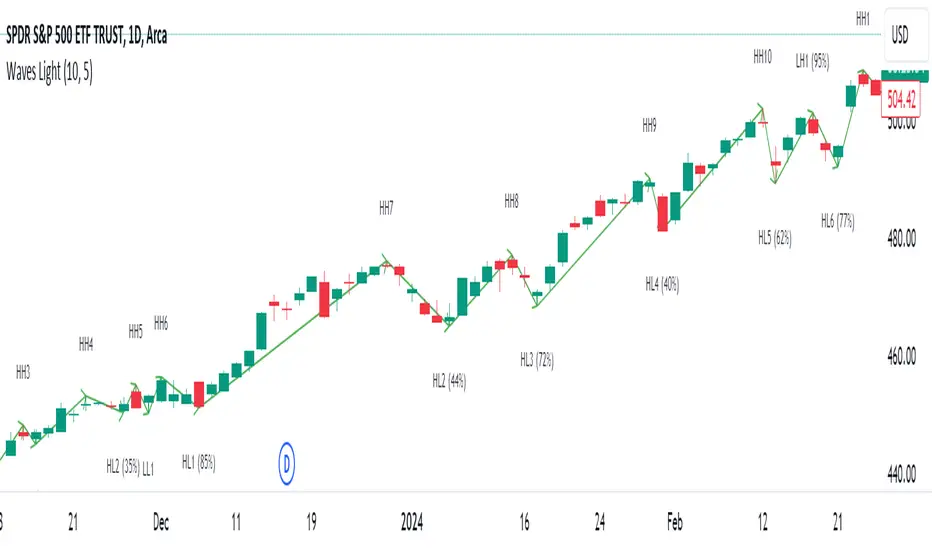
HT: Waves LightIndicator visualizes waves, based on candlestick analysis (one-time-framing and price action concepts), eliminating subjectivity bias that often plagues manual charting of waves. It also doesn’t require much tuning to adjust for specific ticket unlike zigzag or other volatility-based indicators.
Waves can be used to detect current trend and assess its healthiness. For example, we can compare lengths of bullish and bearish waves to detect shift in power. Also, visualization of waves makes it easy to identify chart patterns such as double tops/bottoms, head-and-shoulders etc…
Another application is using waves’ pv points as reference levels to check for Change of Character. For example, in an uptrend higher low (HL) often acts as major support level. If broken it indicates a major change of character (i.e. possible trend reversal)
How it works?
Waves construction:
• Wave construction depends on the selected timeframe.
• Bullish wave lasts while every new candlestick low is higher than previous candlestick low. Breaking of this rule marks change of direction.
• Bearish wave lasts while every new candlestick high is lower than previous candlestick high. Breaking of this rule marks change of direction.
• Outside bars (when new high is higher than previous and new low is lower than previous) are interpreted as continuation of current direction unless counter-movement is really strong
• There is a time lag, measured in candlesticks, between actual direction change and when this change was detected (small triangle markers on the chart)
• Only confirmed bars are used for calculations.
Trend detection:
• Trend detection is based on price-action principle. Uptrend is marked by rising highs and lows; downtrend - by falling highs and lows. We need at least two highs and two lows to confirm trend.
• There are situations of uncertainty when we have higher low and lower high at the same time. They can resolve into continuation of the current trend or into its reversal. Such situations are drawn in gray color.
Pivot Points
Indicator does marking of pivot points based on their relative position - higher low (HL), lower low (LL), higher high (HH), lower high (LH) – and shows retracement level for correction waves.
Parameters:
• Allowance - allowance in ticks that must be exceeded to trigger direction reversal. E.g. if value = 10, then bullish wave ends when new candle low is 10 ticks lower than previous candle low (except for outside bars). Low values are recommended for lower timeframes and/or low volatility tickets; higher values – for higher timeframes and/or high volatility.
• Periods Back – number of candles back from the direction change signal to look for pivot low/high. In 90% of cases 5 is the optimal value but sometimes you might want to increase it for better fit (e.g. for low timeframes/low volatility)
Disclaimer
This indicator should not be used as a standalone tool to make trading decisions. It should be used in conjunction with other technical analysis methods.
Pivot Break [ProjeAdam]OVERVIEW
This indicator provides us great convenience when analyzing the parity by drawing a range at the highest, lowest and middle levels of the previous time period in the time period we choose, and showing where the price is currently in the range it has created in the past.
ALGORITHM - How does the indicator work ?
It draws the highest and lowest values in the time of the parity you selected in the previous ‘’Time Value’’ setting by creating a range.
We can change our ‘’Time Value’’ from the settings.
In the example above, we select our Time Value setting as "Monthly" and it draws the highest and lowest values of the month in the past parity.
In this example above, we select our Time Value setting as "Weekly", it captures the highest and lowest values of the price of the past week.
The algorithm automatically plots the selected Time Value of the price in the past.
When our price falls below its past value by the Time Value we selected, our background color becomes red.
In the example above, our background becomes red for places where the price has fallen below the values of the past week
When our price rises above its historical value by the Time Value we selected, our background color becomes green.
In the example above, our background is green for the places where the price breaks above last week's values.
When breaking up or down, our background color changes only at the first break and an alarm comes here.
The breakdowns in this indicator can also be used as an auxiliary tool in trend analysis.
While the price breaking the previous time frame up and holding there is a positive confirmation for the uptrend in the market, we can consider the price breaking the previous time frame down and holding here as a downtrend in the parity.
SETTINGS PANEL
1-We can change Language of Price Labels
2-We can choose the past time highest or lowest of our price with which we want to create a range
3-Show background of break up and break down
4-If we activeted buttons allow us to receive alarms in case of breakdown in these parities that we activate.
If you have any ideas what to add to my work to add more sources or make calculations cooler, suggest in DM .

Pivot Points [MisterMoTA]The Pivot Points indicator by MisterMoTA allow users to get pivots points calculated from last candle high, low and close on any timeframe from 1 minute to weekly.
This will help users that are trading ins small timeframes to see the pivots that are near their timeframes and not only daily timeframe.
Here is an example on the chart from nex image the timeframe is set to 1 minute and pivot points displayed are at 15 minutes :
The users have control on pivots colors, pivot labels colors, text color from labels, decimal numbers displayed in the labels and style of the pivots lines.
Please follow me for other script like this one.
Kind regards,
MisterMoTA

Bitcoin as Heikin Ashi Candles with Pivot PointsI use this Indicator to show me where Bitcoin is heading.
Most pine programmers are not aware of the possibility to combine Heikin Ashi Candles with Pivot Points that easy.
You can switch between Traditional, Fibonacci, Woodie, Classic, DM, and Camarilla as usual.
When on a Intraday Chart it will automaticly calculate daily Pivots for Haikin Ashi candles.
On the daily Chart it will calculate weekly Pivots, and when switching to monthly candles it will calculate Pivots for one year.
There is also an option where you can deactivate all support and resistance lines, except for today. Meaning you will see the Central Pivot Point on all previous days only.
This is a lagging indicator!
When you can see Altcoin correlation with BTC then both might get pretty strong leading indicators.
I am pleased to hear some advice/wishes to improve this script.
It is still in the beginning and some updates will follow, I promise.
Happy Trading!

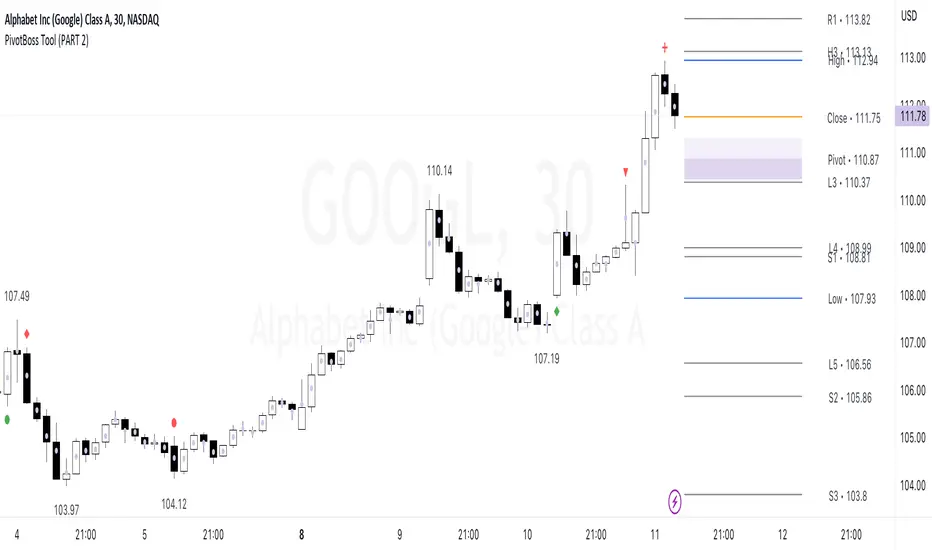
PivotBoss Tool (PART 2)Hello Everyone,
This indicator is being published on TradingView to help traders solve their multiframe EOD analysis issue and at the same time get additional information of other crucial information - CandleStick Patterns, Candlestick Midpoint and ATR Trails for trailing your SL's all under one single frame.
This indicator is based on the concepts of Secrets of Pivot Boss by Mr.Frank Ochoa and strives to provide more insightful information of pivot points and other general indicators being used by traders on day-to-day basis in the simplest format possible so that traders of all kinds can relate to the same.
And, this is purely dedicated to EOD analysis.
What is the moat of this Indicator?
This particular indicator is designed to help the traders in their EOD analysis as this indicator is well equipped to provide the next session trading pivot points well in advance at the end of the current day trading session. A trader has everything required for an EOD analysis in this particular indicator.
Below is the brief information of the indicator table you see in the layout of the above chart -
#Next Session Pivots
One can plot this feature to find out the developing pivot levels for upcoming D/W/M/Q/Y alongside it's additional pivot levels such as:
- Future Camarilla Pivots (H3/H4/H5 & L3/L4/L5)
- Future Floor Pivots (R1/R2/R3 & S1/S2/S3)
- Future CPR levels (TC/PIVOT/BC)
#Developing Pivot Cloud
One can check the developing CPR in Intraday itself by enabling the pivot cloud feature which can tell you multiple information to be with the trend and it's participants.
Basically a live extension of the current trading CPR according with the progress of the trading day.
#CandleStick Mid-Point
This can plot the midpoint of each candlestick on any timeframe for better understanding of buyer/seller's absorption!
#Candlestick Pattern Scans
So one can now easily filter out the candlesticks patterns which helps in decoding the chart in a better format for entry and exits. There are 4 candlesticks patterns included -
- Wick Reversal Pattern -
This pattern basically tells the wick strength which is actually a liquidity absorption by the stronger hand and the intensity and further direction of the move depends on the position of wick candle being formed indicated by green (bull) or red (bear) signal.
- Doji Reversal Pattern -
This pattern basically is used to identify the biasness of the market participants and further identifies a pause in the ongoing trend or a pause for the trend to get further liquidity for broader strength.
- Outside Reversal Pattern -
This pattern depicts the range of the previous candle of a specific timeframe has been tested at both the extreme and probably the price will consolidate in the that visible range for a while.
- Extreme Reversal Pattern -
This pattern basically points at a setup that looks for an extreme pattern of selling pressure and then looks to fade this behavior to capture a bullish move higher (reverse for shorts) and vice versa .
#ATR Trails
This a just a supertrend indicator sourced with ATR to track a short/long term trend change and can be used for trailing SL's when they are kept tight for big positions!
#CPR Trails
This is the most interesting feature with multiple permutations & combinations and can be used to analyse intraday as well as EOD and positional trends. Moreover, THIS FEATURE CAN ALSO INDENTIFY MICRO INTRADAY TREND AS SMALL AS EACH 5M TREND!!
This indicator will be updated with time and depending on community's feedback and requirements.
Credits -
- Mr. Frank Ochoa (Concepts and ideas from the book 'Secrets of PivotBoss' )
- TradingView (Providing a platform to traders to simply their trading through 'PineScript')
Regards,
Mukkull