Clone Pivots. Oct_2023Conceptually very simple.
The all time high or low of the chart (this indicator can be used with non-price sources as well), is used to divide the price pane continuously by 2.
For example the first pivot is (All Time High + All Time Low)/2.
From this point the price chart is further divided by 2.
The user can set the depth of division, and the lines for depth are only shown around the price.
About clone pivots.
- they can be used for ladder trading
- they are based on the range of the stock or instrument price
An alternative is available to use Fib divisions rather than simple divide by 2 method.
Labels may be placed with price or without. And depth of labelling is also an option.
Clone pivots at 50% tend to work very well with price structures - give it a try and see if it helps your trading!
Pine source uses UDTs, Methods, Arrays and Maps.
樞軸點

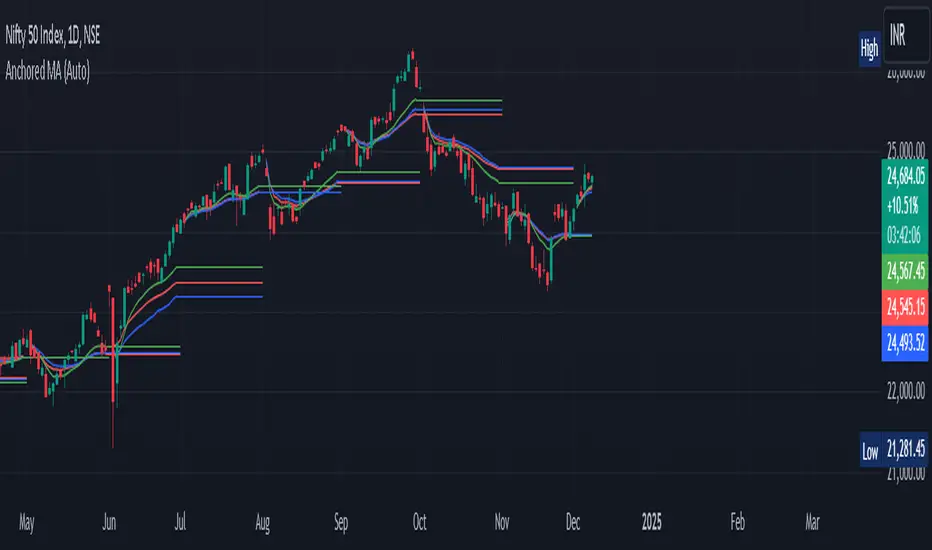
Anchored Moving Average By Market Mindset - Zero To EndlessAnchored Moving Average?
An anchored moving average (AMA) is created when you select a point on the chart and start calculating the moving average from there. Thus the moving average’s denominator is not fixed but cumulative and dynamic.
In this indicator, I've provided three different types of Anchored Moving Averages, viz., WMA, SMA and VWAP.
WMA is relevant if big moves are there.
SMA is relevant if volume data is not to be considered or if it is not available.
VWAP is the standard anchored MA, which is most commontly used. Is consider the volume data along with the price move.
In this indicator, Auto anchor is time based anchor. A trader can opt for Pivot Type Anchor or Volume Type Anchor or some higher resolution based anchor too. The length of the pivot lookback can also be changed by the user.
It can be used for intraday, swing trading and even for technical based investment purpose.
Double Tops & Bottoms [QuantVue]This indicator is designed to detect and plot Double Tops and Double Bottoms, by setting the initial high or low using standard pivot points.
Double Tops
A Double Top is a bearish reversal pattern, typically found when an uptrend returns back to a prior peak. It signifies a potential turning point or resistance level and could potentially reverse in direction.
The pattern is confirmed as a Double Top when the price breaks above the resistance level, but closes below it. A decisive close below this level is seen as a confirmation of the bearish trend.
Double Bottoms
A Double Bottom, on the other hand, is a bullish reversal pattern typically found after a downtrend. It signals a potential turning point or support level where the price has bottomed and could potentially reverse upwards.
The pattern is confirmed as a Double Bottom when the price breaks below the support level, but closes above it. A decisive close above this level is viewed as a confirmation of the bullish trend.
Indicator Features
🔹Double Top Detection: When a double top is identified, a downward-pointing triangle will be plotted above the bar, and if the alerts are enabled, a notification will be triggered.
🔹Double Bottom Detection: When a double bottom is identified, an upward-pointing triangle will be plotted below the bar, and if the alerts are enabled, a notification will be triggered.
🔹Pivot Lookback: Defines the number of bars to the left and right of the pivot that must be lower/higher to qualify as a pivot.
🔹Maximum Length Between Tops/Bottoms: Maximum number of bars between two tops/bottoms to be considered a double top or bottom.
🔹Style Settings: Allows the user to customize the appearance of the lines indicating the tops/bottoms. Options include color selection, line style (dotted, dashed, or solid), and line thickness.
🔹Alerts: The user can enable or disable alerts for Double Top and Double Bottom.
Give this indicator a BOOST and COMMENT your thoughts!
We hope you enjoy.
Cheers!

Expanded Camarilla Levels (R5 + R6)Just the usual cam pivot points updated to have a few more levels.
Added R5/S5 and S5/S6

FV1H MS Input_230906_coThis script allows the user to visualize a momentum shifts on the candlestick charts. This is a visual indicator to help the trader quickly recognize if a potential trade exists where the market sentiment might be changing. The MS occurs when the below parameters are followed:
Creates red triangle on the chart when:
1) at the close of a green candle that was preceded by 3 or more red candle closes
2) The RSI falls below 35 during of the candles or wicks
3) The Bollinger band is pierced at any point (regardless of close) during that series of candles
Creates red triangle on the chart when the conditions are :
1) n the chart when at the close of a red candle that was preceded by 3 or more green candle closes
2) The RSI goes above 70 during of the candles or wicks
3) The Bollinger band is pierced at any point (regardless of close) during that series of candles

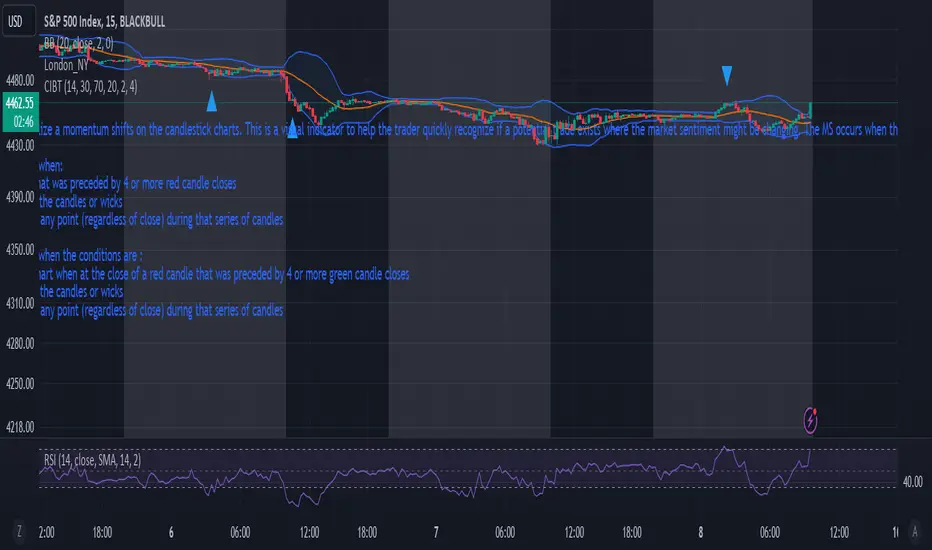
FV 15min MS_230906_coThis script allows the user to visualize a momentum shifts on the candlestick charts. This is a visual indicator to help the trader quickly recognize if a potential trade exists where the market sentiment might be changing. The MS occurs when the below parameters are followed:
Creates blue triangle on the chart when:
1) at the close of a green candle that was preceded by 4 or more red candle closes
2) The RSI falls below 30 during of the candles or wicks
3) The bollinger band is pierced at any point (regardless of close) during that series of candles
Creates blue triangle on the chart when the conditions are :
1) creates a blue triangle on the chart when at the close of a red candle that was preceded by 4 or more green candle closes
2) The RSI goes above 70 during of the candles or wicks
3) The bollinger band is pierced at any point (regardless of close) during that series of candles
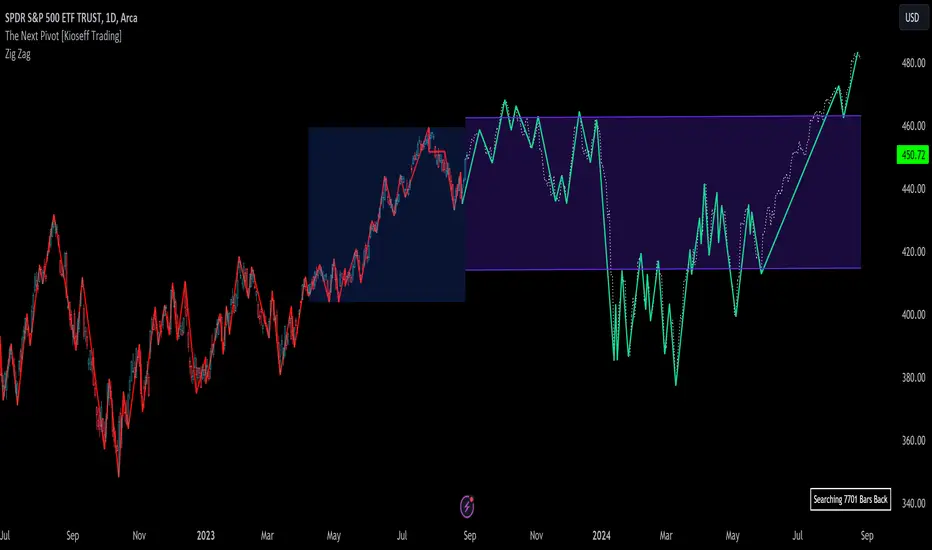
The Next Pivot [Kioseff Trading]Hello!
This script "The Next Pivot" uses various similarity measures to compare historical price sequences to the current price sequence!
Features
Find the most similar price sequence up to 100 bars from the current bar
Forecast price path up to 250 bars
Forecast ZigZag up to 250 bars
Spearmen
Pearson
Absolute Difference
Cosine Similarity
Mean Squared Error
Kendall
Forecasted linear regression channel
The image above shows/explains some of the indicator's capabilities!
The image above highlights the projected zig zag (pivots) pattern!
Colors are customizable (:
Additionally, you can plot a forecasted LinReg channel.
Should load times permit it, the script can search all bar history for a correlating sequence. This won't always be possible, contingent on the forecast length, correlation length, and the number of bars on the chart.
Reasonable Assessment
The script uses various similarity measures to find the "most similar" price sequence to what's currently happening. Once found, the subsequent price move (to the most similar sequence) is recorded and projected forward.
So,
1: Script finds most similar price sequence
2: Script takes what happened after and projects forward
While this may be useful, the projection is simply the reaction to a possible one-off "similarity" to what's currently happening. Random fluctuations are likely and, if occurring, similarities between the current price sequence and the "most similar" sequence are plausibly coincidental.
That said, if you have any ideas on cool features to add please let me know!
Thank you (:
Auto Fibonacci Levels [MisterMoTA]Using Auto Fibonacci Levels indicator users can find automatically Fibonacci Extension points where price can go after a period of consolidation (sideways or can find points for support/resistance on retracement levels that can be displayed for any defined range.
The script is different from others by letting users to define a consolidation range, user can input the time when range ends and the number of candles for looking back from the defined time, default value is 16 candles.
Users have total control over range definitions, fibonacci numbers, colors and option to show or hide the lines.
The user can choose to display Fibomacci Bullish Expansion levels and also Fibonacci Bearish Expansion level.
After a move hit a resistance or support can be choosed a range to find retracement levels, Bullish or Bearish retracement levels can be displayed checking the options from the indicator pannel.
Here are few examples of usage:
1. Bullish expansion (extension)
2. Bearish expansion (extension)
3. Bullish Retracement
4. Bearish Retracement
The indicator can be used on any timeframe for any pairs, stocks, crypto, forex.

Daily Pivots with Fakeout Protection█ OVERVIEW
The "Daily Pivots with Fakeout Protection" indicator is a powerful tool designed to help traders identify potential price breakouts and pivot levels on daily charts. This indicator calculates and displays daily pivot points along with breakout lines that are adjusted to provide a certain level of protection against fakeouts, which are false price movements that can mislead traders.
█ FEATURES
• Pivot Timeframe Selection: You can choose the timeframe for the pivot calculations. The default is set to daily (D), but you have the flexibility to select other timeframes as well.
• Fakeout Protection: A percentage-based parameter allows you to define the amount of protection you want against fakeouts. This helps filter out potentially unreliable breakouts.
• Bullish and Bearish Signals: The indicator distinguishes between bullish and bearish conditions by comparing the closing price to the daily high and low.
• Breakout Signals: Triangular symbols (upward and downward) appear below and above bars to signal potential breakout points. These are based on the closing price crossing the adjusted breakout lines.
• Visual Representation: Pivot points, daily high, and daily low are plotted on the chart, with distinctive line styles and colors for easy identification.
• Background Highlighting: The background color of the chart changes when a new period begins, helping you quickly recognize the start of a new trading day.
• Color-Coded Zones: The indicator colors the background around the closing price differently based on whether the market is bullish (green) or bearish (red).
█ HOW TO USE
1 — Apply the "Daily Pivots with Fakeout Protection" indicator to your TradingView chart.
2 — Customize the parameters like pivot timeframe and fakeout protection percentage according to your trading preferences.
3 — Watch for the triangular breakout symbols that appear above and below bars, indicating potential breakout points.
4 — Keep an eye on the pivot points, daily high, and daily low lines to understand price levels relevant to the current trading day.
5 — Use the background color changes to quickly identify the beginning of a new trading day and any potential shifts in market sentiment.
Note:
• This indicator is designed for daily charts but can be adjusted to work with other timeframes as well.
• Be cautious of relying solely on breakout signals; consider using additional technical and fundamental analysis for confirmation.
Start integrating the "Daily Pivots with Fakeout Protection" indicator into your trading strategy to enhance your ability to identify breakouts and pivot levels more effectively.

Dynamic Point of Control (POC)The Dynamic Point of Control (POC) indicator provides traders and analysts with insightful information about price levels, volume distribution, and sentiment within a specified historical range.
Instant Updates : POC recalculates with every new bar, keeping you ahead of the game.
Market Bias : Assess market sentiment through bullish volume share.
Customization : Tailor inputs to match your unique trading strategy.
Chart Presence : See POC and related data graphically on your price chart.
How to Use :
Traders can use the Dynamic POC indicator to identify Point of Control price level, understand volume distribution, and gauge market sentiment. The indicator's visual cues and customizable parameters make it a valuable tool for technical analysis and decision-making.

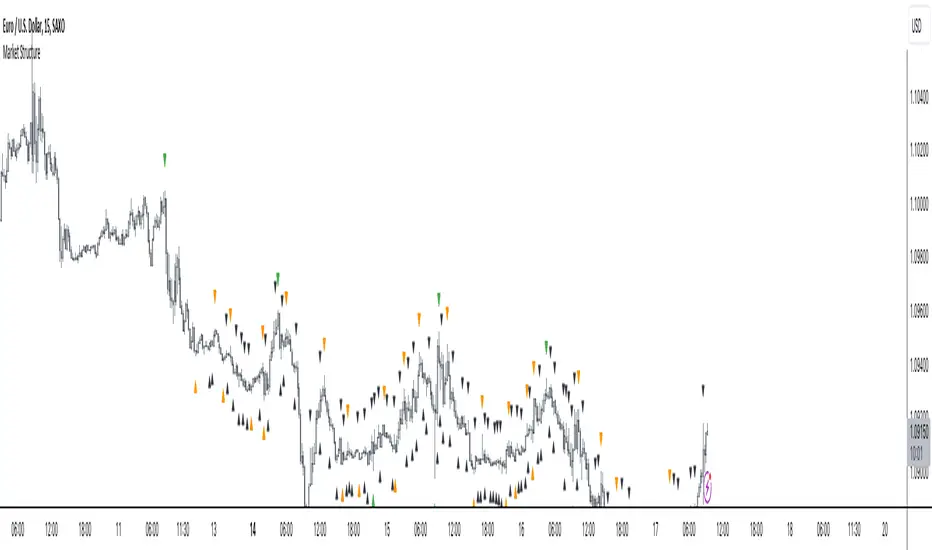
Market Structure
Intermediate Term Low (ITL): A point on a price chart where the price reaches a relatively lower level compared to the surrounding price points within an intermediate time frame.
Intermediate Term High (ITH): A point on a price chart where the price reaches a relatively higher level compared to the surrounding price points within an intermediate time frame.
Long Term Low (LTL): An Intermediate Term Low (ITL) that has higher Intermediate Term Lows (ITL) on both sides of it, indicating a potential significant reversal point and considered a long term trend change.
Long Term High (LTH): An Intermediate Term High (ITH) that has lower Intermediate Term Highs (ITH) on both sides of it, indicating a potential significant reversal point and considered a long term trend change
The script designed to automatically identify these patterns on a price chart. It categorizes ITH/L and LTH/L points for easy recognition of the market structure and potential pivot points. Traders and analysts often use such patterns and pivot points to make decisions about entering or exiting positions in the market.
Please note that while these concepts are based on certain patterns observed in historical price data, trading and investing in financial markets can be complex and risky. It's important to have a solid understanding of technical analysis, risk management, and market dynamics before making trading decisions.
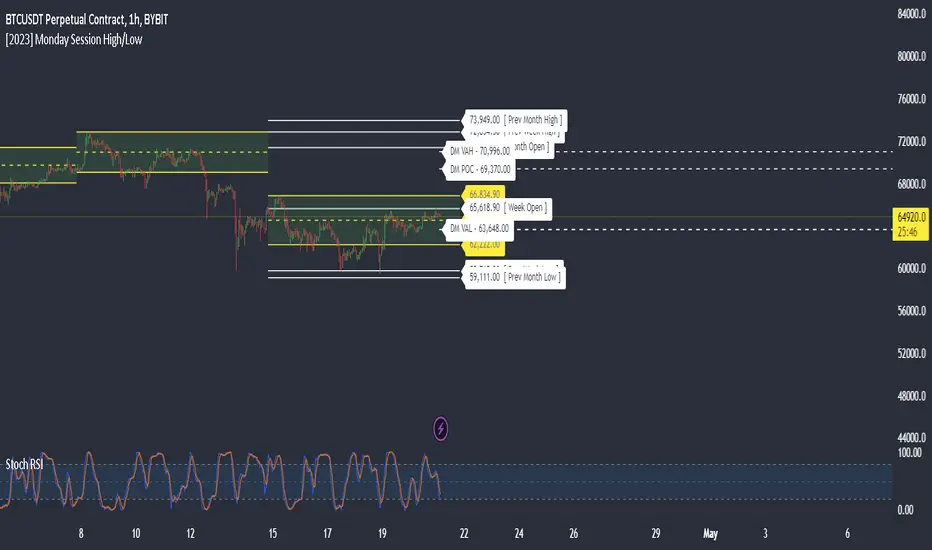
Monday Session High/LowThis script tracks and draw the High and the Low for Monday session across the whole week period.
Many crypto traders use the high and low extremes for Monday session as an confluence on how the price action during the week reacts against it.
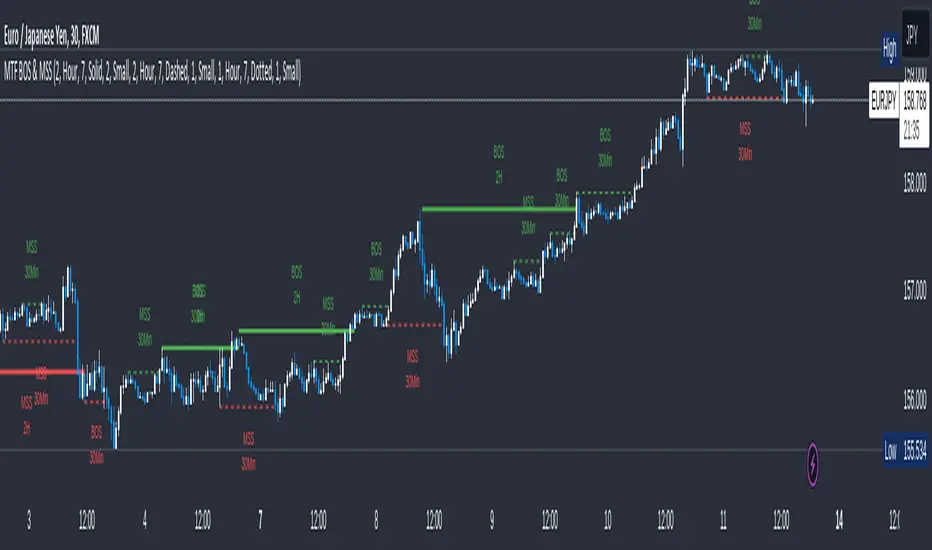
MTF Break of Structure(BOS) & Market Structure Shift(MSS)Brief Introduction
Hello fellow traders and coders, let me introduce to you the ultimate multi time-frame market structure indicator to cater to all your market structure needs. The script is extremely customizable with a maximum of 3 time-frames since I love top down analysis as I’m sure you do to, so without wasting any more time here are the available features.
List of Features
A maximum of 3 time-frames that can all be customized independently.
The ability to change individual swing lengths that create the market structure plots, all time-frames will come set at 7, you can however set this to whatever you are comfortable with.
BOS (Break of Structure) and MSS (Market Structure Shift) functionality fo all the individual time-frames.
The option to show market structure in the form of HH (Higher highs), HL (Higher Lows), LL (Lower Lows) and LH(Lower Highs).
The ability to either use (highs and lows) or closes for breaks of structure and market structure shifts, meaning a break of structure will only be valid if either a high or close (depending on your chosen input) crosses above the previous high for a bullish structural break.
The ability to change lines types for BOS and MSS.
The ability to change text sizes for the all the plots.
The ability to change the colors for nearly anything on the chart independently of any other line or plot.
The ability to change any time-frame to the chart’s time-frame.
The ability to prevent lower time frame structure from showing on higher time frames which I don’t advice as it will provide you with an inaccurate perception of the lower time frame structure hence I’ve made the feature available but set it to false.
The script also has a section called general settings that will allow you to hide all the market structure plots as well as all the lines on the chart and on all time-frames using just one input.
General Settings Functionality.
Input 1 if true will hide all market structure if true
Input 2 if true will hide all structural breaks (BOS and MSS)
Input 3 if false will show lower time frame structure on a higher time frame. High advice using it while its true as I work on this feature as it provide an innacurate depiction of structure.
Pivot Point SuperTrend Strategy +TrendFilterIn the dynamic world of financial markets, traders are always on the lookout for innovative strategies to identify trends and make timely trades. The "Pivot Point SuperTrend strategy +TrendFilter" has emerged as an intriguing approach, combining two popular indicators - Pivot Points and SuperTrend, while introducing an additional trend filter for added precision. This strategy draws inspiration from Lonesome TheBlue's "Pivot Point SuperTrend" script, aiming to provide traders with a reliable tool for trend following while minimizing false signals.
The Core Concept:
The strategy's foundation lies in the fusion of Pivot Points and SuperTrend indicators, and the addition of a robust trend filter. It begins by calculating Pivot Highs and Lows over a specified period, serving as crucial reference points for trend analysis. Through a weighted average calculation, these Pivot Points create a center line, refining the overall indicator.
Next, based on the center line and the Average True Range (ATR) with a user-defined Factor, upper and lower bands are generated. These bands adapt to market volatility, adding flexibility to the strategy. The heart of the "Pivot Point SuperTrend" strategy lies in accurately identifying the prevailing trend, with the indicator smoothly transitioning between bullish and bearish signals as the price interacts with the SuperTrend bands.
The additional trend filter introduced into the strategy further enhances its capabilities. This filter is based on a moving average, providing a dynamic assessment of the trend's strength and direction. By combining this trend filter with the original Pivot Point SuperTrend signals, the strategy aims to make more informed and reliable trading decisions.
Advantages of "Pivot Point SuperTrend" with Trend Filter:
1. Enhanced Precision: The incorporation of a trend filter improves the strategy's accuracy by confirming the overall trend direction before generating signals.
2. Trend Continuation: The integration of Pivot Points and SuperTrend, along with the trend filter, aims to prolong trades during strong market trends, potentially maximizing profit opportunities.
3. Reduced Whipsaws: The strategy's weighted average calculation, coupled with the trend filter, helps minimize false signals and reduces whipsaws during uncertain or sideways market conditions.
4. Support and Resistance Insights: The strategy continues to provide additional support and resistance levels based on the Pivot Points, offering valuable contextual information to traders.

Pivotal MomentsPivotal Moments draws lines for each of up to 500 pivot high and pivot low levels that have never been revisited at the present moment in time. After the Pivotal Moments indicator has been loaded onto chart and any of the subsequent realtime bars that are formed touch or cross a pivot level it is deleted. The duration for how long any touched or crossed pivot levels remain on chart before deletion may be extended by N bars or N units of time.
There are user selectable options for the following:
• Pivot Bars Left : the number of lower highs or higher lows that must be formed before a possible pivot bar can occur.
• Right : the number of lower highs or higher lows that must be formed after potential pivot to validate a pivot bar.
• Lines Show As : the choice of line style to use for the drawn pivot levels includes Dashed, Dotted, or Solid.
• Wide : the number of lines wide for how thick the drawn pivot levels are desired to be on the chart.
• Delay Removal : the number of units that touched or crossed pivot levels will persist on chart.
• Units : the choice of which delay unit type includes nBars, nSecs, nMins, nHrs, or nDays.
• Extend Right : the number of bars right of current bar to extend drawn pivot levels.
• Show : the number of maximum recent drawn pivot levels to keep on chart.
• Colors Used : the colors used for pivots high, low, and dual pivot bars.
• Show Price Labels : the choice whether to show prices for levels.
• On Right : the choice to move prices to right of pivot levels.
• Show Pivot Bars : the choice to colorize pivot bars.
If desired, alerts can be received for whenever new touches or crosses occur for both pivot highs and pivot lows by creating a single Alert. Note that these alerts are triggered by realtime bars which by their very nature are repainting prices, thus the alert creation window will warn of this with an orange exclamation symbol. For an illustration of how to create alerts for this indicator click the chart below:
Credit: this indicator was originally built for @Luckshury, who has graciously given me permission to publish it publicly.
NOTICE: This is an example script and not meant to be used as an actual strategy. By using this script or any portion thereof, you acknowledge that you have read and understood that this is for research purposes only and I am not responsible for any financial losses you may incur by using this script!

RSI HeatmapRSI Heatmap right on your chart. Cold and Hot areas means oversold and overbought cycles respectly.

Extreme Reversal SignalThe Extreme Reversal Signal is designed to signal potential pivot points when the price of an asset becomes extremely overbought or oversold. Extreme conditions typically signal a brief or extensive price reversal, offering valuable entry or exit points. It's important to note that this indicator may produce multiple signals, making it essential to corroborate these signals with other forms of analysis to determine their validity. While the default settings provide valuable insights, it might be beneficial to experiment with different configurations to ensure the indicator's efficacy.
Two primary conditions define extremely overbought and oversold states. The first condition is that the price must deviate by two standard deviations from the 20-day Simple Moving Average (SMA). The second condition is that the 3-day SMA of the 14-day Stochastic Oscillator (STO) derived from the 14-day Relative Strength Index (RSI) is above or below the upper or lower limit.
Oversold states arise when the first condition is met and the 3-day SMA of the 14-day Stochastic RSI falls below the lower limit, suggesting a buy signal. These are visually represented by green triangles below the price bars. Overbought states arise when the first condition is met and the 3-day SMA of the 14-day Stochastic RSI rises above the upper limit, suggesting a sell signal. These are visually represented by red triangles above the price bars. It's also possible to set up automated alerts to get notifications when either of these two conditions is met to avoid missing out.
While this indicator has traditionally identified overbought and oversold conditions in various different assets, past performance does not guarantee future results. Therefore, it is advisable to supplement this indicator with other technical tools. For instance, trend indicators can greatly improve the decision-making process when planning for entries and exit points.

Price breakout and reversal [TCS] | PAThis indicator is designed to identify potential breaks and reversals in price movements for a financial instrument.
The indicator displays several elements to assist users in spotting specific market conditions:
1. High and Low Pivots : The indicator marks the highest and lowest points on the price chart within a customizable lookback period. These pivots represent important turning points in the price movement and serve as reference levels for potential breakouts and reversals.
2. Fair Value Line : A horizontal line is drawn at the midpoint between the high and low pivots. This line represents the "fair value" based on the recent price action. Traders may consider this level as a reference for evaluating the price's deviation from its average value.
3. Bullish Breakouts : When the closing price of the financial instrument crosses above the high pivot the indicator identifies a potential bullish breakout. This suggests a possible buying opportunity.
4. Bearish Breakouts : Conversely, a bearish breakout is identified when the closing price crosses below the low pivot. This may indicate a selling opportunity.
5. Fair Value Breakouts : In addition to regular breakouts, the indicator can detect breakouts based on the fair value line. If the closing price crosses above or below the fair value line, it may signal a fair value breakout, indicating the price's potential return to its average level.
6. Reversals : Reversal patterns are essential in technical analysis. The indicator identifies potential bullish and bearish reversals .
The indicator enhances its visual signals with geometric shapes (triangles and diamonds) placed above or below the price bars to represent different types of breakouts and reversals.
Moreover, the indicator can be configured to send alerts to the user when any of these specific events occur, helping traders stay informed and respond promptly to potential trading opportunities.
Please note that this code is for educational purposes only and should not be used for trading without further testing and analysis.

Gradient Money Flow Divergence DetectorThe "Gradient Money Flow Divergence Detector" indicator has several use cases for traders. Let's explore the main use cases:
1. Money Flow Analysis : The primary purpose of this indicator is to analyze money flow in a particular asset. The Money Flow Index (MFI) is a momentum indicator that uses price and volume data to assess the buying and selling pressure in a market. Traders can use the MFI to identify overbought and oversold conditions, potential trend reversals, and divergences between the MFI and price movement.
2. Divergence Detection : The indicator incorporates a divergence detection mechanism for multiple timeframes (micro, sub-mid, mid, and macro). Divergence occurs when the price movement and an indicator (MFI in this case) move in opposite directions, signaling a potential shift in the price trend. Traders can use divergences to anticipate trend reversals or trend continuation.
3. Multiple Lookback Analysis : The indicator allows traders to assess divergences and money flow trends across various time horizons by providing divergence detection for different lengths. This can help traders identify confluence areas where divergences align on multiple timeframes, strengthening the potential signal.
4. Overbought and Oversold Conditions : The indicator plots horizontal lines at MFI levels of 20, 50, and 80. These levels can be used to identify overbought (MFI above 80) and oversold (MFI below 20) conditions. Traders may look for potential reversal signals when the MFI reaches extreme levels.
5. Confirmation of Price Trends : The indicator's color gradient visually represents the MFI value, which can help traders confirm the strength of a prevailing price trend. For example, an uptrend with a consistently high MFI might suggest strong buying pressure, reinforcing the bullish bias.
6. Fine-Tuning Divergence Signals : Traders can adjust the parameters of divergence detection (e.g., pivot points, rangeUpper, rangeLower) to fine-tune the sensitivity of the divergence signals. This allows for greater customization based on individual trading preferences.
7. Combining with Other Indicators : The indicator can be used in combination with other technical indicators or price action analysis to strengthen trading decisions. For example, traders may look for divergences in conjunction with support and resistance levels or chart patterns to increase the probability of successful trades.
8. Trend Reversal Confirmation : When a divergence is detected, it may indicate a potential trend reversal. Traders can use other confirmation signals (e.g., candlestick patterns, trendline breaks) to validate the reversal before making trading decisions.
Remember that no single indicator should be used in isolation, and it's essential to use the indicator in combination with other confirmations such as support and resistance, and analysis methods for more robust trading strategies. Additionally, thorough backtesting and practice in a demo environment are recommended before using the indicator in live trading.

Quantitative Trend Strategy- Uptrend longTrend Strategy #1
Indicators:
1. SMA
2. Pivot high/low functions derived from SMA
3. Step lines to plot support and resistance based on the pivot points
4. If the close is over the resistance line, green arrows plot above, and vice versa for red arrows below support.
Strategy:
1. Long Only
2. Mutable 2% TP/1.5% SL
3. 0.01% commission
4. When the close is greater than the pivot point of the sma pivot high, and the close is greater than the resistance step line, a long position is opened.
*At times, the 2% take profit may not trigger IF; the conditions for reentry are met at the time of candle closure + no exit conditions have been triggered.
5. If the position is in the green and the support step line crosses over the resistance step line, positions are exited.
How to use it and what makes it unique:
Use this strategy to trade an up-trending market using a simple moving average to determine the trend. This strategy is meant to capture a good risk/reward in a bullish market while staying active in an appropriate fashion. This strategy is unique due to it's inclusion of the step line function with statistics derived from myself.
This description tells the indicators combined to create a new strategy, with commissions and take profit/stop loss conditions included, and the process of strategy execution with a description on how to use it. If you have any questions feel free to PM me and boost if you enjoyed it. Thank you, pineUSERS!

SuperTrend Enhanced Pivot Reversal - Strategy [PresentTrading]
- Introduction and How it is Different
The SuperTrend Enhanced Pivot Reversal is a unique approach to trading that combines the best of two worlds: the precision of pivot reversal points and the trend-following power of the SuperTrend indicator. This strategy is designed to provide traders with clear entry and exit points, while also filtering out potentially false signals using the SuperTrend indicator.
BTCUSDT 6hr
ETHBTC 6hr
Unlike traditional pivot reversal strategies, this approach uses the SuperTrend indicator as a filter. This means that it only takes trades that align with the overall trend, as determined by the SuperTrend indicator. This can help to reduce the number of false signals and improve the overall profitability of the strategy.
The Pivot Reversal Strategy with SuperTrend Filter is particularly well-suited to the cryptocurrency market for the reason of High Volatility. This means that prices can change rapidly in a very short time, making it possible to make a profit quickly. The strategy's use of pivot points allows traders to take advantage of these rapid price changes by identifying potential reversal points
- Strategy: How it Works
The strategy works by identifying pivot reversal points, which are points in the price chart where the price is likely to reverse. These points are identified using a combination of the ta.pivothigh and ta.pivotlow functions, which find the highest and lowest points in the price chart over a certain period.
Once a pivot reversal point is identified, the strategy checks the direction of the SuperTrend indicator. If the SuperTrend is positive (indicating an uptrend), the strategy will only take long trades. If the SuperTrend is negative (indicating a downtrend), the strategy will only take short trades.
The strategy also includes a stop loss level, which is set as a percentage of the entry price. This helps to limit potential losses if the price moves in the opposite direction to the trade.
- Trade Direction
The trade direction can be set to "Long", "Short", or "Both". This allows the trader to choose whether they want to take only long trades (buying low and selling high), only short trades (selling high and buying low), or both. This can be useful depending on the trader's view of the market and their risk tolerance.
- Usage
To use the Pivot Reversal Strategy with SuperTrend Filter, simply input the desired parameters into the script and apply it to the price chart of the asset you wish to trade. The strategy will then identify potential trade entry and exit points, which will be displayed on the price chart.
- Default Settings
The default settings for the strategy are as follows:
ATR Length: 5
Factor: 2.618
Trade Direction: Both
Stop Loss Level: 20%
Commission: 0.1%
Slippage: 1
Currency: USD
Each trade: 10% of account equity
Initial capital: $10,000
These settings can be adjusted to suit the trader's preferences and risk tolerance. Always remember to test any changes to the settings using historical data before applying them to live trades.

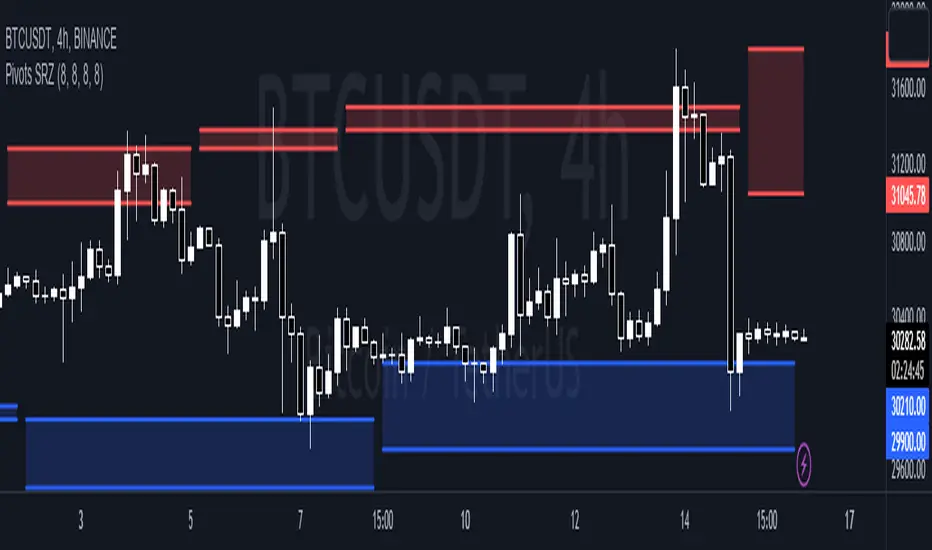
Pivots Support Resistance ZoneThis simple script base on function of Pivot High Low to plot Support and Resistance Zone on chart with detail as below:
1. Support Zone
+ New Pivot Low is plotted
+ New Pivot Low lower previous Pivot Low
+ Upper Line of Support Zone is previous Pivot Low
+ Lower Line of Support Zone is new Pivot Low
2. Resistance Zone
+ New Pivot High is plotted
+ New Pivot High higher previous Pivot High
+ Upper Line of Resistance Zone is new Pivot High
+ Lower Line of Resistance Zone is previous Pivot High
Market Smith IndicatorsMarket Smith has a collection of tools that are useful for identifying stocks. On their charts they have a 21/50/200 day moving averages, high and low pivot points, a relative strength line, and a relative strength rating. This script contains indicators for the following:
21/50/200 Day Moving Averages
High and Low pivot points
A Relative Strength line
A Relative Strength rating
21/50/200 Day Moving Averages
The 21/50/200 Day moving averages are simple moving averages. They are visible in any chart increment but to use them properly you need to set you charts to be by day. Labels will appear on the right of the lines to show that they are representative of 21/50/200 day moving averages.
High and Low pivot points
The High and Low pivot points are green for high pivot points and red for low points. They are show in the Market Smith style with the numbers simply above the pivot points.
Relative Strength line
The Relative Strength line is a line that shows the strength of the stock compared to the S&P 500. In this case we utilize the SPX ticker to compare the stock to. This line is almost identical to the Market Smith tool and is an excellent tool to determine how a stock is doing compared to the market. When movements in the stock and shown with sideways trending of the RS line that means that the stock is following the market. When a stock is outperforming the market the RS line will follow.
Relative Strength rating
Thank you to ©Fred6724 for the RS Rating inspiration. They wrote excellent open source code for a RS Rating comparable to Market Smith. As the RS Rating in Market Smith is not open source it is difficult to know exactly how it is being calculated. After simplifying Fred's code and building upon a few ideas I had I compared the RS Rating to multiple Market Smith Ratings. The rating is close but often off by multiple points. If there is anyone who has a better idea on how to get this rating or how to improve on the code please send me a PM or fork this project. This rating is a good indicator to see how a certain stock compares to other stocks in the market. In Market Smith they are able to utilize their database to compare it to all other stocks. Since we do not have access to the same tools we are only able to compare it to the percentage of stocks above the 200, 150, 100, 50, and 20 day moving average.
Using these tools together are a small fraction what make people like Bill O'neill and Jim Roppel so successful. I plan on updating the RS Rating as I continue to work on this project so if there is anyone who has ideas then please send me a PM. Ultimately the goal of this project is to have a solution that is identical to Market Smith.
