Position Sizer (Share Qty)
This indicator enables fast & accurate position sizing for traders using (user defined) fixed dollar risk, eliminating the need for manual calculations and supporting disciplined risk management directly on the chart
Calculates precise share quantity for fixed-risk trades using the formula Shares = Risk Amount / (Current Price – Stop Price), rounded to the nearest whole share, updating in real time on every bar
Offers two dynamic stop-loss options: Low of Day (LoD) — tracked only during Regular Trading Hours (9:30 AM – 4:00 PM ET) with automatic daily reset — or Low of Week (LoW) via weekly timeframe data
Displays all critical trade data in a clean, customizable on-screen table showing: Risk Amount, Stop Loss type (LoD/LoW), Stop Price, and calculated Shares Qty
Allows full table placement control with four corner positions with optional Top Offset and Bottom Offset (0–20 blank rows each) to prevent overlap with price action or other indicators
Provides complete visual styling control for header text/background, value text/background, and share quantity text/background
Ensures efficient rendering by recreating the table only when position, row count, or layout changes, deleting the prior instance to avoid flicker or memory issues
Handles edge cases safely: shows 0 shares if stop is 'na' or above current price, and initializes LoD only on the first RTH bar of each session
For use on equities only (table will not display on futures instruments)
--
Future improvements:
Visual Stop Loss line for either LoD or LoW
Functionality and toggle to include Extended hours (PM /AH) for LoD stop pricing
個人檔案管理

SatoshiFrame Lot Size CalculatorSatoshiFrame Lot Size Calculator that help you to manage your lot size in forex and crypto trade

AG Pro Crypto Screener & Signal Dashboard🚀 OVERVIEW
Welcome to the AG Pro Crypto Screener & Signal Dashboard, an institutional-grade scanner designed to find high-probability buy opportunities in the chaotic crypto market. This powerful tool is being offered completely free as an introduction to the precision and performance of the exclusive AG Pro series.
Tired of manually flipping through dozens of charts? This dashboard is your new command center. It simultaneously scans up to 40 crypto assets against a robust, multi-filter strategy. It filters out the noise and delivers a clean, actionable list of symbols that are showing combined signs of strength, momentum, and a confirmed uptrend.
🧠 THE CORE STRATEGY: A Multi-Filter Confluence
This screener doesn't rely on a single, weak indicator. A symbol only appears on the "Buy List" if it passes a strict, user-configurable set of confluence filters:
Bullish EMA Crossover: Confirms a new, bullish shift in short-term momentum by looking for a recent crossover of a Fast EMA over a Slow EMA (e.g., 20/50). The "Freshness" feature ensures the signal is recent.
RSI Momentum Filter: Ensures the asset has strong buying momentum. The signal is only valid if the RSI is above a specified level (e.g., > 50).
Long-Term Trend Filter: This is the most critical filter. It keeps you on the right side of the market by confirming the price is above a key long-term Moving Average (e.g., SMA 50, 100, 200). You trade with the trend, not against it.
MACD Crossover (Optional): For traders who want an extra layer of confirmation, you can enable a filter to check for a bullish MACD crossover.
Only when all selected conditions are met does the asset appear on your dashboard. This multi-layered approach is designed to find quality over quantity.
✨ KEY FEATURES
Dynamic 40-Symbol Scanner: Monitor your entire watchlist (up to 40 symbols) from a single chart.
Professional Signal Dashboard: A clean, sortable table displaying all active signals, last price, RSI value, and volume.
"Freshness" & "Trend" Icons: Instantly gauge signal quality.
Freshness: See how many bars ago the signal appeared (🔥 Hot / ❇️ Fresh / ⏳ Old).
Trend: A clear visual icon shows if the asset is in a long-term uptrend (🔼) or downtrend (🔽).
NEW Signal Alerts: Don't miss an opportunity. Set an alert to be notified only when a new symbol appears on the list. This non-intrusive system avoids constant, repetitive alerts.
Fully Customizable Strategy: You are in control.
Toggle any of the four main filters (EMA, RSI, Trend, MACD) on or off.
Adjust all indicator lengths (EMAs, RSI, MACD, and Trend MA) to fit your trading style.
Reliable "On-Close" Signaling: Includes an option to generate signals only on bar close, ensuring high-quality, non-repainting signals.
Clean UI: Adjustable table text size ("Tiny", "Small", "Normal", "Large") for perfect visibility on any setup.
💎 THE AG PRO DIFFERENCE
This free screener is just the beginning. It's a demonstration of the stable, high-performance, and results-driven philosophy that defines the AG Pro brand.
We believe in empowering traders with tools that provide a clear, statistical edge. While this screener is powerful, our private, premium AG Pro scripts (such as the AG Pro Trading Suite) offer a complete, institutional-grade solution for serious traders. These advanced tools feature predictive models, proprietary signal algorithms, and comprehensive risk management modules that are the result of years of professional development.
If you find value in this free tool, imagine what our full suite can do for your trading. We invite you to experience the next level of trading precision.
🛠️ HOW TO USE
Add the "🏆 AG Pro Crypto Screener & Signal Dashboard V3" to your chart.
Open the indicator's Settings.
Under the "Symbol List to Scan" tab, replace the default symbols with your own 40 preferred assets (e.g., "BINANCE:BTCUSDT", "BINANCE:ETHUSDT", "COINBASE:SOLUSD").
Under the "Filter Settings" tab, configure your desired strategy. You can start with the defaults or customize them.
(Recommended) Right-click the table and select "Create Alert". Choose the "NEW BUY" condition and "Once Per Bar Close" to be notified of new signals.
⚠️ DISCLAIMER
This script is provided for informational and educational purposes only. It does not constitute financial or investment advice. All trading involves significant risk, and past performance is not indicative of future results. Please conduct your own research and implement your own risk management strategy before making any trading decisions.

Risk & Position DashboardRisk & Position Dashboard
Overview
The Risk & Position Dashboard is a comprehensive trading tool designed to help traders calculate optimal position sizes, manage risk, and visualize potential profit/loss scenarios before entering trades. This indicator provides real-time calculations for position sizing based on account size, risk percentage, and stop-loss levels, while displaying multiple take-profit targets with customizable risk-reward ratios.
Key Features
Position Sizing & Risk Management:
Automatic position size calculation based on account size and risk percentage
Support for leveraged trading with maximum leverage limits
Fractional shares support for brokers that allow partial share trading
Real-time fee calculation including entry, stop-loss, and take-profit fees
Break-even price calculation including trading fees
Multi-Target Profit Management:
Support for up to 3 take-profit levels with individual portion allocations
Customizable risk-reward ratios for each take-profit target
Visual profit/loss zones displayed as colored boxes on the chart
Individual profit calculations for each take-profit level
Visual Dashboard:
Clean, customizable table display showing all key metrics
Configurable label positioning and styling options
Real-time tracking of whether stop-loss or take-profit levels have been reached
Color-coded visual zones for easy identification of risk and reward areas
Advanced Configuration:
Comprehensive input validation and error handling
Support for different chart timeframes and symbols
Customizable colors, fonts, and display options
Hide/show individual data fields for personalized dashboard views
How to Use
Set Account Parameters: Configure your account size, maximum risk percentage per trade, and trading fees in the "Account Settings" section.
Define Trade Setup: Use the "Entry" time picker to select your entry point on the chart, then input your entry price and stop-loss level.
Configure Take Profits: Set your desired risk-reward ratios and portion allocations for each take-profit level. The script supports 1-3 take-profit targets.
Analyze Results: The dashboard will automatically calculate and display position size, number of shares, potential profits/losses, fees, and break-even levels.
Visual Confirmation: Colored boxes on the chart show profit zones (green) and loss zones (red), with lines extending to current price levels.
Reset Entry and SL:
You can easily reset the entry and stop-loss by clicking the "Reset points..." button from the script's "More" menu.
This is useful if you want to quickly clear your current trade setup and start fresh without manually adjusting the points on the chart.
Calculations
The script performs sophisticated calculations including:
Position size based on risk amount and price difference between entry and stop-loss
Leverage requirements and position amount calculations
Fee-adjusted risk-reward ratios for realistic profit expectations
Break-even price including all trading costs
Individual profit calculations for partial position closures
Detailed Take-Profit Calculation Formula:
The take-profit prices are calculated using the following mathematical formula:
// Core variables:
// risk_amount = account_size * (risk_percentage / 100)
// total_risk_per_share = |entry_price - sl_price| + (entry_price * fee%) + (sl_price * fee%)
// shares = risk_amount / total_risk_per_share
// direction_factor = 1 for long positions, -1 for short positions
// Take-profit calculation:
net_win = total_risk_per_share * shares * RR_ratio
tp_price = (net_win + (direction_factor * entry_price * shares) + (entry_price * fee% * shares)) / (direction_factor * shares - fee% * shares)
Step-by-step example for a long position (based on screenshot):
Account Size: 2,000 USDT, Risk: 2% = 40 USDT
Entry: 102,062.9 USDT, Stop Loss: 102,178.4 USDT, Fee: 0.06%
Risk per share: |102,062.9 - 102,178.4| + (102,062.9 × 0.0006) + (102,178.4 × 0.0006) = 115.5 + 61.24 + 61.31 = 238.05 USDT
Shares: 40 ÷ 238.05 = 0.168 shares (rounded to 0.17 in display)
Position Size: 0.17 × 102,062.9 = 17,350.69 USDT
Position Amount (with 9x leverage): 17,350.69 ÷ 9 = 1,927.85 USDT
For 2:1 RR: Net win = 238.05 × 0.17 × 2 = 80.94 USDT
TP1 price = (80.94 + (1 × 102,062.9 × 0.17) + (102,062.9 × 0.0006 × 0.17)) ÷ (1 × 0.17 - 0.0006 × 0.17) = 101,464.7 USDT
For 3:1 RR: TP2 price = 101,226.7 USDT (following same formula with RR=3)
This ensures that after accounting for all fees, the actual risk-reward ratio matches the specified target ratio.
Risk Management Features
Maximum Trade Amount: Optional setting to limit position size regardless of account size
Leverage Limits: Built-in maximum leverage protection
Fee Integration: All calculations include realistic trading fees for accurate expectations
Validation: Automatic checking that take-profit portions sum to 100%
Historical Tracking: Visual indication when stop-loss or take-profit levels are reached (within last 5000 bars)
Understanding Max Trade Amount - Multiple Simultaneous Trades:
The "Max Trade Amount" feature is designed for traders who want to open multiple positions simultaneously while maintaining proper risk management. Here's how it works:
Key Concept:
- Risk percentage (2%) always applies to your full Account Size
- Max Trade Amount limits the capital allocated per individual trade
- This allows multiple trades with full risk on each trade
Example from Screenshot:
Account Size: 2,000 USDT
Max Trade Amount: 500 USDT
Risk per Trade: 2% × 2,000 = 40 USDT per trade
Stop Loss Distance: 0.11% from entry
Result: Position Size = 17,350.69 USDT with 35x leverage
Total Risk (including fees): 40.46 USDT
Multiple Trades Strategy:
With this setup, you can open:
Trade 1: 40 USDT risk, 495.73 USDT position amount (35x leverage)
Trade 2: 40 USDT risk, 495.73 USDT position amount (35x leverage)
Trade 3: 40 USDT risk, 495.73 USDT position amount (35x leverage)
Trade 4: 40 USDT risk, 495.73 USDT position amount (35x leverage)
Total Portfolio Exposure:
- 4 simultaneous trades = 4 × 495.73 = 1,982.92 USDT position amount
- Total risk exposure = 4 × 40 = 160 USDT (8% of account)


Simulated Fear & Greed (CNN-calibrated v2)🧭 Fear & Greed Index — TradingView Version (Simulated CNN Model)
🔍 Purpose
The Fear & Greed Index is a sentiment indicator that quantifies market emotion on a scale from 0 to 100, where:
0 represents Extreme Fear (capitulation, oversold conditions), and
100 represents Extreme Greed (euphoria, overbought conditions).
It helps traders assess whether the market is driven by fear (risk aversion) or greed (risk appetite) — giving a high-level view of potential turning points in market sentiment.
⚙️ How It Works in TradingView
Because TradingView cannot directly access CNN’s or alternative external sentiment feeds, this indicator simulates the Fear & Greed Index by analyzing in-chart technical data that reflect investor psychology.
It uses a multi-factor model, converting price and volume signals into a composite sentiment score.
🧩 Components Used (Simulated Metrics)
Category Metric Emotional Interpretation
Volatility ATR (Average True Range) High ATR = Fear, Low ATR = Greed
Momentum RSI + MACD Histogram Rising momentum = Greed, Falling = Fear
Volume Activity Volume Z-Score High positive deviation = Greed, Low = Fear
Trend Context SMA Regime Bias (50/200) Downtrend adds Fear penalty, Uptrend supports Greed
These elements are normalized into a 0–100 scale using percentile ranks (like statistical scoring) and then combined using user-adjustable weights.
⚖️ CNN-Style Calibration
The script follows CNN’s five sentiment bands for clarity:
Range Zone Colour Description
0–25 Extreme Fear 🔴 Red Panic, forced selling, capitulation risk
25–45 Fear 🟠 Orange Uncertainty, hesitation, early accumulation phase
45–55 Neutral ⚪ Gray Balanced sentiment, indecision
55–75 Greed 🟢 Light Green Optimism, trend continuation
75–100 Extreme Greed 💚 Bright Green Euphoria, risk of reversal
This structure aligns visually with CNN’s public gauge, making it easy to interpret.

Dual Harmonic-based AHR DCA (Default :BTC-ETH)A panel indicator designed for dual-asset BTC/ETH DCA (Dollar Cost Averaging) decisions.
It is inspired by the Chinese community indicator "AHR999" proposed by “Jiushen”.
How to use:
Lower HM-based AHR → cheaper (potential buy zone).
Higher HM-based AHR → more expensive (potential risk zone).
Higher than Risk Threshold → consider to sell, but not suitable for DCA.
When both AHR lines are below the Risk threshold → buy the cheaper one (or split if similar).
If one AHR is above Risk → buy the other asset.
If both are above Risk → simulation shows “STOP (both risk)”.
Not limited to BTC/ETH — you can freely change symbols in the input panel
to build any dual-asset DCA pair you want (e.g., BTC/BNB, ETH/SOL, etc.).
What you’ll see:
Two lines: AHR BTC (HM) and AHR ETH (HM)
Two dashed lines: OppThreshold (green) and RiskThreshold (red)
Colored fill showing which asset is cheaper (BTC or ETH)
Buy markers:
- B = Buy BTC
- E = Buy ETH
- D = Dual (split budget)
Top-right table: prices, AHRs, thresholds, qOpp/qRisk%, simulation, P&L
Labels showing last-bar AHR values
Core idea:
Use an AHR based on Harmonic Moving Average (HM) — a ratio that measures how “cheap or expensive” price is relative to both its short-term mean and long-term trend.
The original AHR999 used SMA and was designed for BTC only.
This indicator extends it with cross-exchange percentile mapping, allowing the empirical “opportunity/risk” zones of the AHR999 (on Bitstamp) to adapt automatically to the current market pair.
The indicator derives two adaptive thresholds:
OppThreshold – opportunity zone
RiskThreshold – risk zone
These thresholds are compared with the current HM-based AHR of BTC and ETH to decide which asset is cheaper, and whether it is good to DCA or not, or considering to sell(When it in risk area).
This version uses
Display base: Binance (default: perpetual) with HM-based AHR
Percentile base: Bitstamp spot SMA-AHR (complete, stable history)
Rolling window: 2920 daily bars (~8 years) for percentile tracking
Concept summary
AHR measures the ratio of price to its long-term regression and short-term mean.
HM replaces SMA to better reflect equal-fiat-cost DCA behavior.
Cross-exchange percentile mapping (Bitstamp → Binance) keeps thresholds consistent with the original AHR999 interpretation.
Recommended settings (1D):
DCA length (harmonic): 200
Log-regression lookback: 1825 (≈5 years)
Rolling window: 2920 (≈8 years)
Reference thresholds: 0.45 / 1.20 (AHR999 empirical priors)
Tie split tolerance (ΔAHR): 0.05
Daily budget: 15 USDT (simulation)
All display options can be toggled: table, markers, labels, etc.
Notes:
When the rolling window is filled (2920 bars by default), thresholds are first calculated and then visually backfilled as left-extended lines.
The “buy markers” and “decision table” are light simulations without fees or funding costs — for rhythm and relative analysis, not backtesting.

Earnings CountdownAdd to a chart to show a text box with how long to next earnings.
Being updated to add functionality from original open source Pine script

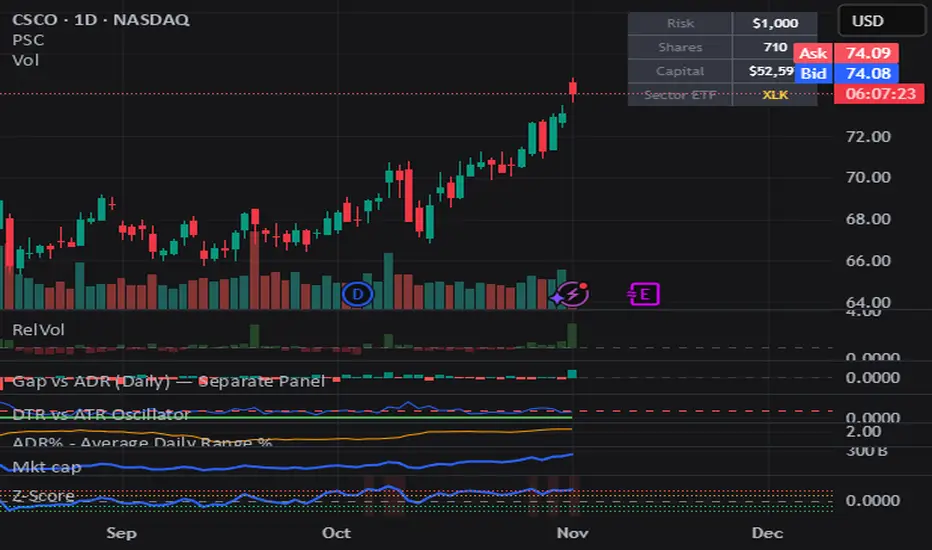
Position Size CalculatorPosition Size Calculator (PSC) helps size trades by dollar risk.
Set your Risk Amount ($).
Choose risk unit: ADR (avg high–low) or ATR (Wilder’s, gap-aware).
Shares = round(Risk $ / risk_unit).
Capital = Shares × current close.
Small table shows Risk $, Shares, Capital, and a mapped sector ETF (e.g., XLK, XLE).
Use ATR for gap-aware sizing; ADR for a simpler range. Adjust period to fit your stop style (shorter = more responsive). PSC is display-only (no orders), works on any symbol/timeframe, and updates on the latest bar.
Trailing 12M % Gain/Lossthis script shows profit or loss for training 12 months, works only on daily time frame


Integrated Volatility Intelligence System (IVIS) AutoKVolMind™ AutoK — Integrated Volatility Intelligence System (IVIS)
IVIS AutoK
Author: © lfu
Public Description (for publication)
VolMind™ AutoK represents an institutional-grade open-source framework for adaptive volatility intelligence and probabilistic trade management.
This system fuses Kalman-inspired KAMA smoothing, CVD dynamics, Auto K-Means clustering, entropy-based regime analysis, and a Kolmogorov–Smirnov market normality test into a single modular platform.
Key Capabilities:
Adaptive ATR Stop Bands dynamically scale with volatility, entropy, and cluster variance.
Auto KMeans Intelligence automatically selects the optimal cluster count for price structure recognition (3–10 clusters).
Entropy Module quantifies structural uncertainty and information decay within price movement.
KS-Test Integration identifies non-normal distributions, signaling regime divergence and volatility inflection.
CVD Dynamics reveal real-time directional bias via cumulative volume delta.
MSI Composite Signal fuses multi-source indicators (ATR, CVD, entropy, clusters) to model market stress and adaptive risk.
Designed for forward-looking quant traders, IVIS serves as a volatility intelligence backbone for portfolio automation, volatility forecasting, and adaptive stop-loss scaling.
Fully open-source for research and applied strategy development. Not a financial advice. DYOR.

Trade Journal ProTrade Journal Pro
A powerful, visual trading journal that enforces discipline with real-time feedback, reflective prompts, and strict risk limits — all in one clean overlay box.
Jesus is King — trade with wisdom, not emotion.
FEATURES
• AUTO-CALCULATED DAILY TRADES
→ `Trades Today = Wins + Losses + Breakevens` (no manual input needed)
• 4 ENFORCED RISK LIMITS
1. Max Trades Per Day
2. Max Risk Rule Violations
3. Max Consecutive Losses (tilt protection)
4. Max Total Losses Allowed (lifetime/session cap)
• SMART VISUAL FEEDBACK
• GREEN BOX = You hit a limit exactly → “WELL DONE!”
• RED BOX = Breached any limit → “STOP & REFLECT” + ALERT
• Dark = Normal (under all limits)
• REFLECTIVE PROMPTS (Customizable)
1. Why this setup?
2. What was my emotional state?
3. Did I follow my plan?
• LIVE ADVICE ENGINE
→ Win: “Great execution! Log what worked.”
→ Loss: “Loss = tuition. What did you learn?”
→ Breakeven: “Review entry/exit precision.”
• DAILY REMINDER
→ Always visible: “Trade the plan, not the emotion.”
• FULLY CUSTOMIZABLE
• Font size (Tiny → Huge)
• Box position (bars to the right)
• Toggle: Metrics / Prompts / Advice
• Custom colors, messages, limits
• ALERTS
• Breach any limit → Immediate alert
• Hit limit exactly → Discipline win notification
HOW TO USE
1. After each closed trade:
→ Update Wins, Losses, or Breakevens
→ Update Consecutive Losses (reset to 0 on win/BE)
→ Increment Risk Violations if you broke a rule
2. Answer the 3 prompts in your journal
3. Let the box guide your behavior:
• GREEN = Celebrate discipline
• RED = STOP TRADING. Reflect. Reset.
Perfect for day traders, swing traders, or anyone building a professional edge through journaling and risk control.
No strategy entries. No repainting. Pure accountability.
“The market is a mirror. This journal is the polish.”
Developed with integrity. Built to protect your capital — and your peace.

Stablecoin Liquidity Delta (Aggregate Market Cap Flow)Hi All,
This indicator visualizes the bar-to-bar change in the aggregate market capitalization of major stablecoins, including USDT, USDC, DAI, and others. It serves as a proxy for monitoring on-chain liquidity and measuring capital inflows or outflows across the crypto market.
Stablecoins are the primary liquidity layer of the crypto economy. Their combined market capitalization acts as a mirror of the available fiat-denominated liquidity in digital markets:
🟩 An increase in the total stablecoin market capitalization indicates new issuance (capital entering the market).
🟥 A decrease reflects redemption or burning (liquidity exiting the system).
Tracking these flows helps anticipate macro-level liquidity trends that often lead overall market direction, providing context for broader price movements.
All values are derived from TradingView’s public CRYPTOCAP tickers, which represent the market capitalization of each stablecoin. While minor deviations can occur due to small price fluctuations around the $1 peg, these figures serve as a proxy for circulating supply and net issuance across the stablecoin ecosystem.

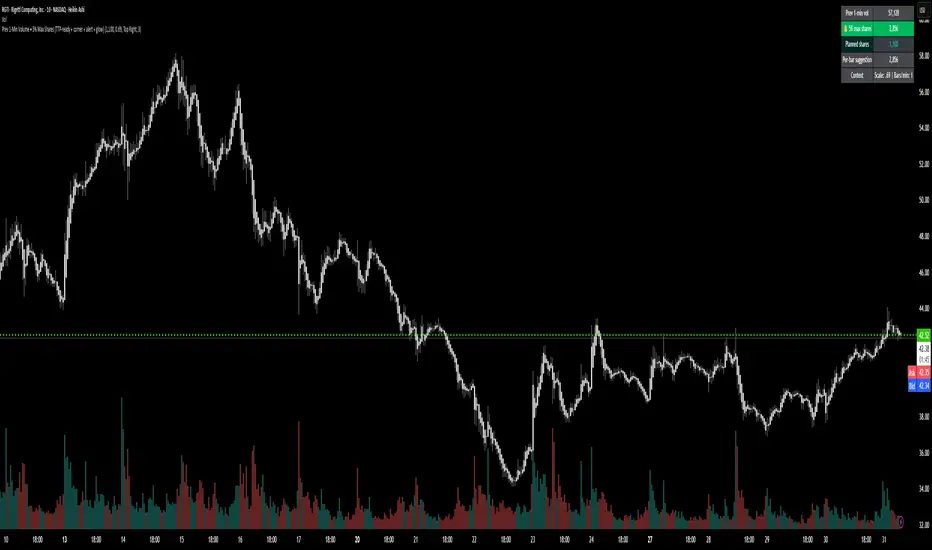
Prev 1-Min Volume • 5% Max Shares (TTP-ready)💡 Overview
This tool was built to help Trade The Pool (TTP) traders comply with the new “5% per minute volume” rule — without needing to calculate anything manually.
It automatically tracks the previous 1-minute volume, calculates 5% of it, and compares that to your planned order size.
If your planned size is within the limit, it shows green ✅.
If you’re above, it flashes red 🚫.
And when liquidity spikes allow for more size, you’ll see a green glow and 🔔 alert — so you can size up confidently without breaking the rule.
⚙️ Features
✅ Auto-calculates 5% volume cap from the previous 1-min candle
✅ Displays previous volume, max allowed shares, and your planned size
✅ TTP “different volume” scaling option (e.g. 0.69 for 45M vs 65M real volume)
✅ Per-bar slice suggestion for 10s scalpers
✅ Corner selector (top-left, top-right, bottom-left, bottom-right)
✅ Visual glow and 🔔 alert when liquidity window opens
✅ Compact and real-time responsive on 10s charts
Pullback Levels from ATH# ATH Pullback Levels
**Assess correction depth with precision – 5%, 10%, 15%, 20% below All-Time High**
---
### Overview
This indicator draws **horizontal support lines** at **5%, 10%, 15%, and 20%** below the **All-Time High (ATH)** of any asset. Perfect for **swing traders**, **long-term investors**, and **bull market participants** who want to:
- Measure **pullback depth** in real-time
- Identify **potential support zones**
- Set **alerts** when price enters key retracement levels
---
### Features
| Feature | Description |
|--------|-------------|
| **Dynamic ATH Tracking** | Automatically updates with every new high |
| **4 Pullback Levels** | 5%, 10%, 15%, 20% below ATH |
| **Live Pullback % Label** | Shows current % drop from ATH (top-right) |
| **Customizable Lines** | Toggle visibility, change colors & styles |
| **Built-in Alerts** | Trigger on entry into each zone |
| **No Errors** | Works on 50k+ bar charts (BTC, SPX, etc.) |
| **Time-Based Lines** | Uses `xloc.bar_time` – no 500-bar future limit |
---
### How to Use
1. Apply to any chart (stocks, crypto, forex, indices)
2. Watch the **info box** for current pullback %
3. Use lines as **potential buy zones** during corrections
4. Set **alerts** to be notified when price enters a level
> Example: If ATH = $100 →
> - 5% = $95
> - 10% = $90
> - 15% = $85
> - 20% = $80
---
### Inputs
- **Show 5% / 10% / 15% / 20% Level** → Toggle on/off
- **Line Colors** → Fully customizable
- **Line Style** → Solid, Dashed, or Dotted
---
### Alerts
Create alerts directly from the indicator:
- `"Entered 5% Pullback"`
- `"Entered 10% Pullback"`
- etc.
---
### Best For
- Bull market corrections
- Long-term position sizing
- Risk management in uptrends
- Swing entries on dips
---
### Notes
- Works on **all timeframes**
- **Log scale compatible** (lines adjust correctly)
- No repainting – ATH only updates on confirmed highs
---
**Built with Pine Script v6 – Clean, fast, reliable.**
*Happy trading!*

Rolling Correlation vs Another Symbol (SPY Default)This indicator visualizes the rolling correlation between the current chart symbol and another selected asset, helping traders understand how closely the two move together over time.
It calculates the Pearson correlation coefficient over a user-defined period (default 22 bars) and plots it as a color-coded line:
• Green line → positive correlation (move in the same direction)
• Red line → negative correlation (move in opposite directions)
• A gray dashed line marks the zero level (no correlation).
The background highlights periods of strong relationship:
• Light green when correlation > +0.7 (strong positive)
• Light red when correlation < –0.7 (strong negative)
Use this tool to quickly spot diversification opportunities, confirm hedges, or understand how assets interact during different market regimes.

Forex Dynamic Lot Size CalculatorForex Dynamic Lot Size Calculator for Forex. Works on USD Base and USD Quote pairs. Provides real-time data based on stop-loss location. Allows you to know in real-time how the number of lots you need to purchase to match your risk %.
Number of Lots is calculated based on total risk. Total risk is calculated based on Stop-Loss + Commission + Spread Fees + Slippage measured in pips. Also includes data such as break-even pips, net take profit, margin required, buying power used, and a few others. All are real-time and anchored to the current price.
The intention of creating this indicator is to help with risk management. You know exactly how many lots you need to get this very moment to have your total risk at lets say $250, which includes commission fees, spread fees, and slippage.
To put it simply, if I was to enter the trade right now and willing to risk exactly $250, how many lots will I need to get right this second?
---
- To use adjust Account Settings along with other variables.
- Stop Loss Mode can be Manual or Dynamic. If you select Dynamic, then you will have to adjust Stop Loss Level to where you can see the reference line on the screen. It is at 1.1 by default. Just enter current price and the line will appear. Adjust it by dragging it to where you want your stop loss to be.
- Take Profit Mode can also be Manual or Dynamic. I just keep my TP at Manual and use Quick Access to set Quick RR levels.
- Adjust Spreads and Slippage to your liking. I tried to have TV calculate current spread, but it seem like it doesn't have access to real-life data for me like MT5 does. I just use average instead. Both are optional, depending on your broker and type of account you use.
- Pip Value for the current pair, Return on Margin, and Break-even line can be turned on and off, based on your needs. I just get the Break-even value in pips from the pannel and use that as reference where I need to relocate my stop loss to break-ever (commission + spreds + slippage).
- Panel is fully customizable based on your liking. Important fields are highlighted along with reference lines.

AlfaBitcoin Dashboard – Estrategia Combinada (Juan + Gael)Integrate the TradingView (TV) indicators with the sessions from October 16 and 21 (Gael Sánchez Smith and Juan Rodríguez). We can build an alert system or dashboard that combines what was discussed in both sessions with your custom indicators on TradingView.

Quantum Portfolio vs S&P 500 (Base: May 2, 2021)This script compares the performance of a custom Quantum Portfolio — a weighted basket of quantum computing, semiconductor, and cybersecurity stocks — against the S&P 500 Index, with both series rebased to 100 on May 2 2021.
It provides a clear, normalized view of cumulative returns, allowing you to visualize portfolio outperformance or underperformance relative to the broader market benchmark.

Quantum Portfolio vs NASDAQ (Base: May 2, 2021)This custom Pine Script indicator tracks and compares the cumulative performance of a multi-asset “Quantum Portfolio” against the NASDAQ 100 benchmark, rebased to a common starting point on May 2, 2021.
Both series are normalized to a base value of 100 on that date, allowing direct visual comparison of percentage growth or decline over time.

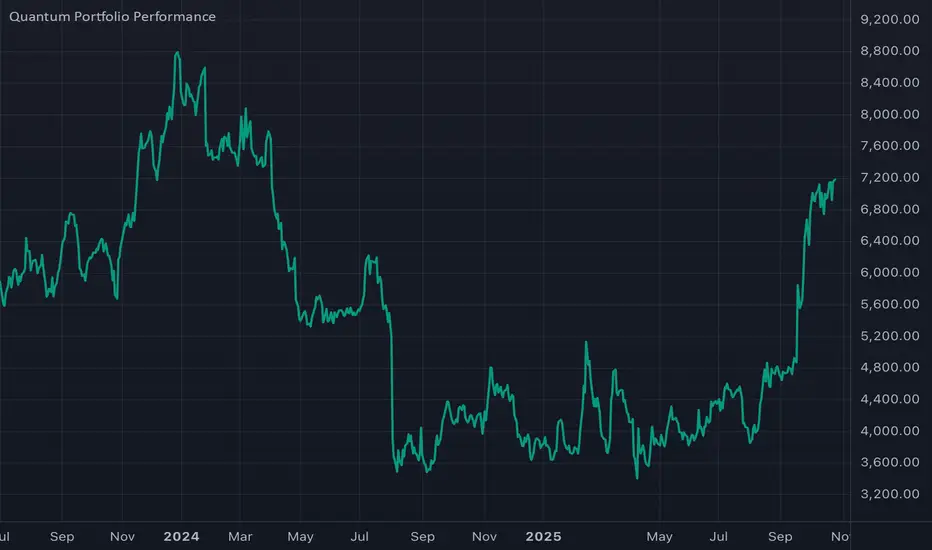
Thematic Portfolio: Quantum Computing & Core TechThis indicator tracks the aggregated performance of a curated thematic portfolio representing the Quantum Computing & Core Technology sector.
It combines leading equities and ETFs with predefined weights to reflect a diversified exposure across quantum hardware, AI infrastructure, and semiconductor backbones.
Composition:
Stocks: Rigetti (RGTI), IonQ (IONQ), D-Wave (QBTS), Palantir (PLTR), Intel (INTC), Arqit (ARQQ)
ETFs: BUG, QTUM, SOXX, IHAK
Methodology:
Each component’s normalized performance is weighted according to its strategic importance within the theme (R&D intensity, infrastructure leverage, and hardware dependence). The indicator dynamically aggregates the weighted series to visualize the cumulative return of the quantum computing ecosystem versus traditional benchmarks.
Intended use:
Compare thematic returns vs. S&P 500 or NASDAQ
Identify macro inflection points in the quantum tech narrative
Backtest thematic exposure strategies or structure twin-win / delta-one certificates
Note: This script is for analytical and educational purposes only and does not constitute financial advice.
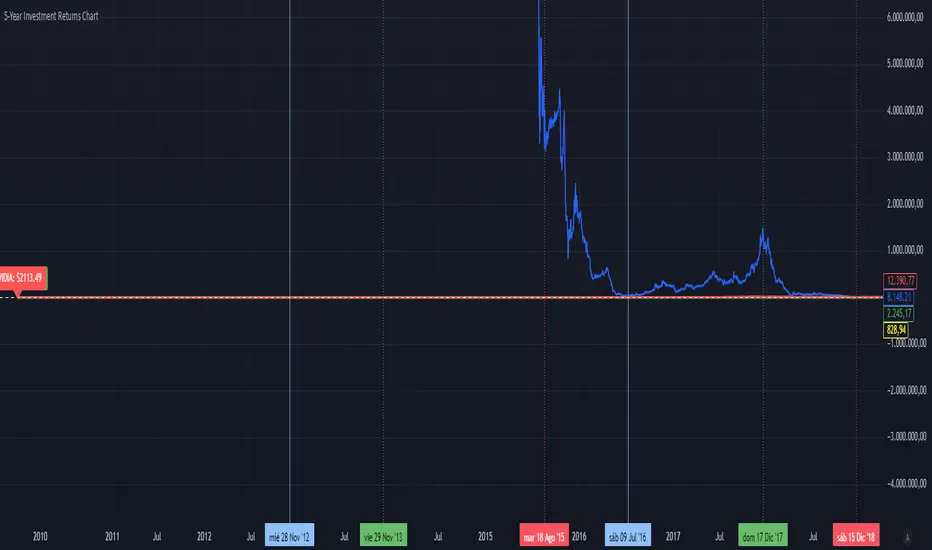
5-Year Returns Chart BTCvsSPXvsGOLDvsNVDACompare between thes 4 assets:
BTC
NVDA
SPX
GOLD
With an initial 1000$ investment in the last 5 years each return