AI Probabilistic OrderFlow Scalper⭐ Description:
📌 AI Probabilistic OrderFlow Scalper
This script combines Order Flow, Auction Market Theory, Volume Imbalance, Market Structure (HH/LL), RSI bias filtering, and a probability-based direction model inspired by AI and statistics.
It produces high-precision scalping entries designed for fast markets such as Futures, while remaining compatible with all markets (indices, crypto, forex, metals).
This is not a typical indicator — it is a probabilistic predictive model engineered to provide sniper entries, a tick-based Take Profit, a volatility-adaptive ATR Stop Loss, and optional Value Area levels (VAH/VAL/POC).
⭐ Main Features:
🔥 Directional probability model (AI-style weighted scoring)
📊 Order Flow imbalance (delta-like logic)
📈 HH/LL market structure detection
🎯 Smart RSI bias filter
🚀 One signal per trend shift (anti-spam)
🎯 Tick-based Take Profit (perfect for NQ / futures)
🛡️ ATR-based dynamic Stop Loss
📉 Value Area display: VAH, VAL, POC
🔊 Volume confirmation filter
📡 Directional probability plot
✔️ Works for Futures, Crypto, Forex, Indices
🧠 Probabilistic AI Approach
The model uses a 3-factor scoring system:
Order Flow imbalance
Market structure (HH/LL)
RSI trend bias
Each validated condition = 1 point.
The total score is converted into Buy/Sell probabilities, and the higher-probability direction is selected.
When probability exceeds the threshold (e.g. 80%), the system triggers a high-confidence sniper signal.
This mirrors Revenue Management logic:
→ Only take a decision when probability of success is maximized.
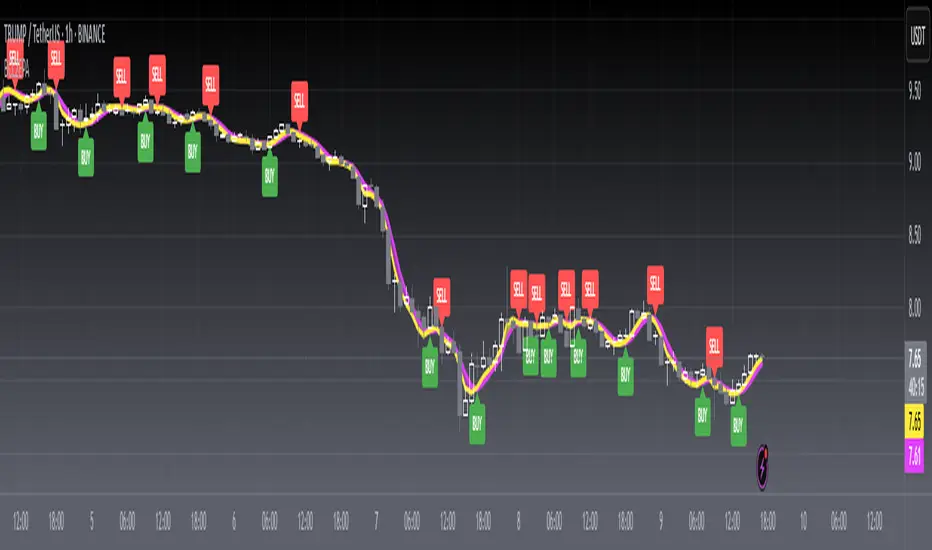
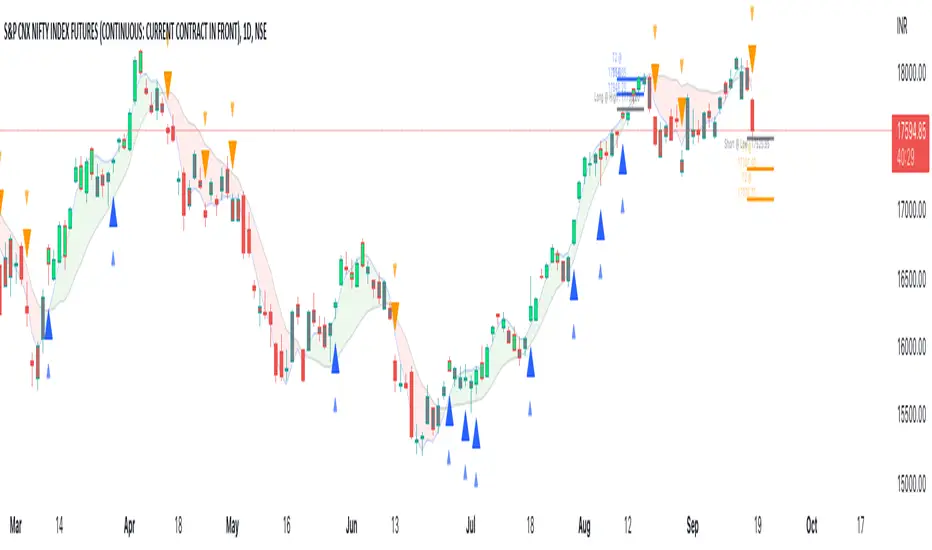
🎯 Buy/Sell Signals (Sniper Entries)
🔵 Green triangle under the candle = high-probability Buy
🔴 Red triangle above the candle = high-probability Sell
✔️ Only one signal per directional shift
✔️ Signals appear only when all strict filters are satisfied
📌 Automatic TP / SL
TP: fixed tick-based (e.g. 100 ticks for NQ scalping)
SL: ATR-based, adapts to volatility
TP/SL display can be enabled or disabled
Perfectly calibrated for high-speed scalping.
📘 How to Use
Use on every timeframe
Adjust probability threshold (75–90 recommended)
Enable strict mode for maximum precision
Let the model filter entries automatically
Choose a TP suitable for your market
Optionally display VAH/VAL/POC for Auction Theory context
Always test using backtesting before going live
🏆 Advantages
Extremely fast for scalping
High win-rate potential via probabilistic filtering
Clean signals (no noise or spam)
Combines the strongest trading frameworks:
Order Flow
Market Structure
Statistical modeling
Volume profiling
Automated risk management
Predictive

Enhanced Holt-Winters RSI [BOSWaves]Enhanced Holt-Winters RSI – Next-Level Momentum Smoothing & Signal Precision
Overview
The Enhanced Holt-Winters RSI transforms the classic Relative Strength Index into a robust, lag-minimized momentum oscillator through Holt-Winters triple exponential smoothing. By modeling the level, trend, and cyclical behavior of the RSI series, this indicator delivers smoother, more responsive signals that highlight overbought/oversold conditions, momentum shifts, and high-conviction trading setups without cluttering the chart with noise.
Unlike traditional RSI, which reacts to historical data and produces frequent whipsaws, the Enhanced Holt-Winters RSI filters transient price fluctuations, enabling traders to detect emerging momentum and potential reversal zones earlier.
Theoretical Foundation
The traditional RSI measures relative strength by comparing average gains and losses, but suffers from:
Lag in trend recognition : Signals often arrive after momentum has shifted.
Noise sensitivity : High-frequency price movements generate unreliable crossovers.
Limited insight into structural market shifts : Standard RSI cannot contextualize cyclical or momentum patterns.
The Enhanced Holt-Winters RSI addresses these limitations by applying triple exponential smoothing directly to the RSI series. This decomposes the series into:
Level (Lₜ) : Represents the smoothed central tendency of RSI.
Trend (Tₜ) : Captures rate-of-change in smoothed momentum.
Seasonal Component (Sₜ) : Models short-term cyclical deviations in momentum.
By incorporating these elements, the oscillator produces smoothed RSI values that react faster to emerging trends while suppressing erratic noise. Its internal forecast is mathematical, influencing the smoothed RSI output and signals, rather than being directly plotted.
How It Works
The Enhanced Holt-Winters RSI builds its signal framework through several layers:
1. Base RSI Calculation
Computes standard RSI over the selected period as the primary momentum input.
2. Triple Exponential Smoothing (Holt-Winters)
The RSI is smoothed recursively to extract underlying momentum structure:
Level, trend, and seasonal components are combined to produce a smoothed RSI.
This internal smoothing reduces lag and enhances signal reliability.
3. Momentum Analysis
Short-term momentum shifts are tracked via a moving average of the smoothed RSI, highlighting acceleration or deceleration in directional strength.
4. Volume Confirmation (Optional)
Buy/sell signals can be filtered through a configurable volume threshold, ensuring only high-conviction moves trigger alerts.
5. Visual Output
Colored Candles : Represent overbought (red), oversold (green), or neutral (yellow) conditions.
Oscillator Panel : Plots the smoothed RSI with dynamic color coding for immediate trend context.
Signals : Triangular markers indicate bullish or bearish setups, with stronger signals flagged in extreme zones.
Interpretation
The Enhanced Holt-Winters RSI provides a multi-dimensional perspective on price action:
Trend Strength : Smoothed RSI slope and color coding reflect the direction and momentum intensity.
Momentum Shifts : Rapid changes in the smoothed RSI indicate emerging strength or weakness.
Overbought/Oversold Zones : Highlight areas where price is stretched relative to recent momentum.
High-Conviction Signals : Combined with volume filtering, markers indicate optimal entries/exits.
Cycle Awareness : Smoothing reveals structural patterns, helping traders avoid reacting to noise.
By combining these elements, traders gain early insight into market structure and momentum without relying on raw, lag-prone RSI data.
Strategy Integration
The Enhanced Holt-Winters RSI can be applied across trading styles:
Trend Following
Enter when RSI is aligned with price momentum and color-coded signals confirm trend direction.
Strong slope in the smoothed RSI signals trend continuation.
Reversal Trading
Look for RSI extremes with momentum shifts and strong signal markers.
Compression in oscillator values often precedes reversal setups.
Breakout Detection
Oscillator flattening in neutral zones followed by directional expansion indicates potential breakout conditions.
Multi-Timeframe Confluence
Higher timeframes provide directional bias; lower timeframes refine entry timing using smoothed RSI dynamics.
Technical Implementation Details
Input Source : Close, open, high, low, or price.
Smoothing : Holt-Winters triple exponential smoothing applied to RSI.
Parameters :
Level (α) : Controls smoothing of RSI.
Trend (β) : Adjusts responsiveness to momentum changes.
Seasonal Length : Defines cycles for short-term adjustments.
Delta Smoothing : Reduces choppiness in smoothed RSI difference.
Outputs :
Smoothed RSI
Colored candles and oscillator panel
Buy/Sell signal markers (with optional strength filtering)
Volume Filtering : Optional threshold to confirm signals.
Optimal Application Parameters
Asset-Specific Guidance:
Forex : Use moderate smoothing (α, β) to capture medium-term momentum swings while filtering minor price noise. Works best when combined with volume or volatility filters.
Equities : Balance responsiveness and smoothness to identify sustained sector momentum or rotational shifts; ideal for capturing clean directional transitions.
Cryptocurrency : Increase smoothing parameters slightly to stabilize RSI during extreme volatility; optional volume confirmation can help filter false signals.
Futures/Indices : Lower smoothing sensitivity emphasizes macro momentum and structural trend durability over short-term fluctuations.
Timeframe Optimization:
Scalping (1-5m) : Use higher sensitivity (lower smoothing factors) to react quickly to micro-momentum reversals.
Intraday (15m-1h) : Balance smoothing and responsiveness for detecting short-term acceleration and exhaustion zones.
Swing (4h-Daily) : Apply moderate smoothing to reveal underlying directional persistence and cyclical reversals.
Position (Daily-Weekly) : Use stronger smoothing to isolate dominant momentum trends and filter temporary pullbacks.
Integration Guidelines
Combine with trend filters (EMAs, SuperSmoother MA, ATR-based tools) for confirmation.
Use volume and signal strength markers to filter low-conviction trades.
Slope, color, and signal alignment can guide entry, stop placement, and scaling.
Disclaimer
The Enhanced Holt-Winters RSI is a technical analysis tool, not a guaranteed profit system. Effectiveness depends on proper settings, market structure, and disciplined risk management. Always backtest before live trading.

Combined Predictive Indicator### Combined Predictive Zones & Levels
This indicator is a powerful hybrid tool designed to provide a comprehensive map of potential future price action. It merges two distinct predictive models into a single, cohesive view, helping traders identify key levels of support, resistance, and areas of high confluence.
#### How It Works: Two Models in One
This script is built on two core components that you can use together or analyze separately:
**Part 1: Classic Range & Fibonacci Prediction**
This model uses classic technical analysis principles to project a potential range for the upcoming price action.
* **Highest High / Lowest Low:** It identifies the significant trading range over a user-defined lookback period.
* **Fibonacci Levels:** It automatically plots key Fibonacci retracement levels (e.g., 38.2% and 61.8%) within this range, which often act as critical support or resistance.
* **ATR & Average Range:** It calculates a "predicted" upper and lower boundary based on the average historical range and current volatility (ATR).
**Part 2: Advanced Predictive Ranges (Self-Adjusting Channels)**
This is a dynamic model that creates adaptive support and resistance zones based on a smoothed average price and volatility.
* **Dynamic Average:** It uses a unique moving average that only adjusts when the price moves significantly, creating a stable baseline.
* **ATR-Based Zones:** It projects multiple levels of support (S1, S2) and resistance (R1, R2) around this average, which widen and narrow based on market volatility. These zones often signal areas where price might stall or reverse.
#### Key Features:
* **Hybrid Model for Confluence:** The true power of this indicator lies in finding where the levels from both models overlap. A Fibonacci level aligning with a Predictive Range support zone is a much stronger signal.
* **Comprehensive Data Table:** A clean, on-chart table displays the precise values of all key predictive levels, allowing for quick reference and precise trade planning.
* **Multi-Timeframe (MTF) Capability:** The Advanced Predictive Ranges can be calculated on a higher timeframe, giving you a broader market context.
* **Fully Customizable:** All lengths, multipliers, and levels for both models are fully adjustable in the settings to fit any asset or trading style.
* **Clear Visuals:** All zones and levels are color-coded for intuitive and easy-to-read analysis.
#### How to Use:
1. Look for areas of **confluence** where multiple levels from both models cluster together. These are high-probability zones for price reactions.
2. Use the Predictive Range zones (S1/S2 and R1/R2) as potential targets for trades or as areas to watch for entries and exits.
3. Pay attention to the on-chart table for exact price levels to set limit orders or stop-losses.
**Disclaimer:** This script is an analytical tool for educational purposes and should not be considered financial advice. All trading involves risk. Past performance is not indicative of future results. Always use this indicator as part of a comprehensive trading strategy with proper risk management.
Feedback is welcome! If you find this tool useful, please leave a like.

ConeCastConeCast is a forward-looking projection indicator that visualizes a future price range (or "cone") based on recent trend momentum and adaptive volatility. Unlike lagging bands or reactive channels, this tool plots a predictive zone 3–50 bars ahead, allowing traders to anticipate potential price behavior rather than merely react to it.
How It Works
The core of ConeCast is a dynamic trend-slope engine derived from a Linear Regression line fitted over a user-defined lookback window. The slope of this trend is projected forward, and the cone’s width adapts based on real-time market volatility. In calm markets, the cone is narrow and focused. In volatile regimes, it expands proportionally, using an ATR-based % of price to scale.
Key Features
📈 Predictive Cone Zone: Visualizes a forward range using trend slope × volatility width.
🔄 Auto-Adaptive Volatility Scaling: Expands or contracts based on market quiet/chaotic states.
📊 Regime Detection: Identifies Bull, Bear, or Neutral states using a tunable slope threshold.
🧭 Multi-Timeframe Compatible: Slope and volatility can be calculated from higher timeframes.
🔔 Smart Alerts: Detects price entering the cone, and signals trend regime changes in real time.
🖼️ Clean Visual Output: Optionally includes outer cones, trend-trail marker, and dashboard label.
How to Use It
Use on 15m–4H charts for best forward visibility.
Look for price entering the cone as a potential trend continuation setup.
Monitor regime changes and volatility expansion to filter choppy market zones.
Tune the slope sensitivity and ATR multiplier to match your symbol's behavior.
Use outer cones to anticipate aggressive swings and wick traps.
What Makes It Unique
ConeCast doesn’t follow price — it predicts a possible future price envelope using trend + volatility math, without relying on lagging indicators or repainting logic. It's a hybrid of regression-based forecasting and dynamic risk zoning, designed for swing traders, scalpers, and algo developers alike.
Limitations
ConeCast projects based on current trend and volatility — it does not "know" future price. Like all projection tools, accuracy depends on trend persistence and market conditions. Use this in combination with confirmation signals and risk management.

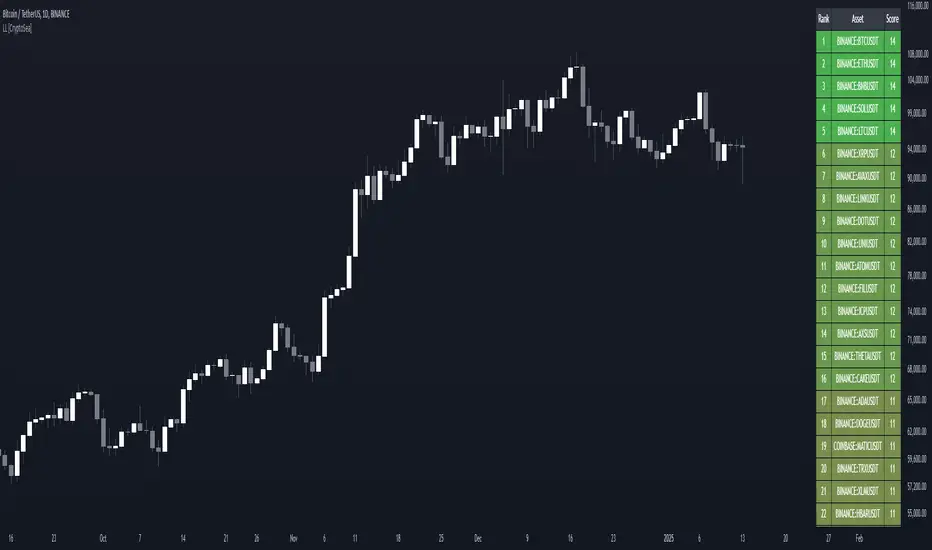
Lead-Lag Market Detector [CryptoSea]The Lead-Lag Market Detector is an advanced tool designed to help traders identify leading and lagging assets within a chosen market. This indicator leverages correlation analysis to rank assets based on their influence, making it ideal for traders seeking to optimise their portfolio or spot key market trends.
Key Features
Dynamic Asset Ranking: Utilises real-time correlation calculations to rank assets by their influence on the market, helping traders identify market leaders and laggers.
Customisable Parameters: Includes adjustable lookback periods and correlation thresholds to adapt the analysis to different market conditions and trading styles.
Comprehensive Asset Coverage: Supports up to 30 assets, offering broad market insights across cryptocurrencies, stocks, or other markets.
Gradient-Enhanced Table Display: Presents results in a colour-coded table, where assets are ranked dynamically with influence scores, aiding in quick visual analysis.
In the example below, the ranking highlights how assets tend to move in groups. For instance, BTCUSDT, ETHUSDT, BNBUSDT, SOLUSDT, and LTCUSDT are highly correlated and moving together as a group. Similarly, another group of correlated assets includes XRPUSDT, FILUSDT, APEUSDT, XTZUSDT, THETAUSDT, and CAKEUSDT. This grouping of assets provides valuable insights for traders to diversify or spread exposure.
If you believe one asset in a group is likely to perform well, you can spread your exposure into other correlated assets within the same group to capitalise on their collective movement. Additionally, assets like AVAXUSDT and ZECUSDT, which appear less correlated or uncorrelated with the rest, may offer opportunities to act as potential hedges in your trading strategy.
How it Works
Correlation-Based Scoring: Calculates pairwise correlations between assets over a user-defined lookback period, identifying assets with high influence scores as market leaders.
Customisable Thresholds: Allows traders to define a correlation threshold, ensuring the analysis focuses only on significant relationships between assets.
Dynamic Score Calculation: Scores are updated dynamically based on the timeframe and input settings, providing real-time insights into market behaviour.
Colour-Enhanced Results: The table display uses gradients to visually distinguish between leading and lagging assets, simplifying data interpretation.
Application
Portfolio Optimisation: Identifies influential assets to help traders allocate their portfolio effectively and reduce exposure to lagging assets.
Market Trend Identification: Highlights leading assets that may signal broader market trends, aiding in strategic decision-making.
Customised Trading Strategies: Adapts to various trading styles through extensive input settings, ensuring the analysis meets the specific needs of each trader.
The Lead-Lag Market Detector by is an essential tool for traders aiming to uncover market leaders and laggers, navigate complex market dynamics, and optimise their trading strategies with precision and insight.
Kalman PredictorThe **Kalman Predictor** indicator is a powerful tool designed for traders looking to enhance their market analysis by smoothing price data and projecting future price movements. This script implements a Kalman filter, a statistical method for noise reduction, to dynamically estimate price trends and velocity. Combined with ATR-based confidence bands, it provides actionable insights into potential price movement, while offering clear trend and momentum visualization.
---
#### **Key Features**:
1. **Kalman Filter Smoothing**:
- Dynamically estimates the current price state and velocity to filter out market noise.
- Projects three future price levels (`Next Bar`, `Next +2`, `Next +3`) based on velocity.
2. **Dynamic Confidence Bands**:
- Confidence bands are calculated using ATR (Average True Range) to reflect market volatility.
- Visualizes potential price deviation from projected levels.
3. **Trend Visualization**:
- Color-coded prediction dots:
- **Green**: Indicates an upward trend (positive velocity).
- **Red**: Indicates a downward trend (negative velocity).
- Dynamically updated label displaying the current trend and velocity value.
4. **User Customization**:
- Inputs to adjust the process and measurement noise for the Kalman filter (`q` and `r`).
- Configurable ATR multiplier for confidence bands.
- Toggleable trend label with adjustable positioning.
---
#### **How It Works**:
1. **Kalman Filter Core**:
- The Kalman filter continuously updates the estimated price state and velocity based on real-time price changes.
- Projections are based on the current price trend (velocity) and extend into the future (Next Bar, +2, +3).
2. **Confidence Bands**:
- Calculated using ATR to provide a dynamic range around the projected future prices.
- Indicates potential volatility and helps traders assess risk-reward scenarios.
3. **Trend Label**:
- Updates dynamically on the last bar to show:
- Current trend direction (Up/Down).
- Velocity value, providing insight into the expected magnitude of the price movement.
---
#### **How to Use**:
- **Trend Analysis**:
- Observe the direction and spacing of the prediction dots relative to current candles.
- Larger spacing indicates a potential strong move, while clustering suggests consolidation.
- **Risk Management**:
- Use the confidence bands to gauge potential price volatility and set stop-loss or take-profit levels accordingly.
- **Pullback Detection**:
- Look for flattening or clustering of dots during trends as a signal of potential pullbacks or reversals.
---
#### **Customizable Inputs**:
- **Kalman Filter Parameters**:
- `lookback`: Adjusts the smoothing window.
- `q`: Process noise (higher values make the filter more reactive to changes).
- `r`: Measurement noise (controls sensitivity to price deviations).
- **Confidence Bands**:
- `band_multiplier`: Multiplies ATR to define the range of confidence bands.
- **Visualization**:
- `show_label`: Option to toggle the trend label.
- `label_offset`: Adjusts the label’s distance from the price for better visibility.
---
#### **Examples of Use**:
- **Scalping**: Use on lower timeframes (e.g., 1-minute, 5-minute) to detect short-term price trends and reversals.
- **Swing Trading**: Identify pullbacks or continuations on higher timeframes (e.g., 4-hour, daily) by observing the prediction dots and confidence bands.
- **Risk Assessment**: Confidence bands help visualize potential price volatility, aiding in the placement of stops and targets.
---
#### **Notes for Traders**:
- The **Kalman Predictor** does not predict the future with certainty but provides a statistically informed estimate of price movement.
- Confidence bands are based on historical volatility and should be used as guidelines, not guarantees.
- Always combine this tool with other analysis techniques for optimal results.
---
This script is open-source, and the Kalman filter logic has been implemented uniquely to integrate noise reduction with dynamic confidence band visualization. If you find this indicator useful, feel free to share your feedback and experiences!
---
#### **Credits**:
This script was developed leveraging the statistical principles of Kalman filtering and is entirely original. It incorporates ATR for dynamic confidence band calculations to enhance trader usability and market adaptability.

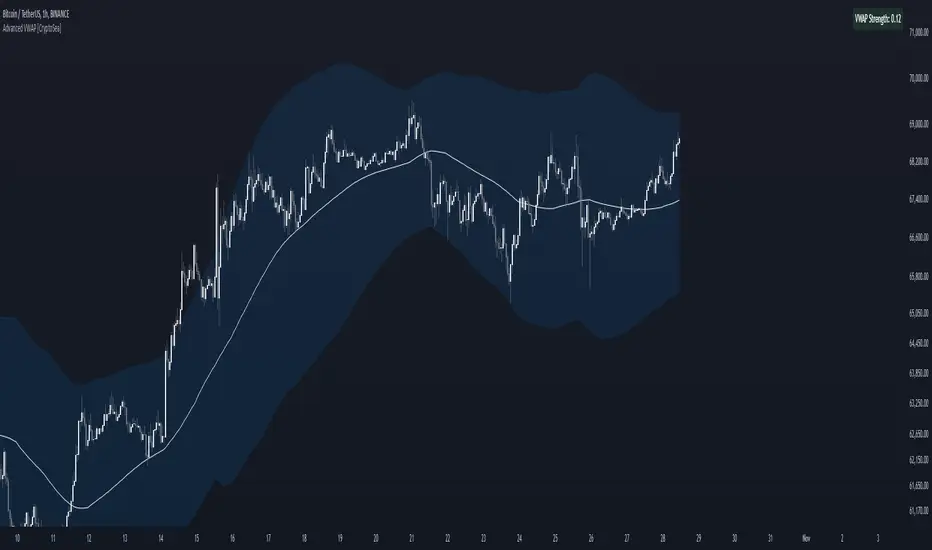
Advanced VWAP [CryptoSea]The Advanced VWAP is a comprehensive volume-weighted average price (VWAP) tool designed to provide traders with a deeper understanding of market trends through multi-layered VWAP analysis. This indicator is ideal for those who want to track price movements in relation to VWAP bands and detect key market levels with greater precision.
Key Features
Multi-Timeframe VWAP Bands: Includes multiple VWAP bands with different lookback periods (5, 10, 25, and 50), allowing traders to observe short-term and long-term price behavior.
Smoothed Band Options: Offers optional smoothing of VWAP bands to reduce noise and highlight significant trends more clearly.
Dynamic Median Line Display: Plots the median line of the VWAP bands, providing a reference for price movements and potential reversal zones.
VWAP Trend Strength Calculation: Measures the strength of the trend based on the price's position relative to the VWAP bands, normalized between -1 and 1 for easier interpretation.
In the example below we can see the VWAP Forecastd Cloud, which consists of multiple layers of VWAP bands with varying lookback periods, creating a dynamic forecast visualization. The cloud structure represents potential future price ranges by projecting VWAP-based bands outward, with darker areas indicating higher density and overlap of the bands, suggesting stronger support or resistance zones. This approach helps traders anticipate price movement and identify areas of potential consolidation or breakout as the price interacts with different layers of the forecast cloud.
How it Works
VWAP Calculation: Utilizes multiple VWAP calculations based on various lookback periods to capture a broad range of price behaviors. The indicator adapts to different market conditions by switching between short-term and long-term VWAP references.
Smoothing Algorithms: Provides the ability to smooth the VWAP bands using different moving average types (SMA, EMA, SMMA, WMA, VWMA) to suit various trading strategies and reduce market noise.
Trend Strength Analysis: Computes the trend strength based on the price's distance from the VWAP bands, with a value range of -1 to 1. This feature helps traders identify the intensity of uptrends and downtrends.
Alert Conditions: Includes alert options for crossing above or below the smoothed median line, as well as touching the smoothed upper or lower bands, providing timely notifications for potential trading opportunities.
This image below illustrates the use of smoothed VWAP bands, which provide a cleaner representation of the price's relationship to the VWAP by reducing market noise. The smoothed bands create a flowing cloud-like structure, making it easier to observe significant trends and potential reversal points. The circles highlight areas where the price interacts with the smoothed bands, indicating potential key levels for trend continuation or reversal. This setup helps traders focus on meaningful movements and filter out minor fluctuations, improving the identification of strategic entry and exit points based on smoother trend signals.
Application
Strategic Entry and Exit Points: Helps traders identify optimal entry and exit points based on the interaction with VWAP bands and trend strength readings.
Trend Confirmation: Assists in confirming trend strength by analyzing price movements relative to the VWAP bands and detecting significant breaks or touches.
Customized Analysis: Supports a wide range of trading styles by offering adjustable smoothing, band settings, and alert conditions to meet specific trading needs.
The Advanced VWAP by is a valuable addition to any trader's toolkit, offering versatile features to navigate different market scenarios with confidence. Whether used for day trading or longer-term analysis, this tool enhances decision-making by providing a robust view of price behavior relative to VWAP levels.
Session Levels Predictor [LuxAlgo]The "Session Levels Predictor" indicator predicts the maximum/minimum levels that will be made within a user-specified session. Hit rate percentages are displayed to measure how often a specific level has been hit.
🔶 USAGE
The indicator can be used to estimate the expected maximum/minimum levels within a specified session, these are directly displayed at the start of a session. This operation can be useful to set take profits/stop losses levels when we expect to exit within a specific session.
Users can display up to 3 upper and lower extremities on their chart (by default only 2 upper and lower extremities are displayed), with their distance from the session opening price being determined by the user-set percentile setting, values closer to 100 will return levels farther away from the session opening price.
Predicting maximum/minimum levels effectively allows obtaining support/resistance levels for the user-defined session, with a breakout probability indicating how easy it can be for the price to reach the estimated levels. These levels can be extended outside the specified session, allowing to test their relevancy as support/resistance levels to prices outside the specified sessions.
🔶 DETAILS
To predict maximum/minimum levels made within a session we keep a record of the distance between a session's maximum/minimum value and the session opening price (opening price when the session starts).
By using the percentile_nearest_rank() on our recorded distances we draw levels from the session opening price. If a level is hit between 2 sessions, this is saved for further calculations.
Lastly, a % hit rate of these levels is shown at the sessions open, indicating the probability that these levels could be hit before the next session.
🔹 array.percentile_nearest_rank()
Returns the value for which the specified percentage of array values (percentile) is less than or equal to it, using the nearest-rank method.
For example, taking the 75th percentile from our recorded distances between the maximum session level and session opening price will return a new distance where 75% of the recorded distances are lower.
The same goes for the green session's open - low levels
🔶 SETTINGS
Session: User-defined session interval, uses the symbol timezone.
Percentile (1, 2, 3): K-th percentile used to estimate session max/min levels, higher values will return more distant levels.
Max Population: Maximum amount of recorded distance data for the calculation of percentiles.
🔹 Style
Extend Middle Line: Toggle to extend the blue Middle Line to the next session - Default disabled

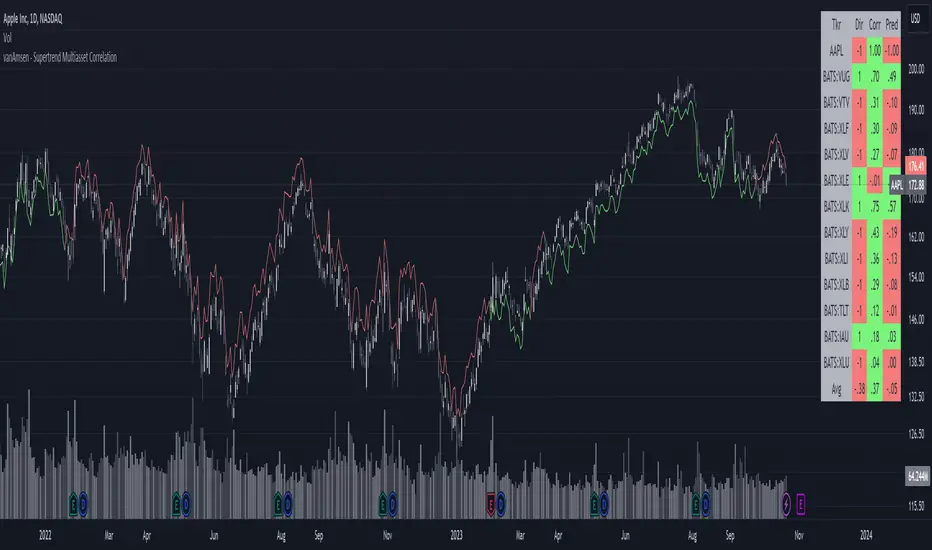
Supertrend Multiasset Correlation - vanAmsen Hello traders!
I am elated to introduce the "Supertrend Multiasset Correlation" , a groundbreaking fusion of the trusted Supertrend with multi-asset correlation insights. This approach offers traders a nuanced, multi-layered perspective of the market.
The Underlying Concept:
Ever pondered over the term Multiasset Correlation?
In the intricate tapestry of financial markets, assets do not operate in silos. Their movements are frequently intertwined, sometimes palpably so, and at other times more covertly. Understanding these correlations can unlock deeper insights into overarching market narratives and directional trends.
By melding the Supertrend with multi-asset correlations, we craft a holistic narrative. This allows traders to fathom not merely the trend of a lone asset but to appreciate its dynamics within a broader market tableau.
Strategy Insights:
At the core of this indicator is its strategic approach. For every asset, a signal is generated based on the Supertrend parameters you've configured. Subsequently, the correlation of daily price changes is assessed. The ultimate signal on the selected asset emerges from the average of the squared correlations, factoring in their direction. This indicator not only accounts for the asset under scrutiny (hence a correlation of 1) but also integrates 12 additional assets. By default, these span U.S. growth ETFs, value ETFs, sector ETFs, bonds, and gold.
Indicator Highlights:
The "Supertrend Multiasset Correlation" isn't your run-of-the-mill Supertrend adaptation. It's a bespoke concoction, tailored to arm traders with an all-encompassing view of market intricacies, fortified with robust correlation metrics.
Key Features:
- Supertrend Line : A crystal-clear visual depiction of the prevailing market trajectory.
- Multiasset Correlation : Delve into the intricate interplay of various assets and their correlation with your primary instrument.
- Interactive Correlation Table : Nestled at the top right, this table offers a succinct overview of correlation metrics.
- Predictive Insights : Leveraging correlations to proffer predictive pointers, adding another layer of conviction to your trades.
Usage Nuances:
- The bullish Supertrend line radiates in a rejuvenating green hue, indicative of potential upward swings.
- On the flip side, the bearish trajectory stands out in a striking red, signaling possible downtrends.
- A rich suite of customization tools ensures that the chart resonates with your trading ethos.
Parting Words:
While the "Supertrend Multiasset Correlation" bestows traders with a rejuvenated perspective, it's paramount to embed it within a comprehensive trading blueprint. This would include blending it with other technical tools and adhering to stringent risk management practices. And remember, before plunging into live trades, always backtest to fine-tune your strategies.
Predictive Channels [LuxAlgo]The Predictive Channels indicator is a real-time estimate of a trend channel. The indicator returns 2 resistances, 2 supports, and an average line.
🔶 USAGE
The Predictive Channels attempt to find a real-time estimate of an underlying linear trend in the price, the returned supports/resistances are constructed from this estimate.
The area between the price and the estimated trend is also highlighted, with a green color when the price is above the estimated trend, indicating a bullish variation relative to the trend, and a red color indicating a bearish variation.
Price deviating significantly from an estimated trend will return new channels. The Factor setting controls the allowed distance between the price and the trend estimate, with higher values allowing for greater distances and less frequent channels.
The Slope setting will affect the steepness of the channels, with lower values returning steeper channels, this can cause the price to more quickly deviate from the estimated trend, increasing the frequency at which new channels are created.
🔶 SETTINGS
Factor: Multiplicative factor, determines the allowed distance between the price and an estimated trend before a new channel is constructed.
Slope: Controls the line steepness of the channels, with lower values returning steeper lines.

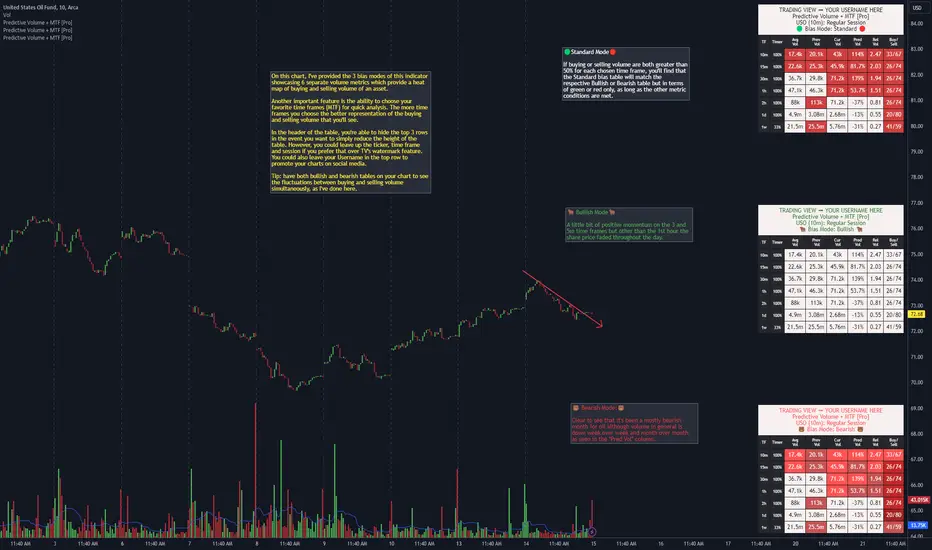
Predictive Volume + MTF [Pro]"Predictive Volume + MTF " is a predictor of near-future volume available on 13 of your favorite time frames. The script calculates the volume's % change (PredVol) between Current Volume vs. Previous Volume by predicting whether PredVol will be higher or lower at the end of the current bar using an "elapsed time" vs "volume so far" concept. This gives the benefit of the most up-to-date information without artificial low/high comparisons when a bar has just formed. For example, it would be common to see -100% in a lot of instances when a new bar is just forming which would be normal because volume at the start of a new candle will generally be lower than where it was when the last bar closed. Where this indicator shines is during this old to new bar formation relative to the volume that's carried over to the new bar. As a result, it will now be common to see PredVol values starting much higher because the calculation is dividing up the bar and analyzing fractions of it instead of the entire bar that would otherwise lead to these incorrect volume % change calculations.
Examples of Predictive Volume % Change:
In addition, this indicator uses many other advanced and robust features:
⚡ Matrices that create the table, allowing you to add and remove rows and columns to customize the table to show only the information that's important to you
⚡ View up to 13 time frames at once - it's generally a good idea to have at least 5 time frames up to get an overall feeling of the direction/sentiment of volume with the 1d being 1 of the 5
⏩ Includes the following popular time frames: 1m, 3m, 5m, 10m, 15m, 30m, 1h, 2h, 4h, 8h, 1d, week, month
⚡ 3 "bias mode" choices that use Relative Volume (RVOL) from calculations between Current, Previous & Average Volume that provide a heat map with varying degrees of color representing buying & selling momentum of your favorite asset. Traders generally have an innate bias when it comes to their trading methodology. The script's
author created separate modes to account for this. One way to utilize the indicator is to use 2 on your chart, 1 Bullish and 1 Bearish, to see if volume sentiment is skewed towards your particular bias
⏩ 🟢 Standard Mode 🔴 - displays green and red to depict volume momentum using same RVOL calculations as Bullish & Bearish modes
⏩ 🐂 Bullish Mode 🐂 - displays 5 colors to represent the levels of intensity of the Buy/Sell/RVOL data (light blue, green, yellow, light orange, dark orange)
⏩ 🐻 Bearish Mode 🐻 - displays 5 colors to represent the levels of intensity of the Buy/Sell/RVOL data (light red to dark red)
Ex. of all 3 bias modes showing very bullish volume sentiment:
Ex. of all 3 bias modes showing very bearish volume sentiment:
⚡ 2 types of alerts: PREDEFINED and CUSTOM
💡 PREDEFINED ALERTS consist of 4 Bullish & Bearish levels with Lvl 1 designed to be less sensitive than Lvl 2 etc
⏩ Configurable for every time frame, "On Close" or "Each Bar". On Close could be a better choice on lower time frames so that you're not getting a bunch of triggers over a short duration & Each Bar could be a better option for higher time frames so that you don't miss a move mid bar for instance
⏩ Creating a PREDEFINED BULLISH/BEARISH ALERT saves a snapshot of the alert's settings. You can then change the settings and create another alert
⏩ For example, you could create one alert for any alert type (bull and/or bear), for every time frame all at once, or you can create multiple & separate alerts, giving each one a unique name with the time frame that it's for: ex. BTC - Bullish Vol Lvl1 (1m) (keep in mind that TV provides you the ticker, time frame & alert
type automatically (the script's author hard-coded the label names within the script and as a result when they do fire you're provided the type of alert, such as "Bearish Vol (Lvl 1). Technically, you don't even need to name the alert again)
In this example, you're provided information on how to create PREDEFINED ALERTS, what conditions cause the alerts to trigger and how they'll look when they do fire
💡 CUSTOM ALERTS consists of 6 metrics giving you the ability to create your own custom compound alerts
⏩ Configurable for every time frame, "On Close" or "Each Bar". On Close could be a better choice on lower time frames so that you're not getting a bunch of triggers over a short duration & Each Bar could be a better option for higher time frames so that you don't miss a move mid bar for instance
⏩ Creating a CUSTOM ALERT works the same way as PREDEFINED ALERTS (see chart below)
⏩ Check your conditions in real-time for accuracy via a debug feature aka "SHOW HELP FOR TIME FRAME"
In this example, you're provided information on how to create CUSTOM ALERTS
⚡ Header function that provides the ticker, time frame and session that you're on (can use in lieu of TV's watermark feature, or use together)
⏩ There's 2 customizable header inputs - you could include your TradingView username in one of them for the times when promoting your charts across your favorite social media sites
⚡ Timer that shows you when a bar will begin/end plus other features that allow you to change the size and positioning of the table within your charts
⚡ An input that allows you to change the "significant figures" for rounding purposes - can be especially useful when volume is low or when you're trading OTC stocks
⚡ 4 volume moving average lengths - Intraday, Daily, Weekly, Monthly - for those times when 1 moving average to cover the entire gamut of just won't suffice
////////////////////////////////
There's quite a bit more information provided in the attached charts as well as the tooltips within the inputs section of the indicator. Should you have any questions, feedback etc, please do not hesitate to contact the script's author. My hope is that this indicator becomes an invaluable resource to you and you're able to integrate it in to your everyday trading tool bag to make more informed decisions.
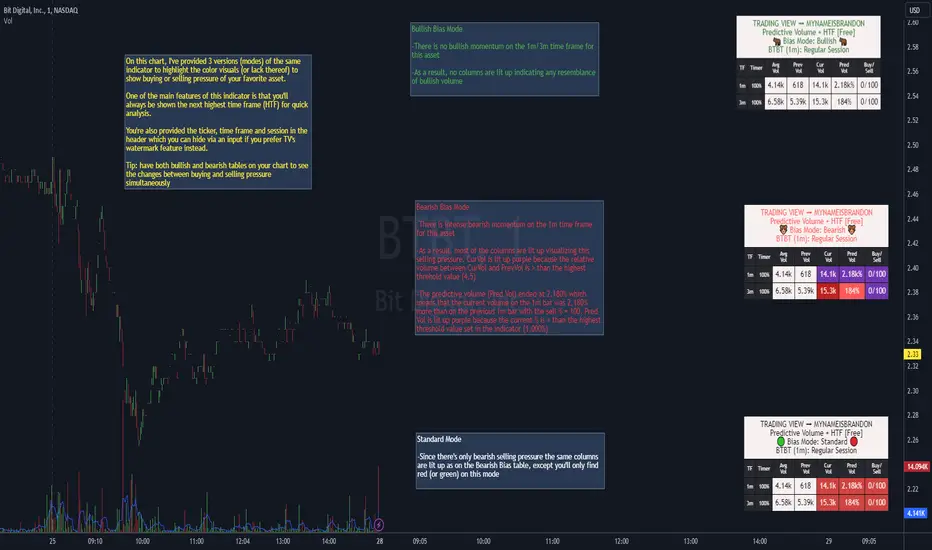
*Predictive Volume + HTF [Free]*"Predictive Volume + HTF " is a predictor of real-time to near-future volume % change on the current chart and the next highest time frame. The script calculates the volume's % change (Pred Vol) between Current Volume vs. Previous Volume by predicting whether Pred Vol will be higher or lower at the end of the current bar using an "elapsed time" vs "volume so far" concept. This gives the benefit of the most up-to-date information without artificial low/high comparisons when a bar has just formed. For example, it would be common to see -100% in a lot of instances when a new bar is just forming which would be normal because volume at the start of a new candle will generally be lower than where it was when the last bar closed. Where this indicator shines is during this old to new bar formation and the volume that's carried over to the new bar. As a result, it will now be common to see Pred Vol values starting much higher because the calculation is dividing up the bar and analyzing fractions of it instead of the entire bar that would otherwise lead to these incorrect volume % change calculations.
A few examples of Predictive Volume % Change:
In addition, this indicator uses many advanced and dynamic features:
⚡ Matrices that create the table, allowing you to add and remove columns to customize the table to show only the information that's important to you
⚡ View 2 time frames at once - meaning every time you switch time frames, the table will auto-adjust to show the next highest time frame, or "HTF"
⚡ Header function that keeps you aware of the ticker, time frame and session that you're on at all times (can use in lieu of TV's watermark feature, or use together)
⚡ Timer that shows you when a bar will begin/end
⚡ Includes the following popular time frames: 1m, 3m, 5m, 10m, 15m, 30m, 1h, 2h, 4h, 8h, 1d, week, month
⚡ 3 "bias mode" choices that use Relative Volume (RVOL) from calculations between Current, Previous & Average Volume that provide a visual with varying degrees of color representing buying & selling momentum of your favorite asset. Traders generally have an innate bias when it comes to their trading methodology. Of course it can change quickly depending on current market structure. The script's author created separate modes to account for these biases. One way to utilize the indicator is to use 2 on your chart with 1 Bullish bias \"middle right\" and another Bearish bias \"lower right\" to see if volume pressure is skewed towards your particular bias by showing how many colored boxes there are on each table.
⏩ Standard - 🟢🔴 - displays green and red to depict volume momentum using same RVOL calculations as Bullish & Bearish modes
⏩ Bullish - 🐂🐂 - displays 5 colors to represent the levels of intensity of the Buy/Sell/RVOL data (light blue, green, yellow, light orange, dark orange)
⏩ Bearish - 🐻🐻 - displays 5 colors to represent the levels of intensity of the Buy/Sell/RVOL data (light red to dark purple)
Ex. of all 3 bias modes during a burst of bullish volume momentum:
Ex. of all 3 bias modes during a burst of bearish volume momentum:
⚡ 2 alert types: 1 bullish & 1 bearish with 2 levels for each
⏩ The PREDEFINED ALERTS consist of 2 Bullish & Bearish levels with Lvl 1 designed to be less sensitive than Lvl 2
⏩ Configurable for every time frame, "On Close" or "Each Bar". On Close could be a better choice on lower time frames so that you're not getting a bunch of triggers over a short duration & Each Bar could be a better option for higher time frames so that you don't miss a move mid bar for instance
⏩ Creating a PREDEFINED BULLISH/BEARISH ALERT saves a snapshot of the alert's settings. You can then change the settings and create another alert. In this way, you can create multiple unique alerts
⏩ Create one alert for any alert type (bull and/or bear), for every time frame all at once, or you can create multiple & separate alerts, giving each one a unique name with the time frame that it's for: ex. BTC - Bullish Vol Lvl1 (1m)
In this example, you'll see what causes the alerts to trigger as well as how to create them and how they'll look when they do fire.
////////////////////////////////
It is with a sense of gratitude, appreciation and indebtedness to the coder of this script ©SimpleCryptoLife that I'm able to present this indicator to you after months of hard work. We hope that you find it invaluable during your own trading journey! Should you have any questions, feedback or critiques please do not hesitate to leave a comment.
Advanced Donchian Channels
Advanced Donchian Channels displays future donchian channel values based on the current information on the chart.
It displays a normal donchian channel at the specified user length with the future values extending from the current bar.
Depending on the direction of price movement, these values do not repaint. It is known when it does and does not repaint, and the actions are normal. See below for more information.
In a down trend, when the price is making new lows, the future "channel low" value will update every time the low is broken. The mean will also update, since the mean is the average of the channel high and channel low.
In a downtrend, the "channel high" value is concrete . It will not update until the high is broken.
Reverse these examples for uptrends.
Q;
How does it know the future values?
A:
Consider This: If we are below the current highest high, going down (aka: not setting new highs), the donchian channel "high" value will create a flat top, the flat top will start to decrease after we go further than our specified length. This is because the highest high within our specified length is no longer what it was previously. This action of time decay is a consistent movement of donchian channels . Because of this I am able to calculate these values before the current bar actually reaches them.
The indicator calculates the current length donchian channel at the current bar and then for every future bar up to your length specified it subtracts 1 from your length, calculates and displays the values accordingly.
The farthest future value is 1 length and the current bar is your specified length.
VALUES WILL ONLY BE UPDATED WHEN THE CHANNEL HIGH OR LOW IS BROKEN.
If price stays within the channel, all the future channel values will become solidified when the time reaches them.
This is not a gimmick, This data is accurate and can be used to help see future price trends
This chart should assist in visualizing what data you are seeing in this indicator.
Enjoy!

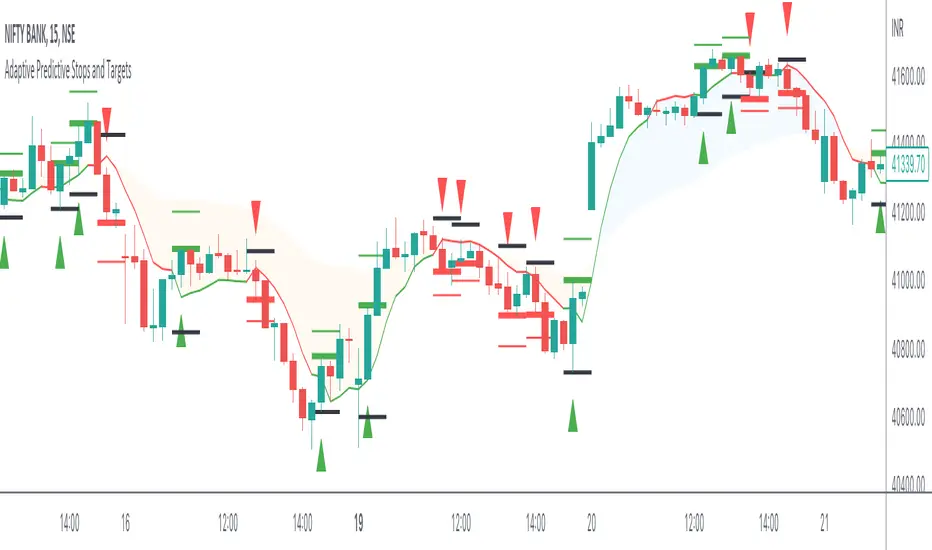
Adaptive Predictive Stops and Targets The indicator is an experiment to Predict Stops and 1st target for any liquid security and for any timeframe,
Intro
The indicator is made using Predictive Differential Filter of 2nd Degree
and an Adaptive Filter to generate Signals and define Targets and Stops
An adaptive filter is a system with a linear filter that has a transfer function controlled by variable parameters and a means to adjust those parameters according to an optimisation algorithm. Because of the complexity of the optimisation algorithms, almost all adaptive filters are digital filters. Thus Helping us classify our intent either long side or short side
The indicator use Adaptive Least mean square algorithm, for convergence of the filtered signals into a category of intents, (either buy or sell)
The Other Category of Filter used in the indicator is Predictive Differential Filter, which helps us estimate the acceleration of the prices and levels of significance for targeting and Stops
The Predictive Differential Filters are capable of predicting the next state of the input based on the interaction with a pre-specified number of filters, The prediction helps in minimising the quantisation error and in removing the granular noise which are caused by PCM systems.
How to Use
The logic to use is simple Buy at the High of the Signal Candle and Sell at the Low of the Signal Candle
Book your 50% position on the first target shown (respectively in green and red lines) and Trail the rest of the positions till you reach stop or breakeven!
vice versa for Sell,
Just Sell on the Low of the Signal Candle
What securities and timeframes will it work upon
The system is designed to work over any liquid security over any timeframe,
The Indicator has provisions for Alert
How to request Access
Just Private message me, do not use comment box for requesting access, use it only for constructive comments
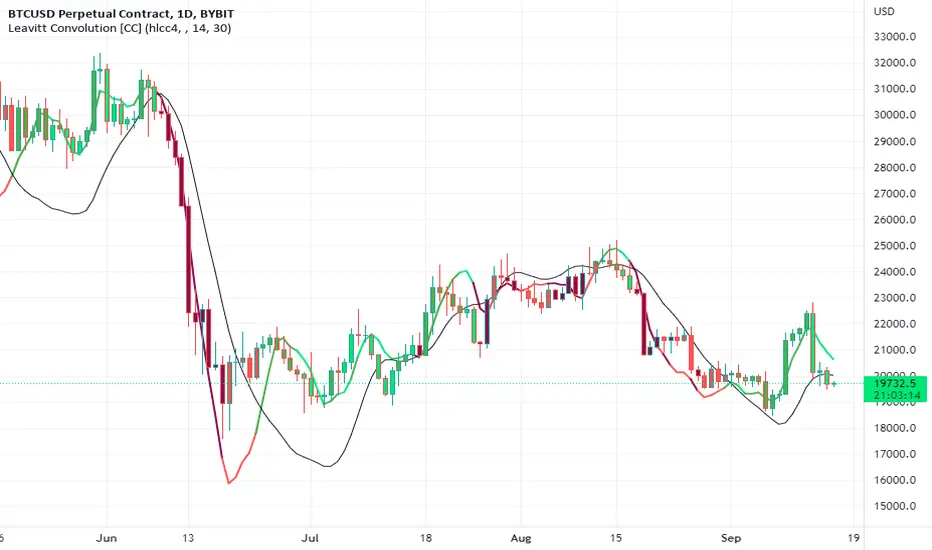
Leavitt Convolution [CC]The Leavitt Convolution indicator was created by Jay Leavitt (Stocks and Commodities Oct 2019, page 11), who is most well known for creating the Volume-Weighted Average Price indicator. This indicator is very similar to my Leavitt Projection script and I forgot to mention that both of these indicators are actually predictive moving averages. The Leavitt Convolution indicator doubles down on this idea by creating a prediction of the Leavitt Projection which is another prediction for the next bar. Obviously this means that it isn't always correct in its predictions but it does a very good job at predicting big trend changes before they happen. The recommended strategy for how to trade with these indicators is to plot a fast version and a slow version and go long when the fast version crosses over the slow version or to go short when the fast version crosses under the slow version. I have color coded the lines to turn light green for a normal buy signal or dark green for a strong buy signal and light red for a normal sell signal, and dark red for a strong sell signal.
This is another indicator in a series that I'm publishing to fulfill a special request from @ashok1961 so let me know if you ever have any special requests for me.
Optimal Confidence Scalper [OCS]Introduction
OCS : Optimal Confidence Scalpers, Utilise the computational approach towards finding confidence estimating in signal generating process, It helps u enter and exit the financial markets quickly, It buy and sell many times in a day with the objective of making consistent profits from incremental movements in the traded security's price. As we all know Lag is very undesirable because a trading system. Late trades can many times be worse than no trades at all, Main aim of the System is to find optimal Entry and Exit points for a successful trade
Mathematics behind the indicator
The indicator use two fundamentals pillars :
Estimation of a Confidence Interval
In frequentist statistics, a confidence interval (CI) is a range of estimates for an unknown parameter. A confidence interval is computed at a designated confidence level; the 95% confidence level is most common, but other levels, such as 90% or 99%, are sometimes used.
Desired properties are Validity, Optimality and Invariance
Polynomial Filters
The polynomial filters are based on the orthogonal polynomials of Legendre and Laguerre. Orthogonal polynomials are widely used in applied mathematics, physics and engineering, and the Legendre and Laguerre polynomials are only two of infinitely many sets, each of which has its own weight function.
They can be characterized in three equivalent ways:
1. They are the optimal lowpass filters that minimize the NRR, subject to additional constraints than the DC unity-gain condition
2. They are the optimal filters that minimize the NRR whose frequency response H(ω) satisfies certain flatness constraints at DC
3. They are the filters that optimally fit, in a least-squares sense, a set of data points to polynomials of different degrees.
The System uses Predictive Differentiation Filters, as subset to Polynomial Filters
Components of the System
Buy Signal and Sell Signals
=====================
=====================------ HOW TO USE IT
=====================
ENTRY and EXITS
Momentum Bands
Confidence Levels
Indicator Properties
Provision For Alerts
1. Buy Signal Alert
2. Sell Signal Alert
3. Exit Alert if in Buy Trade
4. Exit Alert if in Sell Trade
Some Examples
What TimeFrames To Use
U can use any Timeframe, The indicator is Adaptive in Nature,
I personally use timeframes such as : 1m, 5m 10m, 15m, ..... 1D, 1W
How to Access
U will need to privately message me.
use comment box for constructive comments
Thanks
predictive_moving_average
Description:
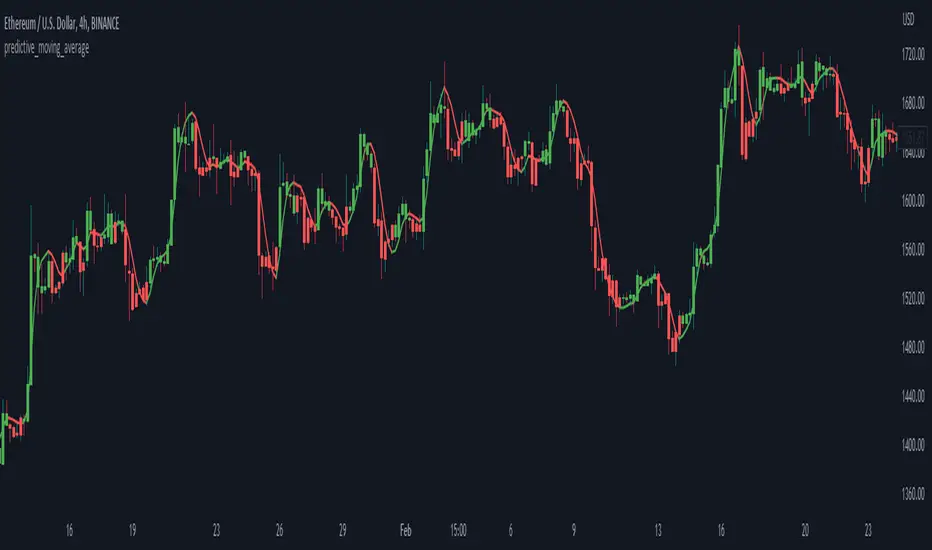
Originated by John F. Ehlers, could be found within (Rocket Science for Traders, pg. 212). Aim to provide a leading indicator (I assumed for the shorter time period), which smoothed the price with no lag. The indicator derives from 2 lines crossing i.e. a weighted moving average, of higher length as a predictor and shorter length as a trigger.
Predictive Moving Average:
predict = 2*wma1 - wma2
trigger = (4*predict+3*predict +2*predict +predict)/10
Feature:
Predictive moving average
Deviation band
Notes
Consider the support/resistance (dynamic) when entering the position
Some short direction change might be identified from deviation shrink
Green indicates to enter/long, while red indicates to close/short position
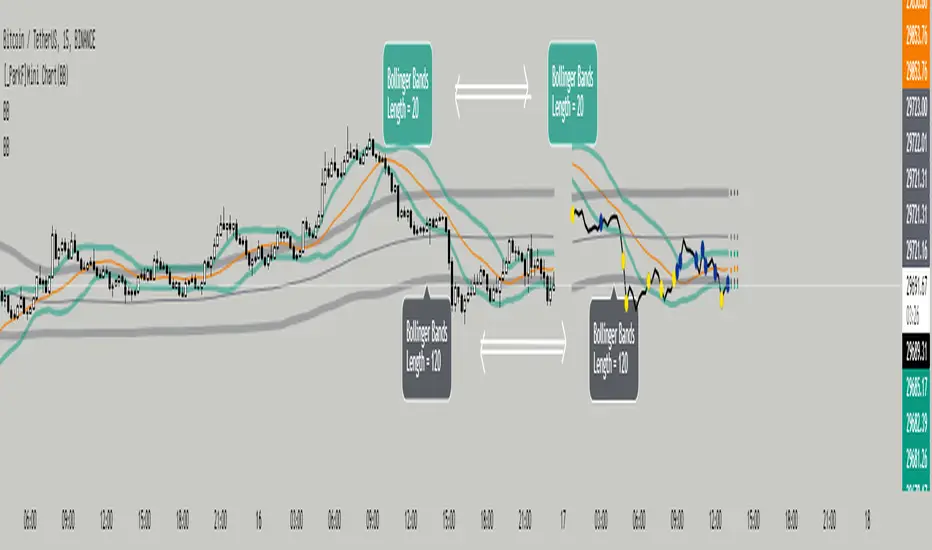
[_ParkF]Mini Chart(BB)Bollinger Bands of different lengths are displayed with a line chart in front of the candle.
A Bollinger band with a length of 20 and a Bollinger band with a length of 120 can be easily identified by the circle and color displayed whenever the line passes.
In the input menu, you can edit the length and deviation of the Bollinger band, the number of candles to be displayed in front, the thickness of the line, the color, and the color of the circle.
And the expected value of each Bollinger band was measured and displayed.
You can change the thickness and color of the displayed predictive circle in Predictive of the input menu.
-------------------------------------------------------------------------------------------------------------------------------------------------------------------------------------------------------------------------------------------
서로 다른 기간값을 가진 볼린저밴드를 캔들보다 앞쪽에 선 차트와 함께 표시하였습니다.
20의 기간값을 가진 볼린저밴드와 120의 기간값을 가진 볼린저밴드를 선차트가 크로스할 때 마다 표시되는 점과 색을 통해 쉽게 식별할 수 있습니다.
input 메뉴에서 볼린저밴드의 기간값과 편차, 앞 쪽에 표시될 캔들의 수와 선의 두께, 색상, 점의 색상을 수정할 수 있습니다.
그리고 각 볼린저밴드의 예상 값을 측정하여 표시하였습니다.
input 메뉴의 Predictive에서 표시된 Predictive circle의 두께와 색상을 변경할 수 있습니다.
[UPRIGHT Trading] OrderZones - Supply & Demand (Predictive) (cc)Hello Traders,
This is one that I've been working on a very, Very long time. As easy as it is to draw after the fact, as someone well versed in Supply and Demand; it's a bit more difficult to create all the calculations to show them, code them out, and then I went a step further — attempting to predict future ones as well.
Let's talk about what Supply & Demand Zones are. They are a pattern and technical analysis technique used in day and swing trading. Demand zone represents the area with strongest buying pressure and Supply zone represents selling pressure. Often these zones will show Institutional/Large buyers and sellers executing their orders causing price to move up or down very quickly, creating a long wick on a small and sometimes momentum that feeds into the larger timeframes. Therefore, in the simplest terms, the Supply and Demand Orderzones are the zones the price often gets rejected from or returned to; when Demand exceeds Supply, price jumps up and vice versa.
Unlike lines of support and resistance , these are zones more closely than precise lines, but can help gauge Support and Resistance on the fly.
Richard Wykoff was one of the first market analysts to explain the interaction of these phases, giving them four labels. It is in the understanding of Wyckoff's explanation of market price action, that supply and demand zones are also known as Accumulation and Distribution zones (Accumulation, Markup, Distribution, Markdown).
Shows potential entries on break from zone. Pivots. Large breakdowns or breakouts signalling possible trend change.
Super Fast Real-time Orderzone creation. Resistance line at Supply, shows multiple dimensions of each zone when large enough.
Different calculation, line, transparency settings
Minimalist mode with autobox
Features:
Multiple calculation modes with different lengths and displays.
AutoBox (Predictive Orderzones).
Buy/Sell Highlights.
UPRIGHT – Ultimate Reversals (Support/Resistance version).
Breakouts/Breakdowns + Signals.
Pivot Labels (HH, HL, etc).
Pivot Bar.
Pivot Buy /Sell Signals.
Fully Customizable—Change line types, transparency, colors, etc).
I am still working on the calculations for one more addition, but as it is, this should help anyone automate their S/D technical analysis.
Please see author instructions for access.
Cheers,
Mike
(UPRIGHT Trading)

Ehlers Optimum Predictor [CC]The Optimum Predictor was created by John Ehlers (Rocket Science For Traders pgs 209-210) and this indicator does a pretty good job of predicting major market moves. When the blue line crosses over the red line then this indicator is predicting an upcoming uptrend and when the blue line crosses under the red line then it is predicting an upcoming downtrend. Ehlers recommends using this indicator with an entire trading system to filter out any bad signals but most of the signals it gives are pretty accurate. He uses advanced digital signal processing to predict the future prices and uses it in an ema formula for the calculation. There are several ways to interpret this indicator: you can look for crossovers, you can also look for when the indicator goes above 0 for a general uptrend or below 0 for a general downtrend.
Let me know if there are any other scripts you would like to see me publish!

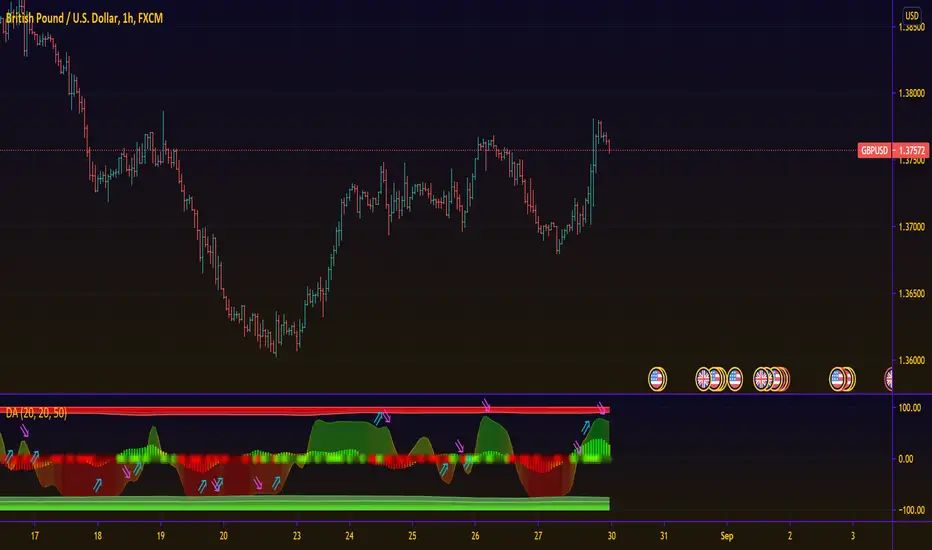
Directional AnalyzerThis script attempts to equip users with the necessary information about the direction of an instrument, and essentially it is a synergy of 3 algorithms.
The first algorithm (plotted as dots at level 0) studies the balance of delta volatility that constitutes the current bar and answers if bulls or bears are in control at that exact bar time
The second algorithm (plotted as an area) studies the development of delta volatility over the defined period by means of a polynomial regression. Effectively, it provides an overall picture of the trend strength.
The third algorithm (plotted as a line with arrow labels) utilizes simple elements of neural network in conjunction with some custom filters to predict the focal point that a trend will reverse its direction. This is predictive in nature, hence always adopt this with caution. While the labels display the predicted direction, the colors of the line also reflect the state of the current bar as well, adding to the confirmation of the first algorithm.
May you be on the right side of the trade.
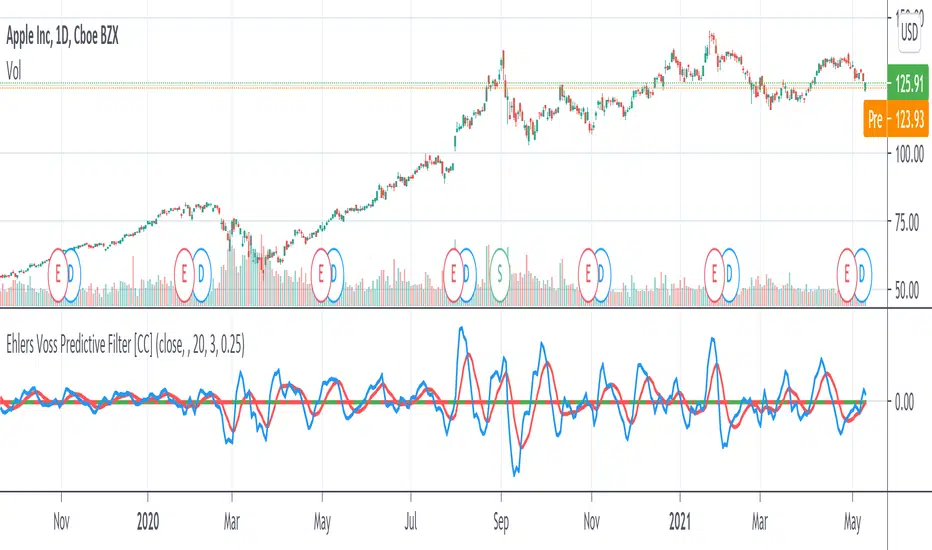
Ehlers Voss Predictive Filter [CC]The Voss Predictive Filter was created by John Ehlers (Stocks and Commodities August 2019) and this is a unique indicator in that it tries to predict future price action. I have color coded the middle line to show buy and sell signals so buy when the line turns green and sell when it turns red.
Let me know if there are any other indicators you want me to publish!
[blackcat] L2 Ehlers Predictive AverageLevel: 2
Background
John F. Ehlers introuced Predictive Average in his "Rocket Science for Traders" chapter 20 on 2001.
Function
The concept of taking a difference of lagging line from the original function to produce a leading function suggests extending the concept to moving averages. There is no direct theory for this, but it seems to work pretty well. If taking a 7-bar WMA of prices, that average lags the prices by 2 bars. If taking a 7-bar WMA of the first average, this second average is delayed another 2 bars. If taking the difference between the two averages and add that difference to the first average, the result should be a smoothed line of the original price function with no lag. Sure, Dr. Ehlers tried to use more lag for the second moving average, which
should produce a better predictive curve. However, remember the lesson of Chapter 3 of the book. An analysis curve cannot precede an event. You cannot predict an event before it occurs. If then taking a 4-bar WMA of the smoothed line to create a 1-bar lag, this lagging line becomes a signal when the lines cross. This is as close to an ideal indicator as we can get.
Key Signal
Predict ---> moving average fast line
Trigger ---> moving average slow line
Pros and Cons
100% John F. Ehlers definition translation of original work, even variable names are the same. This help readers who would like to use pine to read his book. If you had read his works, then you will be quite familiar with my code style.
Remarks
The 17th script for Blackcat1402 John F. Ehlers Week publication.
Readme
In real life, I am a prolific inventor. I have successfully applied for more than 60 international and regional patents in the past 12 years. But in the past two years or so, I have tried to transfer my creativity to the development of trading strategies. Tradingview is the ideal platform for me. I am selecting and contributing some of the hundreds of scripts to publish in Tradingview community. Welcome everyone to interact with me to discuss these interesting pine scripts.
The scripts posted are categorized into 5 levels according to my efforts or manhours put into these works.
Level 1 : interesting script snippets or distinctive improvement from classic indicators or strategy. Level 1 scripts can usually appear in more complex indicators as a function module or element.
Level 2 : composite indicator/strategy. By selecting or combining several independent or dependent functions or sub indicators in proper way, the composite script exhibits a resonance phenomenon which can filter out noise or fake trading signal to enhance trading confidence level.
Level 3 : comprehensive indicator/strategy. They are simple trading systems based on my strategies. They are commonly containing several or all of entry signal, close signal, stop loss, take profit, re-entry, risk management, and position sizing techniques. Even some interesting fundamental and mass psychological aspects are incorporated.
Level 4 : script snippets or functions that do not disclose source code. Interesting element that can reveal market laws and work as raw material for indicators and strategies. If you find Level 1~2 scripts are helpful, Level 4 is a private version that took me far more efforts to develop.
Level 5 : indicator/strategy that do not disclose source code. private version of Level 3 script with my accumulated script processing skills or a large number of custom functions. I had a private function library built in past two years. Level 5 scripts use many of them to achieve private trading strategy.