HTF Candles on Lower Timeframes (Manual OHLC)Hi everyone, this indicator is designed to plot higher timeframes candles on the chart. Here are the details:
The data is built directly from OHLC values at specific time intervals, instead of using request.security.
It supports 1H / 2H / 4H / 8H / 1D higher timeframes, and can be viewed on lower timeframes such as 5m / 10m / 15m / 30m.
The main idea behind this chart is to serve as a foundation for building other indicators that need to operate on higher timeframes while still being visualized on lower timeframes.
Feel free to share your feedback or ideas for improvement in the comments below.
Priceaction

V-Max: Tactical Clock & Price (Master Fit)Overview
The V-Max Tactical Clock & Price is a high-visibility utility dashboard engineered for precision execution in global financial markets. It serves as a "Physical Timezone Navigator," providing real-time price tracking and synchronized local time display directly on the chart. This ensures traders can align their execution with specific market openings and closing volatility regardless of the exchange's default timezone.
Core Technical Logic & Features
This script focuses on the physics of time-alignment and visual stability:
Physical Time Calibration Engine: Unlike standard UI clocks, this script employs a millisecond-level compensation engine using the formula: $timenow + (tz\_offset \times 60 \times 60 \times 1000)$. This allows for precise synchronization with any global market (e.g., London, New York, or Asia sessions).
Momentum-Driven Price Rendering: The price display utilizes conditional coloring logic ($close \ge open ? up\_col : dn\_col$) to provide immediate visual feedback on the current bar's momentum.
High-Identifiability UI (Master Fit): Leverages the table.new titan rendering engine with size.huge font specifications for the price. This ensures critical data remains readable even on small mobile screens or high-density multi-chart layouts.
Anti-Flicker Monospaced Formatting: Employs font.family_monospace to ensure strict numerical alignment, preventing visual flickering or "jumping" during periods of extreme market volatility.
How to Use
Timezone Setup: Enter your local GMT offset (e.g., +8 for Taiwan/Singapore, -5 for New York) in the settings.
Visual Customization: Adjust the dashboard position (default: Bottom Left) and background aesthetics to fit your professional trading workspace.
產品概述
V-Max 戰術時鐘與價格顯示器是一款為全球市場設計的高辨識度工具。它作為一個實時的「全球時區導航儀」,在圖表上直接提供實時價格追蹤與同步化的本地時間顯示,確保交易者能精確對齊各國市場開盤瞬間的波動。
核心技術邏輯與功能物理時間校準引擎:採用毫秒級時間補償運算,公式為:$timenow + (tz\_offset \times 60 \times 60 \times 1000)$。這讓交易者能精確校準全球任一交易所的本地時間。
動能價格渲染:價格顯示具備即時漲跌變色邏輯,提供直觀的即時盤感反饋。
特大字體 UI (Master Fit):採用 size.huge 字體規格顯示價格,確保在移動端或複雜多圖表布局下依然清晰易讀。
防閃爍等寬格式:使用等寬字體確保數字在劇烈波動時不會產生視覺跳動,維持高度的讀數穩定性。
Access & Support
This script is published as a Free Public Utility in the TradingView Library. Disclaimer: For educational purposes only. Past performance does not guarantee future results.
Disclaimer: This script is for technical analysis and educational purposes only. It does not provide financial advice.

Quant-Action Pro: Triple Confluence EngineQuant-Action Pro: Triple Confluence Engine
Systematic Framework for Structural Price Action Analysis
Quant-Action Pro is a high-performance analytical engine designed to synchronize institutional liquidity flow with market geometry. Instead of traditional "signals," this framework identifies Structural States where three independent algorithmic layers align, providing a objective roadmap for the current price action context.
1. Core Algorithmic Matrix
The engine operates by monitoring the interaction between price and three proprietary logic layers:
A. Institutional Flow Node (SP2L) —
Logic: Monitors "Passive Liquidity Absorption" at the 20-period EMA.
Function: Identifies zones where institutional buyers/sellers are defending the trend's equilibrium. This is not a simple touch; it requires a validated "Touch-and-Hold" sequence.
B. Structural Flip Scanner (BTB) —
Logic: Detects the transition from old supply to new demand (S/R Flip).
Function: Uses a 3-phase Break-Test-Break verification to confirm that a structural breakout is backed by volume, reducing the risk of "Fake-outs."
C. Liquidity Compression Monitor (Micro Map) —
Logic: Statistical range-contraction analysis (Volatility Squeeze).
Function: Signals a High-Density State where price is coiling for an expansion move.
2. The Golden State: Triple Confluence Logic
The GOLD label represents the "Apex" of this engine. It is triggered only when the SP2L, BTB, and Micro Map layers synchronize on a single candle. In structural terms, this means:
Trend Defense (SP2L) is active.
Structural Breakout (BTB) is confirmed.
Volatility Expansion (MM) is imminent.
This Triple-Layer filtering ensures that Golden Signals only appear during periods of maximum market conviction.
3. Professional Implementation (Structural View)
MTF Trend Matrix: A built-in dashboard provides a 1H, 4H, and 1D diagnosis to ensure local setups align with the Macro Trend.
Smart Invalidation (Adaptive Trendlines): The engine draws dynamic geometry to define the current "Structural Floor/Ceiling." A decisive close beyond these lines acts as a clear Invalidation Point for the current thesis.
Mean Reversion: The system uses the 200-EMA as the primary directional filter, defining whether the market is in a "Bullish Expansion" or "Bearish Correction" state.
⚠️ Risk Disclaimer
Trading financial instruments involves significant risk. Quant-Action Pro is an educational tool designed for research and structural analysis. It does not provide financial advice. Past performance is not indicative of future results. Always use strict risk management.

CUSUM Volatility BreakoutCUSUM Volatility Breakout A statistical trend-detection and volatility-breakout indicator that identifies subtle momentum shifts earlier than traditional tools.
OVERVIEW
The CUSUM control chart is a statistical tool designed to detect small, gradual shifts from a target value. In trading, it helps identify the early stages of a trend, giving traders a heads-up before momentum becomes obvious on standard price charts. By spotting these subtle movements, the CUSUM Volatility Breakout indicator (CUSUM VB) can highlight potential breakout opportunities earlier than traditional indicators. In other words, a statistical trend detection & breakout indicator.
Copyright © 2025 CoinOperator
HOW IT WORKS
CUSUM VB uses a combination of differenced price series, volume normalization, and dynamic control limits:
CUSUM Principle: Tracks cumulative deviations of price from a zero reference. Signals occur when cumulative deviations exceed a control limit shown on the chart and clears any enabled filters.
Adaptive Volatility: H adjusts automatically based on short- vs long-term ATR ratios, allowing faster detection during volatile periods and reduced false signals in calm markets.
Volume Weighting (optional): Amplifies price CUSUM values during high-volume bars to prioritize market participation strength.
ATR Confirmation (optional): Ensures breakouts are accompanied by expanded volatility.
Bollinger Band Squeeze Integration (optional): Confirms trend breakouts by detecting volatility contraction and release shown on the chart as triangles.
Signals:
Arrows on the price chart mark the bars where trades are actually filled, based on conditions detected on the prior signal bar.
Long Entry: Confirmed positive CUSUM breach (price & volume) with BB breakout (signal bar).
Short Entry: Confirmed negative CUSUM breach (price & volume) with BB breakout (signal bar).
Exit Signals: Triggered automatically by opposite-side signals.
Alerts, when created, fire on the bars where fills occur.
CHART COMPONENTS
CUSUM Upper Price (CU Price) and CUSUM Lower Price (CL Price) are green/red circles for confirmed signals.
● Rapid upward accumulation of CU Price indicates a developing bullish trend.
● Rapid downward accumulation of CL Price indicates a developing bearish trend.
Decision/Control limits (UCL/LCL, red)
Zero line (reference for the differenced price series baseline)
Optional BB triangles and volume CUSUM
SETUP AND CONFIGURATION
Differenced Price Series
Differenced Price Length and Lag
Increase differencing lag or window length → Increases variance of residuals → Wider control limits (UCL/LCL) → Slower to trigger.
Decrease lag or window → Tighter limits, more responsive to short-term regime shifts.
CUSUM Parameters
Volume-Weighted CUSUM
NOTE : Uses price length if 'Confirm Price with Volume' is disabled, otherwise will use volume length.
Amplifies CUSUM price responses during high-volume bars and reduces them during low-volume bars. This links trend detection to market participation strength.
Volume-Weighted CUSUM doesn’t replace price confirmation with volume; it modulates it by volume intensity, amplifying price signals when participation is strong and suppressing them when weak.
Recommended when analyzing assets with consistent volume patterns (e.g., stocks, major futures).
Disable for low-liquidity or irregular-volume instruments (e.g., crypto pairs, small-cap stocks).
ATR Confirmation
Enable this feature to confirm CUSUM signals only when price deviations are accompanied by higher-than-normal volatility. The indicator compares current ATR to a smoothed ATR to detect volatility expansion. This helps distinguish true breakouts from low-volatility noise and reduces false signals during quiet periods.
Adjust the ATR lookback length, smoothing length, and expansion factor to control sensitivity. Rule of thumb:
ATR Length ≈ 0.5 × differenced price length to 1.5 × differenced price length gives balanced sensitivity.
ATR Smoothing 5–10 bars.
ATR Expansion 5% to 50%.
CUSUM Input Mode
Select how CUSUM processes differenced price and log-normalized volume — either directly (Txfrm Data) or as deviations from a short-term EMA baseline (Residuals):
Txfrm Data = transformed input: differenced price & log-normalized volume as input for CUSUM (larger swings, more frequent control limit breaches)
Residuals = deviation from short-term EMA baseline (smaller swings, fewer control limit breaches, but higher signal quality).
Residual EMA Length: Defines how quickly the residual baseline adapts to recent differenced price moves. Shorter = more reactive; longer = smoother baseline. Keep EMA length moderate; over-smoothing can distort timing.
Control Sensitivity (K)
Increase K → Less sensitive → CUSUM accumulates slower → Fewer signals, captures only major trends.
Decrease K → More sensitive → CUSUM accumulates faster → More signals, captures minor swings too.
Reset Mode : Method of resetting CUSUM values.
Immediate Reset: Reset both immediately after any signal breach. Traditional SPC.
Opposite-Side Reset: Reset only the opposite side when a valid signal fires. Best for ongoing trend tracking.
Decay Reset: Gradually reduce CUSUM values toward zero with a decay factor each bar. Maintains trend memory but allows slow “forgetting.”
Threshold Reset: Reset only if CUSUM returns below a small threshold (10 % of H). Filters noise without full wipe.
No Reset / Continuous: Never reset; instead track running totals. Long-term cumulative bias measurement.
Conflict Handling : Method of handling conflicting signals.
Ignore Both: Discards both when overlap occurs.
Prioritize Latest: Chooses the direction implied by the most recent close.
Prioritize Stronger: Compares absolute magnitudes of CU Price vs CL Price.
Average Resolve: Looks at the difference; small overlap → ignore, otherwise pick direction by sign.
Sequential Confirm: Requires N consecutive same-direction signals before confirmation.
Volume Parameters (Optional)
Amplification Factor
Adjusts volume sensitivity and effectively rescales the log series of volume to a comparable magnitude with price changes.
Since price and volume are normalized in a compatible way, the amplification factor is used instead of independent K and H values for volume.
Bollinger Bands (Optional)
Lookback Synchronization
BB Lookback (for CUSUM): Number of bars that define a window for the BB signal to look back for the CUSUM signal.
CUSUM Lookback (for BB): Number of bars that define a window for the CUSUM signal to look back for the BB signal.
Both can be enabled for stricter alignment.
Relationship Between K, H, ARL₀ and ARL₁
H (max) is usually the only H you need to adjust. With everything else being constant, increasing either K or H (max) generally increases both ARL₀ and ARL₁ : higher thresholds reduce false alarms but slow detection, and lower thresholds do the opposite.
Increase Min Target ARL ratio →
ARL₀ increases (safer, fewer false alarms)
ARL₁ decreases or stays small (faster detection)
Control limits slightly expand to achieve separation
Strategy becomes more selective and stable
Decrease Min Target ARL ratio →
ARL₀ decreases (more false alarms tolerated)
ARL₁ increases (slower detection tolerated)
Control limits tighten
Strategy becomes more sensitive but lower quality
The ARL Ratio of ARL₀ / ARL₁ is typically between 3 and 8. This implies you want your ARL₀ (false-alarm interval) ≈ 'Min Target ARL ratio' × differenced price length window.
Example:
"Min Target ARL ratio = 4.0"
⇒ implies you want your ARL₀ (false-alarm interval) ≈ 4 × differenced price length.
Assume price length = 50 (typical differencing window).
ARL ratio = 4.0 → target ARL = 4 × 50 = 200 bars.
● On a 6-hour chart (≈4 bars/day) → ~50 days between expected false alarms (on average).
● On a daily chart → ~200 trading days between false alarms (very conservative).
ARL ratio = 8.0 → target ARL = 400 bars → twice as infrequent signals vs ratio=4.
ARL ratio = 2.0 → target ARL = 100 bars → about half the inter-signal interval.
Another way to think about it: probability of a false alarm on any bar ≈ 1 / target ARL. If you want ~1% of bars producing alarms, target ARL ≈ 100.
QUICK START
Start with the defaults.
Set price series → length/order/lag
Configure CUSUM thresholds → K, H min/max
1. Adjust the price differencing lag/window.
2. Verify that it captures real price inflection points without overreacting to bar noise.
Enable optional filters → Volume, ATR, BB
The optional Bollinger Bands squeeze usually works best if used with CUSUM Input Mode = Txfrm Data.
Monitor CUSUM chart → CU Price, CL Price, thresholds, zero line
Act on signals → data window / chart triangles
Adjust sensitivity → H (max), K, lengths
Monitor ARL ratio and CUSUM behavior for fine-tuning
Note : When you’ve finalized the length, lag, and order of the Price Difference, as well as the Ln(Vol) Series of “Confirm Price with Volume” if enabled, then pass both through the Augmented Dickey–Fuller (ADF) mean reversion test to ensure they are stationary, i.e., mean reverting. You can find a ready-made indicator for such use at . Many thanks to tbtkg for this indicator.
SUMMARY
CUSUM VB combines CUSUM statistical control, volatility-adaptive thresholds, volume weighting, and optional BB breakout confirmation to provide robust, actionable signals across a wide variety of trading instruments.
Why traders use it : Fast detection of shifts, reduced false alarms, versatile across markets.
Ideal for : Futures (continuous contracts), forex, crypto, stocks, ETFs, and commodity/index CFDs, especially where:
● Price and volume data exist
● Breakouts and volatility shifts are tradable
● There’s enough liquidity for meaningful signals
Visualization : Upper/lower CUSUM circles, UCL/LCL thresholds, optional highlight traded background, optional volume and BB overlays on the chart, optional entry/exit labels on the price chart, as well as entry/exit signals in the data window.
Alerts : For entry/exit labels when trades are actually filled.
CUSUM VB is designed for traders who want statistically grounded trend detection with configurable sensitivity, visual clarity, and multi-market versatility.
DISCLAIMER
This software and documentation are provided “as is” without any warranties of any kind, express or implied. CoinOperator assumes no responsibility or liability for any errors, omissions, or losses arising from the use or interpretation of this software or its outputs. Trading and investing carry inherent risks, and users are solely responsible for their own decisions and results.

Footprint.Pro [Elykia]OVERVIEW
The Footprint Pro is a comprehensive Order Flow and Footprint analysis tool designed to visualize buying and selling pressure inside each candlestick. Unlike standard charts that only show OHLC (Open, High, Low, Close), this script uses a proprietary Reconstruction Engine to reveal the internal volume distribution, allowing traders to see the interaction between aggressive buyers (Ask) and sellers (Bid) at every price level.
METHODOLOGY & DATA PRECISION
To achieve high-definition Order Flow without external data feeds, this script is designed to be applied on a 1-second (1s) chart timeframe .
Reconstruction Engine: It harvests granular 1-second data to mathematically reconstruct and draw Footprint candles for higher timeframes (from 1 Minute up to 15 Minutes).
Why 1-second? By processing 1-second intervals, the script captures the exact price levels where volume was traded with very high precision. This allows for the creation of accurate Volume Profiles and Delta calculations inside the candle, creating a granular view impossible to achieve with standard timeframe data.
CALCULATION MODES & STYLES
The script processes this data using distinct algorithms and visualization styles to adapt to different market conditions.
Timeframe Mode: Reconstructs standard time-based footprints (e.g., viewing M5 candles while remaining on the 1s chart).
Simulated Range Bars: Uses a custom volatility algorithm to ignore time and close bars based on pure price movement.
Why use Range Mode? Unlike time-based charts, Range bars filter out "noise" during low volatility (choppy markets) and clarify market structure, allowing traders to see pure price action and volume distribution without the distortion of time.
VISUALIZATION TOOLS: HISTOGRAM, HEATMAP & POC
Profile Style (Histogram): Instead of raw numbers, the script draws a volume profile inside the candle. This offers an instant visual reading to spot if volume is "heavy" at the bottom (support) or top (resistance).
Heatmap (Dynamic Coloring):
Function: The script dynamically adjusts the opacity (transparency) of each histogram bar based on Delta intensity relative to surrounding volumes. Levels with strong aggression appear opaque and vivid, while low activity zones remain transparent.
Trader Benefit: This creates an immediate visual hierarchy. The trader's eye automatically ignores noise to focus only on "Hot Spots" where the real battle between buyers and sellers is taking place.
POC (Point of Control): Indicates the exact price level where maximum volume was traded. Its position is crucial: a POC at the top of a wick indicates buyers were trapped (weakness/rejection).
Show Data (Dashboard): Displays real-time Total Volume, Delta, and candle size to qualify volatility (e.g., distinguishing an anecdotal move from a real institutional impulse).
MAJOR SYNERGY: MULTI-TIMEFRAME SMT & FOOTPRINT
The script integrates an SMT (Smart Money Technique) engine that works in synergy with the Footprint to offer a comprehensive "Macro & Micro" approach.
1. The SMT Engine (The Structural Alert)
The module performs a background scan on 4 distinct timeframes simultaneously (e.g., 30s, 1m, 2m, 5m).
Logic: It continuously compares the Pivots (Highs/Lows) of the current asset against a correlated comparison asset (e.g., NQ vs ES or EURUSD vs DXY).
Signal: If Asset A makes a Higher High while Asset B makes a Lower High on ANY of the 4 monitored timeframes, a specific divergence label is plotted.
Interest: It is an early warning signal indicating an institutional intention of reversal or exhaustion, often before price visibly turns.
2. Interaction with Footprint (The Confirmation)
An SMT divergence alone can be early. Combining it with Footprint offers surgical timing:
Context: SMT warns that correlations are breaking and the move is running out of steam.
Trigger: The trader then waits for the Footprint to display a Rejection Setup or Absorption at this SMT level.
Result: This avoids entering too early and confirms that real orders (Micro-structure) validate the structural thesis (Macro).
SMART ASSISTANT: REAL-TIME CONTEXT
To assist traders, a logic engine analyzes the last 5-10 reconstructed candles to detect actor psychology:
Liquidity Sweeps (Turtle Soup):
Function: Price breaks a recent high/low to trigger stops, then immediately reintegrates.
Trader Benefit: Allows identification of false breakouts and taking the counter-party (Reversal) with an excellent risk/reward ratio, once liquidity is captured.
Absorption (Iceberg Orders):
Function: Massive volume traded without price progression (Strong Delta but small candle).
Trader Benefit: Signals a "Wall" of passive limit orders. The trader knows not to bet against this wall (protection) or can enter in the direction of the defense.
Traps (Delta Divergence):
Function: Divergence between candle color and its Delta (e.g., Red Candle with massive Green Delta).
Trader Benefit: Indicates aggressive participants are "trapped" (underwater). The trader profits from their pain (Pain Trade) when these trapped traders have to liquidate positions.
THE 6 ALGORITHMIC SETUPS (TRIANGLES & MARKERS)
The script monitors every tick to generate 6 specific signals, reducing trader mental fatigue:
Setup 1: Rejection (Validated Rejection)
Signal: Large wick + Delta confirming rejection.
Interest: Filters profit-taking to keep only real counter-trend aggression.
Setup 2: Exhaustion
Signal: Sharp volume drop at high/low + POC at extreme.
Interest: Indicates end of a healthy trend (no one left to push price).
Setup 3: Failed Aggression
Signal: Explosive volume (>2x avg) but price stalls.
Interest: Sign of institutional hand blocking the market (Absorption). Powerful reversal signal.
Setup 4: Trap
Signal: Strict divergence between candle color and cumulative Delta.
Interest: Exploiting the "Squeeze" of trapped traders.
Setup 5: Stacked Imbalances (The Wall)
Signal: 3 consecutive price levels with buy/sell imbalance > 300%.
Interest: Materializes a very strong Support/Resistance zone (displayed by a box). If price tests this zone again, it's a high-probability bounce opportunity.
Setup 6: Absorption Pattern (Zero Prints / Block)
Signal: Presence of "Zeros" in footprint (lack of liquidity) vs large volume (block).
Interest: Fine microstructure detection often indicating immediate stop of current move.
VWAP INTEGRATION & COMBINED STRATEGY
The script calculates and plots an anchored VWAP (Volume Weighted Average Price), based on the reconstructed data.
Interest of VWAP (The "Fair Value"): The VWAP is the absolute reference for institutional algorithms. It represents the average price paid by all participants during the session. If price is above, the trend is bullish (buyers in control); below, it is bearish. It often acts as an invisible dynamic support/resistance.
VWAP + Footprint Interaction (Context + Trigger): The VWAP provides the level of intervention and the Footprint provides the confirmation via volume.
Instead of trading every Footprint signal randomly, the trader uses VWAP as a probability filter:
1. In uptrend: Ignore sell signals. Wait for price to pull back to VWAP.
2. Confirmation: At that precise moment, look at the Footprint.
Concrete Trade Example (The "Defensive Bounce"):
Scenario: Price is in uptrend and corrects to touch the VWAP line.
What Footprint must show: Look for an Absorption or Failed Aggression Setup. For example, aggressive sellers attack the VWAP (very negative Delta, big red volume), but price refuses to close below VWAP (rejection wick or green candle).
The Order: This is the signal that institutions are defending their average price (passive buy limits absorbing sells). The trader buys with a short stop below the absorption wick, aligning with "Big Players".
AUTHOR'S INSTRUCTIONS
IMPORTANT: CONFIGURATION REQUIRED
This script uses a granular reconstruction engine. To work correctly, you MUST set your chart timeframe to 1 second (1s) .
Step-by-Step Setup:
Open your chart and select the 1-second (1s) timeframe.
Hide the original candles: Right-click on the chart, Settings, Symbol, uncheck the "Body", "Borders", and "Wick". This removes the clutter of the 1s bars so you can see the reconstructed Footprint clearly.
Add the indicator to the chart.
The script loads with a default 1-minute configuration. You can change to Range Bars or other timeframes in the Settings.
DISCLAIMER
This tool is for informational and educational purposes only. It does not constitute financial advice or a signal service. Past performance of the detected patterns (SMT, Imbalances...) does not guarantee future results. Trading involves a high level of risk.
ACCESS
This is an invite-only script. To obtain access, please use the link provided in the Signature field below.

Fresh Order Blocks v1.4.1Multi Timeframe Fresh Order Blocks v1.4.1 with settings
by Mahdi BML | Cryptomentor | mahdibml.com

V-Max L1: Strategic Horizon & Trend NavigatorV-Max L1: Strategic Horizon & Trend Navigator
Overview The Strategic Horizon & Trend Navigator (V-Max L1) is a comprehensive trend-following system designed to synthesize macro market inertia with localized momentum. It serves as a visual navigation tool, filtering out high-frequency noise to identify high-probability trend regimes and structural shifts.
Core Technical Logic This script integrates several multi-layered components to provide a unified trend-analysis framework, justifying its invite-only access:
Institutional Trend Boundary: The system utilizes an integrated Vegas Tunnel logic (200/233 EMA) as the core structural filter. This defines the institutional trend bias, effectively distinguishing between bullish and bearish market regimes.
Proprietary Momentum Integration: A multi-length RSI algorithm is employed to detect momentum extremes. The logic calculates exhaustion and acceleration phases, visualized through specific color-coded status signals (Yellow/Pink) to highlight potential overextended conditions.
Volume-Price Ignition Engine: The script monitors for volume-price divergence, specifically flagging "Ignition Candles" where the relative volume exceeds 1.5x the rolling average. This identifies areas of high institutional activity and potential trend initiation.
Signal Stabilization (MTF Logic): To minimize signal flickering on lower timeframes, the script incorporates MTF (Multi-Timeframe) confirmation protocols. This ensures that localized signals are only validated when they align with higher-order structural shifts.
How to Use
Background Trend Bias: Visualizes the macro regime. Neutral/Gray backgrounds indicate a bullish structural bias, while Dark Red highlights bearish dominance.
Launch & Momentum Signals: "Long/Short" labels appear when short-term moving average dynamics synchronize with specific RSI momentum thresholds.
Top/Bottom Reversal Markers: Based on long-cycle RSI extremes, these markers help identify potential cyclical exhaustion for strategic profit-taking or reversal preparation.
產品概述 V-Max L1 戰略地圖是一款綜合性趨勢導航系統,旨在將宏觀市場慣性與局部動能相結合。它作為一種視覺化導航工具,能有效過濾高頻雜訊,幫助交易者識別高勝率的趨勢狀態與結構性轉變。
核心技術邏輯 本腳本整合了多個層次的研究組件,形成統一的趨勢分析框架:
機構級趨勢分水嶺: 系統整合了維加斯通道 (200/233 EMA) 邏輯作為核心結構濾網。這定義了機構級的趨勢偏好,有效區分多頭與空頭的結構性狀態。
專有動能整合: 採用多長度 RSI 算法檢測動能極限。該邏輯計算動能的疲勞與加速階段,透過顏色訊號(黃燈/粉燈)標註潛在的過熱狀態。
量價點火引擎: 腳本監控量價背離,特別標註相對成交量超過 1.5 倍滾動平均值的「點火 K 線」。這有助於識別高強度的機構參與及趨勢啟動區域。
訊號平滑處理 (MTF 邏輯): 為減少低時區的訊號閃爍,腳本整合了多時區 (MTF) 確認協議,確保局部訊號與高階結構位階保持一致。
Access & Authorization This is an Invite-Only script. Please refer to my TradingView Profile Signature for instructions on how to request access and authorization.
Disclaimer: This script is for technical analysis and educational purposes only. Trading involves risk.

Liquidity Sweeps [Kodexius]Liquidity Sweeps is a price action indicator built to visualize and react to common “stop run” behavior around recent swing highs and swing lows. It continuously detects pivot-based liquidity levels (recent resistance and support), extends them forward in time, and then classifies the interaction when price probes beyond a level but fails to hold through it.
The script focuses on two outcomes:
Buy-Side Liquidity Sweep (BSL): price takes liquidity above a recent swing high (high breaks above the level) but closes back at or below the level.
Sell-Side Liquidity Sweep (SSL): price takes liquidity below a recent swing low (low breaks below the level) but closes back at or above the level.
To support real trading workflows, it keeps charts readable by limiting active levels, offers clean styling options, and optionally filters sweep signals using relative volume (RVOL) so you can require participation before a sweep is considered valid.
🔹 Features
🔸 Pivot-Based Liquidity Level Detection (Swing Highs and Swing Lows)
The indicator uses a user-defined Pivot Length to identify confirmed swing points:
Pivot Highs become resistance liquidity levels (buy-side liquidity above highs).
Pivot Lows become support liquidity levels (sell-side liquidity below lows).
Each detected level is drawn as a horizontal line and automatically extended to the current bar until it is swept or broken.
🔸 Automatic Level Management (De-Cluttering)
To prevent chart overload, the script stores levels in internal arrays and enforces Maximum Active Levels:
When new levels are added and the limit is exceeded, the oldest level is removed.
This keeps only the most relevant, recent liquidity zones visible.
🔸 Clear Sweep Classification (BSL and SSL)
The sweep logic is intentionally strict and practical:
- BSL Sweep triggers when the bar’s high is above resistance but the close is back below or at resistance.
- SSL Sweep triggers when the bar’s low is below support but the close is back above or at support.
This models the “probe and reject” behavior typical of liquidity grabs.
🔸 Optional Volume Confirmation Using RVOL
When Enable Volume Filter is turned on, sweeps are only valid if the current bar’s volume is strong relative to the last 20 bars:
The script computes a 20-period volume average.
You can require volume to exceed the average by a chosen Volume Multiplier (example: 1.5 means 150% of the average).
If the filter is disabled, sweeps are evaluated purely on price conditions.
🔸 Sweep Labels and Level Highlighting
On a valid sweep:
A label is printed on the sweep bar:
- ▼ BSL for buy-side liquidity sweeps (yellow)
- ▲ SSL for sell-side liquidity sweeps (blue)
The swept level is highlighted by drawing an additional colored line over the swept range.
The script also prints the bar’s RVOL percentage near the midpoint of the swept line segment:
- BSL volume text is placed above the line midpoint
- SSL volume text is placed below the line midpoint
This makes it easy to see whether a sweep was low-effort or supported by strong participation.
🔸 Styling Controls
You can fully tailor the visual output:
Resistance and support line colors
Line style selection: Solid, Dotted, Dashed
Toggle sweep labels on or off
🔸 Alerts
The indicator exposes alert conditions for both sweep types and also fires explicit alert messages once per bar close when a sweep is confirmed:
- Buy Liquidity Sweep (BSL)
- Sell Liquidity Sweep (SSL)
🔹 Calculations
1) Pivot High / Pivot Low Detection
float ph = ta.pivothigh(high, pivotPeriodInput, pivotPeriodInput)
float pl = ta.pivotlow(low, pivotPeriodInput, pivotPeriodInput)
Interpretation:
A pivot is only confirmed after pivotPeriodInput bars have passed.
Once confirmed, the level is anchored at the pivot bar and then extended forward.
2) Creating and Storing Liquidity Levels
New Resistance (Pivot High):
if not na(ph)
line newL = line.new(bar_index , ph, bar_index, ph,
color = resistanceColorInput, width = 1, style = getLineStyle(lineStyleInput))
resistanceLevels.push(LiquidityLevel.new(ph, bar_index , newL))
if resistanceLevels.size() > maxLinesInput
(resistanceLevels.shift()).delete()
New Support (Pivot Low):
if not na(pl)
line newL = line.new(bar_index , pl, bar_index, pl,
color = supportColorInput, width = 1, style = getLineStyle(lineStyleInput))
supportLevels.push(LiquidityLevel.new(pl, bar_index , newL))
if supportLevels.size() > maxLinesInput
(supportLevels.shift()).delete()
This enforces the “Maximum Active Levels” limit by deleting the oldest stored level when the cap is exceeded.
3) Relative Volume (RVOL) and Volume Filter
float volAvg = ta.sma(volume, 20)
float volRelative = (volume / volAvg) * 100
bool isVolStrong = not useVolFilterInput or (volume > volAvg * volMultiplierInput)
volRelative expresses the sweep bar’s volume as a percentage of the last 20-bar average.
If the filter is enabled, a sweep is valid only when isVolStrong is true.
4) Sweep Conditions (Core Logic)
Buy-Side Liquidity Sweep (Resistance Sweep)
A resistance level is considered swept when price trades above it but closes back at or below it.
bool priceSwept = high > lvl.price and close <= lvl.price
bool broken = close > lvl.price
priceSwept captures the “probe and reject” behavior.
broken invalidates the level if price closes above it.
The confirmation and cleanup flow:
if priceSwept and isVolStrong
buySweepOccurred := true
if showLabelsInput
label.new(bar_index, high, "▼ BSL",
style = label.style_label_down, color = #00000000,
textcolor = C_SWEEP_BUY, size = size.small)
line.new(lvl.startBar, lvl.price, bar_index, lvl.price, color = C_SWEEP_BUY, width = 1)
int midX = math.round((lvl.startBar + bar_index) / 2)
label.new(midX, lvl.price, str.tostring(volRelative, "#") + "% VOL",
color = #00000000, textcolor = color.new(C_SWEEP_BUY, 20),
style = label.style_label_down, size = size.tiny)
resistanceLevels.remove(i).delete()
else if broken
resistanceLevels.remove(i).delete()
Sell-Side Liquidity Sweep (Support Sweep)
A support level is considered swept when price trades below it but closes back at or above it.
bool priceSwept = low < lvl.price and close >= lvl.price
bool broken = close < lvl.price
The confirmation and cleanup flow:
if priceSwept and isVolStrong
sellSweepOccurred := true
if showLabelsInput
label.new(bar_index, low, "▲ SSL",
style = label.style_label_up, color = #00000000,
textcolor = C_SWEEP_SELL, size = size.small)
line.new(lvl.startBar, lvl.price, bar_index, lvl.price, color = C_SWEEP_SELL, width = 1)
int midX = math.round((lvl.startBar + bar_index) / 2)
label.new(midX, lvl.price, str.tostring(volRelative, "#") + "% VOL",
color = #00000000, textcolor = color.new(C_SWEEP_SELL, 20),
style = label.style_label_up, size = size.tiny)
supportLevels.remove(i).delete()
else if broken
supportLevels.remove(i).delete()
5) Level Extension to Current Bar
method update(LiquidityLevel this) =>
line.set_x2(this.lineObj, bar_index)
This keeps each active liquidity level extended to the current candle until it is swept or decisively broken.
6) Alerts
alertcondition(buySweepOccurred, "Buy Liquidity Sweep", "BSL Swept!")
alertcondition(sellSweepOccurred, "Sell Liquidity Sweep", "SSL Swept!")
if buySweepOccurred
alert("Kodexius BSL Sweep: " + str.tostring(close), alert.freq_once_per_bar_close)
if sellSweepOccurred
alert("Kodexius SSL Sweep: " + str.tostring(close), alert.freq_once_per_bar_close)

Market State Intelligence [Interakktive]Market State Intelligence (MSI) is a diagnostic market-context indicator that reveals how the market is behaving — not where price "should" go.
MSI does not generate buy/sell signals. Instead, it classifies market conditions into clear behavioural regimes by continuously measuring:
- DRIVE (directional effort)
- OPPOSITION (absorption / resistance)
- STABILITY (structural persistence)
MSI is designed to answer three practical questions:
- What state is the market in right now?
- Is energy building, releasing, or decaying?
- Is participation aligned with price, or opposing it?
█ WHAT MSI DOES
MSI operates as a real-time regime classification engine that processes each closed bar through three independent measurement systems:
DRIVE — Directional Effort (0–100)
- Displacement efficiency (net progress vs total path)
- Range expansion quality (actual range vs expected ATR range)
- Body dominance (body vs candle range)
OPPOSITION — Absorption / Resistance (0–100)
- Wick pressure (rejection relative to attempt)
- Effort–result gap (high effort, low progress)
- Reversal density (counter-moves frequency)
STABILITY — Persistence (0–100)
- Condition persistence (how long conditions hold)
- Variance score (flip frequency)
- Follow-through consistency (reaction continuity)
These three forces feed a deterministic classifier with hysteresis (anti-flicker) to identify five regimes:
COMPRESSION — low drive, low opposition, higher stability (pressure building, direction unclear)
EXPANSION — high drive, low opposition (directional energy release)
TREND — medium-high drive, higher stability, low-medium opposition (healthy continuation)
DISTRIBUTION — medium drive, high opposition (effort absorbed; progress blocked)
TRANSITION — rapidly rising opposition, low stability (regime breakdown / uncertainty)
█ WHAT MSI DOES NOT DO
- No buy/sell signals, entries/exits, or performance claims
- No prediction of future direction
- No repainting: calculations use closed-bar data only
MSI is a market state layer intended to support your execution framework.
█ VISUAL SYSTEM
MSI uses a layered visual grammar designed to remain readable on live charts:
Regime Ribbon
A thin horizontal band showing the current regime via colour. Ribbon opacity reflects regime confidence (stronger confidence = more visible).
Pressure Envelope (core visual)
A soft corridor around price that expands with Drive and becomes more visible as Opposition increases. This visualises "pressure thickness" around current action (not a volatility band for entries).
Structural Memory
Faint background stains appear where regimes previously failed (e.g., expansion collapsing into absorption). These are behavioural context zones showing where market intention was rejected — not support/resistance.
Regime Change Markers (optional)
Subtle labels appear when regimes transition after confirmation. Useful for replay and education.
Effort Halo (optional)
Candle highlighting when Opposition materially exceeds Drive, indicating absorption/inefficiency.
█ HUD PANEL
The HUD displays:
- Current regime name + colour indicator
- A context gate showing whether conditions are aligned with long-bias or short-bias context (not an entry/exit system)
█ REGIME LEGEND
When enabled, displays:
- A one-line definition of the current regime
- Live Drive / Opposition / Stability values for interpretation
█ TIME-TO-DECISION METER
A visual pressure gauge that tends to fill during Compression (energy building) and drain during Expansion (energy releasing). It is a state-tracking meter, not a timing tool.
█ SETTINGS
MSI — Settings
- Preset Mode: Scalper / Swing / Position
- Analysis Mode (Minimal): ON = subtle visuals, OFF = full intensity
- Regime Ribbon, Structural Memory, HUD Panel, Time-to-Decision Meter, Effort Halo
MSI — Visual Options
- Show Regime Changes: Labels when regime transitions occur
- Show Regime Legend: Definition and live values display
- Panel Position: Move the entire panel anywhere on chart
MSI — Advanced (Tuning)
- Sensitivity (0.5–2.0)
- Smoothing (0.5–2.0)
- Memory Decay (0.5–2.0)
- Visual Intensity (Low / Medium / High)
█ PRESETS EXPLAINED
Scalper
Higher sensitivity + lower smoothing + faster memory decay. Best for 1m–15m monitoring.
Swing (default)
Balanced behaviour. Best for 15m–4H analysis.
Position
Lower sensitivity + higher smoothing + slower memory decay. Best for 4H–1D macro context.
█ STRUCTURAL MEMORY
When a regime fails (example: Expansion → Distribution), MSI creates a memory imprint:
- Fixed stain window (preset dependent)
- Strength decays over time
- Limited to a maximum number of imprints to reduce chart clutter
These zones represent behavioural rejection, not levels.
█ SUITABLE MARKETS
MSI is designed for Forex, Crypto, Indices, Stocks, and Commodities.
Works from intraday to Daily, with particularly strong readability on 15m–4H.
█ DISCLAIMER
This indicator is for educational and informational purposes only. It does not constitute financial advice, trading recommendations, or solicitation. Trading involves substantial risk. Always use proper risk management and make independent decisions.

Hybrid Smart Money Concepts [MarkitTick]💡This indicator provides a comprehensive technical analysis system that combines Market Structure concepts (Smart Money Concepts) with advanced Gap Analysis and a statistical Stress Model. It is designed to help traders identify trend direction, structural pivot points, potential reversal zones (Order Blocks), significant price gaps, and moments of market exhaustion.
Unlike standard ZigZag or Fractal indicators, this script integrates volume, trend maturity, and statistical volatility (Z-Score) to contextually classify price action. By overlaying these elements with a robust Market Structure engine—which identifies Change of Character (CHoCH) and Order Blocks—the tool provides a confluent view of price action.
It automates the detection of institutional footprints, allowing traders to see the structural trend, momentum drivers, and potential exhaustion points simultaneously.
● METHODOLOGY
The script operates on three distinct but complementary logic engines:
• Gap Analysis Engine
This module detects gaps between the previous high/low and the current open. It classifies them into three specific types based on volume and structural context:
Breakaway Gaps: Identified when a gap creates a breakout above a recent Pivot High or below a Pivot Low. This signals the start of a potential new trend.
Exhaustion Gaps: Identified when a gap occurs with high relative volume and meets the Trend Maturity criteria. This often signals the end of a trend.
Runaway Gaps: Standard continuation gaps that occur within a trend.
• Market Structure Engine
Swings and CHoCH: The script uses a left-and-right bar lookback to identify Pivot Highs and Lows. A Change of Character (CHoCH) is plotted when price closes beyond the most recent major pivot.
Order Blocks (OB): Upon a continuation of the trend, the script scans backward to find the extreme candle (the origin of the move) and highlights this zone as an Order Block.
Dynamic Cleanup: Gaps and Order Blocks are automatically removed (mitigated) when price aggressively crosses through their levels.
• Exhaustion & Stress Model
This statistical engine measures market "Stress" by analyzing the impact of price range relative to volume (True Range / Volume).
Calculation: It calculates a Z-Score (Standard Deviation) of this impact.
Logic: When the Z-Score exceeds a specific threshold (Sigma), it indicates a statistical anomaly or "Stress."
Signal: If high stress occurs while price is significantly above the trend baseline, it signals "Buyer Exhaustion." Conversely, high stress below the baseline signals "Seller Exhaustion."
● VISUALS & LEGEND
Before trading, you need to know what the indicator is drawing on your chart:
• Change of Character (CHoCH)
Green Dashed Line: Indicates a Bullish reversal.
Red Dashed Line: Indicates a Bearish reversal.
• Order Blocks (OB)
Green Boxes: Bullish support zones (Buy interest).
Red Boxes: Bearish resistance zones (Sell interest).
Note: Invalidated boxes are automatically deleted.
• Gaps
Blue Box (Breakaway): Strong momentum gap starting a new trend.
Orange Box (Runaway): Continuation gap.
Red Box (Exhaustion): Warning signal; trend may be ending.
• Stress Model Signals
Label "BE" (Red): Buyer Exhaustion. Suggests the bullish move is overextended relative to volume participation.
Label "SE" (Green): Seller Exhaustion. Suggests the bearish move is overextended.
● TRADING STRATEGY
You can use a "Pullback, Continuation & Exhaustion" strategy with this indicator.
• Scenario A: Long Setup (Buying)
Trend Change: Look for a CHoCH label with a Green Dashed Line.
Entry Zone: Look for a Green Order Block (OB) to form.
Confirmation: A Breakaway Gap (Blue) validates the breakout.
Entry: Enter Long when price pulls back into the Green OB.
Exit Warning: If a "BE" (Buyer Exhaustion) label appears, consider tightening stops or taking profit.
• Scenario B: Short Setup (Selling)
Trend Change: Look for a CHoCH label with a Red Dashed Line.
Entry Zone: Look for a Red Order Block (OB) to form.
Confirmation: A Breakaway Gap downwards validates the move.
Entry: Enter Short when price rallies back into the Red OB.
Exit Warning: If an "SE" (Seller Exhaustion) label appears, consider tightening stops or taking profit.
● SETTINGS
• Date Range Filter
Use Date Filter: Toggle time-based filtering.
Start Date: Timestamp to begin calculations.
• Gap Analysis
Min Gap Size: Minimum points required to register a gap.
Logic Inputs: Configures lookback periods and volume multipliers for gap classification.
Visuals: Customize colors for Breakaway, Runaway, and Exhaustion gaps.
• Market Structure
Swing Detection Length: Lookback period for pivot points.
Show CHoCH: Toggle for Change of Character labels.
Show Order Blocks: Toggle for OB boxes.
• Exhaustion & Stress Model
Trend Filter Length: Baseline length for determining trend direction (EMA).
Statistical Lookback: Length for the Z-Score calculation.
Stress Threshold (Sigma): The standard deviation requirement to trigger an exhaustion signal (Default: 2.0).
● DISCLAIMER
All provided scripts and indicators are strictly for educational exploration and must not be interpreted as financial advice or a recommendation to execute trades. I expressly disclaim all liability for any financial losses or damages that may result, directly or indirectly, from the reliance on or application of these tools. Market participation carries inherent risk where past performance never guarantees future returns, leaving all investment decisions and due diligence solely at your own discretion.

[uPaSKaL] Adaptive Swing StructureOverview :
Adaptive Swing Structure identifies and labels swing structure using HH / HL / LH / LL and can optionally draw wave connectors between successive swing points.
The goal is to provide a clean, practical view of market structure that remains readable across different market conditions.
Instead of relying only on a classic fixed-window pivot scan (left/right bars), this indicator uses an adaptive swing-detection approach designed to better match how traders visually interpret legs and structure.
Why this approach (vs. a simple pivot scan)?
Classic pivot scans (e.g., “pivot high/low with left/right bars”) are simple and widely used, but they often have practical limitations:
They depend heavily on a fixed window size (too sensitive in chop, too slow in trends)
They can mark pivots that are locally valid but not always representative of the broader leg
They may produce frequent structure changes during ranges, reducing readability
What you get with this indicator
A more stable swing structure view that adapts to price movement
Cleaner HH / HL / LH / LL labeling for context and decision-making
Optional wave connectors to visually follow the swing path
Visual comparison:
The screenshots below illustrate the difference in how structure can appear when using a classic pivot scan versus Adaptive Swing Structure.
Classic Pivot Points (High / Low):
Adaptive Swing Structure (This Indicator):
How to read the labels
This indicator labels swing structure using the standard notation:
HH = Higher High
HL = Higher Low
LH = Lower High
LL = Lower Low
How to interpret Wave Lines
When enabled, wave lines connect successive swing points to help you visually track the current swing path and structural transitions.
Inputs guide
Tracer Line Len
Main sensitivity control. Adjust this to fit the instrument and timeframe.
Higher values → fewer swing points, smoother structure (macro view)
Lower values → more swing points, more detail (micro view)
Show Wick (High / Low) Line
Shows the wick-based tracer (visual reference).
More sensitive to extremes and wick behavior
Useful when wicks matter (liquidity spikes / stop-runs)
Show Body (Open / Close) Line
Shows the body-based tracer (visual reference).
Filters wick noise and often looks smoother
Useful when you prefer structure based on candle bodies
Show Slope Flip Labels
Shows small markers that highlight swing turning moments (study/verification).
Helpful for understanding where structure updates
Optional and can be disabled for a cleaner chart
Wave Labels (WICK)
Shows HH/HL/LH/LL labels using wick-based swings.
More responsive to wick extremes
Wave Lines (WICK)
Connects wick-based swing points with wave lines.
Improves visual continuity of swings
Wave Labels (BODY)
Shows HH/HL/LH/LL labels using body-based swings.
Typically smoother and less sensitive to wick spikes
Wave Lines (BODY)
Connects body-based swing points with wave lines.
Cleaner wave path for body-based structure
Max Wave Labels Kept (per Wick / Body)
Limits the number of labels kept on the chart (older ones are removed first).
Reduces clutter
Helps maintain performance
Max Wave Lines Kept (per Wick / Body)
Limits the number of wave lines kept on the chart (older ones are removed first).
Keeps the chart readable
Helps maintain performance
History Window (map size / scan clamp)
Performance / stability control for how much recent history is considered.
Higher values → more history considered, higher CPU usage
Lower values → lighter execution, structure limited to more recent swings
Usage / Tuning
1) Find “your number” for each market
There is no universal best setting. The optimal Tracer Line Len depends on:
Instrument volatility
Your trading timeframe
Whether you want micro structure or macro structure
2) Build a simple baseline
Choose your chart timeframe (e.g., 4H).
Start with a moderate Len (e.g., 10–30).
Increase or decrease Len until the swing structure matches how you would manually map it.
3) Practical “timeframe scaling” intuition
You can use Len to “zoom out” or “zoom in” structure without changing your chart timeframe.
Example on 4H :
If Len = 20 produces the swing structure you want for 4H decisions, keep it as your baseline.
If you increase it to something like Len = 120 , the structure becomes much smoother and swing points appear less frequently.
This means:
4H with a smaller Len → focuses on 4H-level swings (more detail).
4H with a much larger Len → filters many local swings and highlights broader legs (more “higher-timeframe-like” context).
This is not a strict mathematical replacement for switching timeframes, but it is a practical and effective way to compress or expand structure density on the same chart.
4) Wick vs Body (which one to choose?)
WICK : Choose when extreme wicks matter to your reading of structure.
BODY : Choose when you want smoother structure and less sensitivity to wick spikes.
5) Suggested workflow for active traders
Use one preset for local structure (entries / short-term decisions).
Use a second preset with a larger Len for higher-level context (major swings / directional bias).

Price Action ICT SMC - Crypto Lidya (Lite)Price Action • ICT • SMC — Crypto Lidya (Lite)
Short title: PA Lite — Crypto Lidya
ONE CHART. ONE FLOW. TEXTBOOK PA + ICT + SMC.
This is not “more drawings”. It’s a structured, rule-based framework that merges:
Market Structure + Liquidity + Confirmation → into a single decision flow.
Core textbook sequence:
Liquidity → (IDM) → Displacement → CHoCH / BOS → Return to PD / OB / FVG / BPR
Built for traders who want clean context, multi-timeframe discipline, and professional-grade confluence
without turning the chart into a mess.
━━━━━━━━━━━━━━━━━━━━━━━━━━━━━━━━━━━━━━━━━━━
WHAT YOU GET (HIGHLIGHTS)
━━━━━━━━━━━━━━━━━━━━━━━━━━━━━━━━━━━━━━━━━━━
- Market Structure engine: CHoCH + BOS with configurable confirmation logic
- Liquidity context: EQH/EQL sweeps + deterministic “linking” to structure breaks
- HTF Bias (Regime Filter): optional direction gating for cleaner, textbook alignment
- TF Bias Table (Multi-TF dashboard): “at-a-glance” bias stacking with reasons
- PD Range (Premium/Discount): dealing-range alignment filter (OB / FVG or both)
- Displacement filter: impulse-quality confirmation (Body% / ATR / Close-position)
- Killzones / Sessions: time-window validation (London / NY AM / NY PM)
- FVG + BPR: imbalance mapping + balanced range overlap logic
- OB / BB engine: source models, refinement, quality filters, strength scoring, overlap pruning
- Alerts + Webhook-ready output: Human / JSON format, HTF gate, cooldown controls
“Structure + Liquidity + Confirmation in one workflow (no clutter).”
━━━━━━━━━━━━━━━━━━━━━━━━━━━━━━━━━━━━━━━━━━━
QUICK START (RECOMMENDED FLOW)
━━━━━━━━━━━━━━━━━━━━━━━━━━━━━━━━━━━━━━━━━━━
1) Performance
- Set Lookback Window (bars) to match your chart speed/history needs.
- View when “Lookback Window (bars)” is increased (with “Limit to Nearest” OFF / all zones visible).
- View when “Lookback Window (bars)” is decreased (with “Limit to Nearest” OFF / all zones visible).
2) Regime & Multi-TF Context (ICT)
- Enable HTF Bias if you want direction filtering.
- Use TF Bias Table to verify alignment across your chosen timeframes.
3) Timing Filter (Optional)
- Enable Killzones / Sessions to focus on high-liquidity delivery windows.
4) Confirmation Quality
- Enable Displacement filter to reduce range noise / weak breaks.
5) Structure Execution (SMC)
- Use CHoCH / BOS for the “break confirmation” layer.
- Use Buffers / Confirm Modes for stricter or faster validation.
6) Zones & Returns
- Use PD Range to validate where setups “should” form (Premium/Discount).
- Map FVG / BPR and OB / BB for return-to-zone models.
━━━━━━━━━━━━━━━━━━━━━━━━━━━━━━━━━━━━━━━━━━━
MODULES (TEXTBOOK EXPLANATION)
━━━━━━━━━━━━━━━━━━━━━━━━━━━━━━━━━━━━━━━━━━━
1) HTF BIAS (REGIME FILTER)
HTF Bias acts as your directional framework (macro context).
When enabled, signals can be suppressed if they conflict with the HTF direction.
Two professional ways to define bias (you choose via Trend Mode):
A) Swing Structure Bias (HH/HL – LH/LL) — “stable”
- Uptrend requires HH + HL confirmation
- Downtrend requires LL + LH confirmation
- Best when you want fewer, higher-quality flips
B) Legacy / Break of Extreme — “faster”
- Bias can flip as soon as a new pivot breaks the last major extreme
- Best for aggressive / fast markets (but can be noisier)
2) TF BIAS TABLE (MULTI-TIMEFRAME DASHBOARD)
The TF Bias Table is built for disciplined multi-timeframe execution:
- Answers “Are higher TFs aligned?” in seconds
- Helps you avoid taking LTF triggers against HTF context
- Can show reasoning text (optional) to keep the logic transparent
Bias calculation options (Table Bias Mode):
- Swing Structure Bias (HH/HL – LH/LL): more stable, flips later
- Structure-Scope Bias (msStructScope aligned): follows your chosen structure scope and flips faster
Hybrid rule is deterministic:
External dominates; if External is not ready, fallback to Internal.
Provisional Bias (UI only, optional):
- If pivots are not fully confirmed, the table can display a provisional bias based on HTF candle direction
- UI only (does not change signals)
3) PD RANGE (PREMIUM / DISCOUNT)
PD Range defines where price is “dealing” relative to its midpoint (50%):
- Bullish context → Discount is preferred
- Bearish context → Premium is preferred
You can apply PD filtering to:
- OB + FVG (default), OB only, or FVG only
Optional strict mode:
- Require the level/zone to remain fully inside the dealing range (more textbook)
“Discount buys / Premium sells with a clear dealing range reference.”
4) DISPLACEMENT (IMPULSE CONFIRMATION)
Displacement filter keeps breaks “honest”.
CHoCH/BOS confirms only if the break candle shows real intent:
- Body dominance (Body% rule)
- Volatility expansion (ATR multiple rule)
- Close position in break direction (optional strictness)
This is designed to reduce fake breaks in ranges and thin-liquidity periods.
“Impulse-quality break passes; weak range poke fails.”
5) KILLZONES / SESSIONS (TIME-WINDOW VALIDATION)
Session gating is a professional timing filter:
- Validate structure breaks/sweeps only inside enabled windows
- Focus execution during high-liquidity delivery hours (London / NY AM / NY PM)
“Cleaner signals when you trade only the active delivery windows.”
- Normal vs Killzone:
6) MARKET STRUCTURE (CHoCH / BOS)
CHoCH (Change of Character):
- Signals a character shift by breaking a key protected point (optionally)
BOS (Break of Structure):
- Confirms continuation breaks in the current structure direction
Confirmation controls:
- Close / Wick / Body / combined modes
- Optional buffers (Ticks or Percent) to reduce micro-noise
Optional Protected Swing Mode:
- Uses protected HL/LH as reference (closer to classic SMC)
7) LIQUIDITY (EQH/EQL SWEEPS + LINKING)
Liquidity sweeps identify stop-runs / grabs around equal highs/lows:
- Wick Only: faster tagging
- Wick + Close Back: more textbook (grab + rejection)
Link Window (bars) ties a sweep to the next CHoCH/BOS:
- Smaller window = stricter context
- Larger window = more permissive linking
8) FVG + BPR (IMBALANCE & REBALANCE)
FVG (Fair Value Gap):
- Shows active imbalances and mitigation behavior
- Optional size filter (Percent / ATR / Ticks / Absolute)
BPR (Balanced Price Range):
- Overlap zone formed by Bull FVG + Bear FVG
- Used as a confluence zone for rebalance and continuation models
9) OB / BB (ZONES)
Order Blocks (OB):
- Anchored to BOS/CHoCH breaks or derived from displacement candles (source mode)
- Refinement modes: Body / Wick / Mean Threshold
- Optional quality filter (Balanced / Strict, etc.)
- Strength scoring + confluence bonuses (FVG overlap, liquidity context)
- Overlap pruning keeps the chart clean and relevant
Breaker Blocks (BB):
- Derived from invalidated OBs
- Can show inherited strength % (optional)
- Cleanup options preserve performance without deleting open zones
10) ALERTS (REALTIME / WEBHOOK)
- Enable Alerts: master switch
- Choose Human or JSON message format
- Optional gates: HTF Bias alignment, cooldown (anti-spam)
TradingView setup tip:
Use alert condition = “Any alert() function call” for full detail messages.
━━━━━━━━━━━━━━━━━━━━━━━━━━━━━━━━━━━━━━━━━━━
LITE / COMMUNITY ROADMAP (IMPORTANT)
━━━━━━━━━━━━━━━━━━━━━━━━━━━━━━━━━━━━━━━━━━━
This is the free Lite / Community release.
To keep this project sustainable and continue improving it for the community:
- This Lite edition is planned to become limited to 3 symbols in a future update (e.g., BTC / ETH / SOL).
- The full, unrestricted version (all symbols + advanced upgrades) will be released separately as the PRO edition.
You’ll always see clear release notes before major changes.
━━━━━━━━━━━━━━━━━━━━━━━━━━━━━━━━━━━━━━━━━━━
DISCLAIMERS
━━━━━━━━━━━━━━━━━━━━━━━━━━━━━━━━━━━━━━━━━━━
- Educational / analytical tool only. Not financial advice.
- No guarantees. Always manage risk.
- “ICT / SMC” terminology is used as a category reference to commonly known concepts.
This script is not affiliated with any third-party educator or brand.

Gann Odd-Number Levels (Raw Scale)Gann Odd‑Number Levels (Raw Scale)
A clean, purpose‑built pane that visualizes Gann’s odd‑number sequence (1, 5, 9, 17, 25, 37, 49, 65, 81…) on its native scale, while syncing to price via an adaptive anchor. The result: raw Gann structure is easy to read, and you can quickly see how price reacts around each level.
Key features
Raw Gann scale in its own pane (no distortion from price scale)
Pan/zoom aware anchoring via Visible Range or Follow Price
Center level toggle to show the exact midpoint Gann
Readable labels like G17(4) with optional price mapping
Fine UX control for line widths, opacity, colors, label size & offset
Label format
G17(4) = Gann integer 17, sequence index/root 4
Optional | price lets you see the mapped price level
How to use
Default mode tracks price so you always see the nearest Gann structure.
Switch to Visible Range to analyze structure based on what’s on screen.
Increase label offset if you stack multiple indicators.
If you find it useful, leave a like and let me know what you’d like to see next!
Inducement [Kodexius]Inducement is a market structure overlay indicator designed to help you contextualize liquidity driven pullbacks inside an established structural trend. Rather than treating every sweep or wick as equal, it frames “inducement” as a selective event that tends to appear after structure has shifted and price is engineering a retracement to attract late participants, clear nearby liquidity, and create fuel for continuation.
At a high level, the script separates price action into two layers:
External (macro) structure to define meaningful swing points and detect structural shifts (Break of Structure).
Internal (micro) structure to locate the more subtle swing levels that are commonly targeted during retracements.
Once a valid structural break establishes directional context, the indicator looks for a characteristic internal level raid that occurs without invalidating the broader structure (i.e., structure remains “protected”). When that raid is followed by evidence of intent/continuation (displacement style behavior), the event is marked as an inducement and plotted directly on the chart.
The result is a clean, rules based way to highlight high probability “pullback bait” zones helping you distinguish between random noise and a retracement that is more consistent with structured continuation behavior.
🔹 Features
🔸 Dual Layer Swing Engine (Internal vs External)
Internal and external swing detection work together to separate micro structure from macro structure. Internal swings capture nearer term pivot behavior, while external swings define the larger structural framework. Sensitivity can be tuned through swing length inputs, and historical depth can be managed to keep the chart clean and performance stable.
🔸 Break of Structure (BOS) Context Filter
BOS acts as a context gate that defines the active directional regime. Rather than generating signals in isolation, inducement evaluation is tied to structural context, enabling cleaner interpretation of “what matters now” versus what is simply historical noise.
🔸 Structure Protection (Invalidation Awareness)
A key differentiator is the emphasis on structure staying intact. Inducement candidates are only considered while the relevant macro framework remains protected. This helps filter out pullback like events that are actually part of a reversal or breakdown sequence, keeping attention aligned with continuation friendly conditions.
🔸 Inducement Detection With Optional Sweep Strictness
Inducements are derived from internal levels that form around post break retracement behavior levels that are commonly “targeted” during pullbacks. You can choose a stricter interpretation (e.g., close confirmation) for stronger validation, or a more permissive interpretation if you prefer to capture wick based raids while still requiring follow through behavior.
🔸 Intent / Displacement Confirmation (Volatility Aware)
To reduce false positives from shallow noise, the script incorporates a volatility aware confirmation layer. This helps ensure the marked event is not just a minor sweep, but is followed by behavior more consistent with directional commitment improving selectivity across different assets and market conditions.
🔸 Clean On Chart Visualization (BOS + IDM Levels)
The overlay is designed to be readable and practical: BOS levels are presented clearly, and inducements are marked with distinct level styling and labeling (bullish vs bearish). The visual output aims to support fast decision making without overwhelming the chart.
Bullish IDM:
Bearish IDM:
🔸 Chart Hygiene Controls (Limit Visible History)
You can limit how many historical inducements remain visible to prevent clutter especially helpful on lower timeframes or long sessions. This keeps focus on the most relevant, recent structural narrative.
🔸 Designed for Confluence Based Trading Workflows
This indicator is best used as a context + trigger assistant, not a standalone entry system. It integrates naturally with higher timeframe bias, session logic, supply/demand mapping, execution models, and risk planning providing structure aligned pullback references you can combine with your own confirmations.

SMC Post-Analysis Lab [PhenLabs]📊 SMC Post-Analysis Lab
Version: PineScript™ v6
📌 Description
The SMC Post-Analysis Lab is a dedicated hindsight analysis tool built for traders who want to understand what really happened during any historical trading period. Unlike forward-looking indicators, this tool lets you scroll back through time and instantly receive algorithmic classification of market states using Smart Money Concepts methodology.
Whether you’re reviewing a losing trade, studying a successful session, or building your pattern recognition skills, this indicator provides immediate context. The expansion-aware algorithm processes price action within your selected window and outputs clear, actionable classifications ranging from Parabolic Expansion to Consolidation Inducements.
Stop relying on subjective post-trade analysis. Let the algorithm objectively tell you whether institutional players were accumulating, distributing, or running inducements during your trades.
🚀 Points of Innovation
First indicator specifically designed for SMC-based post-trade review rather than live signal generation
Dual-mode analysis system allowing both dynamic scrollback and precise date selection
Expansion-aware classification algorithm that weighs range position against net displacement
Real-time efficiency metrics calculating directional quality of price movement
Integrated visual FVG detection within the analysis window only
Interactive table with clickable date range adjustment via chart interface
🔧 Core Components
Pivot Detection Engine: Uses configurable pivot length to identify significant swing highs and lows for structure break detection
Window Calculator: Determines active analysis zone based on either bar offset or timestamp boundaries
Data Aggregator: Tracks window open, high, low, close and counts bullish/bearish structure break events
State Classification Algorithm: Applies hierarchical logic to determine market state from six possible classifications
Visual Renderer: Draws structure breaks, FVG boxes, and window highlighting within the active zone
🔥 Key Features
Sliding Window Mode: Use the Scroll Back slider to dynamically move your analysis zone backwards through history bar-by-bar
Date Range Mode: Select specific start and end timestamps for precise session or trade review
Six Market State Classifications: Parabolic Expansion (Bull/Bear), Bullish/Bearish Order Flow, Accumulation/Distribution Reversal, and Consolidation/Inducement
Range Position Percentile: See exactly where price closed relative to the window’s high-low range as a percentage
Bull/Bear Event Counter: Quantified count of structure breaks in each direction during the analysis period
Efficiency Calculation: Net move divided by total range reveals trending quality versus chop
🎨 Visualization
Blue Window Highlight: Active analysis zone is clearly marked with blue background shading on the chart
Structure Break Lines: Dashed lines appear at each bullish or bearish structure break within the window
FVG Boxes: Fair Value Gaps automatically render as semi-transparent boxes in bullish or bearish colors
Dashboard Table: Top-right positioned table displays State, Analysis description, and Metrics in real-time
Color-Coded States: Each classification uses distinct coloring for immediate visual recognition
Interactive Tip Row: Optional help text guides users on clicking the table to adjust date range
📖 Usage Guidelines
General Configuration
Analysis Mode: Default is Sliding Window. Choose Date Range for specific timestamp analysis.
Sliding Window Settings
Scroll Back (Bars): Default 0. Increase to move window backwards into history.
Window Width (Bars): Default 100. Range 20-50 for scalping, 100+ for swing analysis.
Date Range Settings
Start Date: Select the beginning timestamp for your analysis period.
End Date: Select the ending timestamp for your analysis period.
Visual Settings
Show Help Tip: Default true. Toggle to hide instructional row in dashboard.
Bullish Color: Default teal. Customize for bullish elements.
Bearish Color: Default red. Customize for bearish elements.
SMC Parameters
Pivot Length: Default 5. Lower values (3-5) catch minor breaks. Higher values (10+) focus on major swings.
✅ Best Use Cases
Post-trade review to understand why entries succeeded or failed
Session analysis to identify institutional activity patterns
Trade journaling with objective algorithmic classifications
Pattern recognition training through historical scrollback
Identifying whether stop hunts were inducements or legitimate breaks
Comparing your real-time read versus what the algorithm detected
⚠️ Limitations
Designed for historical analysis only, not live trade signals
Classification accuracy depends on appropriate pivot length for the timeframe
FVG detection uses simple gap logic without mitigation tracking
State classification is based on window data only, not broader context
Requires manual scrolling or date input to review different periods
💡 What Makes This Unique
Purpose-Built for Review: Unlike most indicators focused on live signals, this is designed specifically for post-trade analysis
Expansion-Aware Logic: Algorithm weighs both position in range AND directional efficiency for accurate state detection
Interactive Date Control: Click the dashboard table to reveal draggable anchors for window adjustment directly on chart
🔬 How It Works
1. Window Definition:
User selects either Sliding Window or Date Range mode
System calculates which bars fall within the active analysis zone
Active zone receives blue background highlighting
2. Data Collection:
Algorithm captures window open, running high, running low, and current close
Structure breaks are detected when price crosses above last pivot high or below last pivot low
Bullish and bearish events are counted separately
3. State Classification:
Range Position calculates where close sits as percentage of high-low range
Efficiency calculates net move divided by total range
Hierarchical logic applies priority rules from Parabolic states down to Consolidation
4. Output Rendering:
Dashboard table updates with State title, Analysis description, and Metrics
Visual elements render within window only to keep chart clean
Colors reflect bullish, bearish, or neutral classification
💡 Note:
This indicator is intended for educational and review purposes. Use it to develop your understanding of Smart Money Concepts by analyzing what institutional order flow looked like during historical periods. Combine insights with your own analysis methodology for best results.

NCAT Supply & Demand Zones (BoS + Retest Fade)NCAT for TradingView draws Supply and Demand zones based on a simple Break of Structure (BoS) approach using pivot highs/lows.
When a bullish BoS occurs, it searches back for the most recent qualifying bearish “base candle” and creates a Demand zone.
When a bearish BoS occurs, it searches back for the most recent qualifying bullish “base candle” and creates a Supply zone.
Core logic
Structure (BoS): detected when price closes beyond the last pivot high/low.
Base candle selection: searches back a configurable number of bars and requires a minimum candle body size.
Zone source: draw zone from Wick (high/low) or Open (open + wick boundary depending on zone type).
Zone behavior: zones extend to the right, can fade on retests, and optionally delete when broken by a close beyond the distal line.
Inputs
Session filter (optional): only create new zones during a user-defined session/timezone.
Pivot length: controls pivot detection sensitivity.
Search back / Min body points: controls base candle qualification.
Extend / Max zones / Fade controls: manage performance and chart clutter.
Midline: optional 50% level visualization.
Notes
This is an educational tool and does not predict market direction.
Different symbols have different “point” conventions; adjust “Min body size (points)” accordingly.
Created by: Fernando Fortini

Price Action High 2 + Risk/Reward VisualizerIntroduction: Price Action High 2 (Bull Flag) Setup
This script identifies the High 2 (H2) setup, a staple price action pattern popularized by Al Brooks. The High 2 is a high-probability continuation pattern designed to catch the resumption of a bull trend after a two-legged pullback (a "complex" bull flag).
In a strong uptrend, the first attempt to end a pullback often fails (High 1). The High 2 represents the second, and usually more reliable, attempt by bulls to take control, often forming a "double bottom" structure within the flag.
How the Logic Works
The indicator follows a strict state-machine logic to ensure the pattern is valid:
Trend Confirmation: The script filters for an established uptrend where price is above a rising EMA (adjustable in settings).
Pullback Identification: It looks for a sequence of bars making lower highs.
High 1 (H1): The first bar in the correction that breaks above the high of the prior bar.
The Second Leg: The script then waits for the price to again fail to break a high, confirming a second leg of the pullback.
High 2 (H2): The signal is triggered when a bar breaks the high of the previous bar for the second time.
Key Features
Signal Bar Quality Filter: Not all High 2s are equal. This script includes a filter ensuring the signal bar closes in the upper portion of its range (bullish conviction) to avoid "weak" breakouts.
Automated Risk/Reward Visualizer: Upon a signal, the script automatically projects a Stop Loss (at the signal bar low) and a Take Profit level based on a customizable R:R ratio.
Clean Visuals: Labeled "H2" markers and dashed trend lines keep the chart uncluttered.
How to Trade It
Entry: Place a buy-stop order 1 tick above the High 2 signal bar.
Stop Loss: Traditionally placed below the low of the signal bar or the most recent swing low.
Target: Common targets include a 1:2 Risk/Reward ratio or the previous major swing high.
Settings Guide
EMA Length: Adjust this to match your timeframe (e.g., 20 for intraday, 50 for daily).
Min Close %: Set this to 50% or higher to ensure you only take trades where the bulls finished the bar strong.
Risk:Reward Ratio: Customize your profit targets to align with your personal trading plan.

Liquidity Void and Repair EngineLiquidity Void & Repair Engine
OVERVIEW
The Liquidity Void & Repair Engine is a high-fidelity institutional order flow tool designed to identify and track "Market Imbalances" or "Fair Value Gaps" (FVG). Unlike standard gap indicators that clutter the chart with every minor price jump, this engine uses Volatility-Adjusted Range Mapping to isolate high-conviction voids where price moved so rapidly that liquidity was left "unfilled."
The standout feature of this tool is its Active Repair Logic. The engine doesn't just draw static boxes; it monitors price action in real-time to determine when an imbalance has been "healed" by subsequent trading volume, providing a dynamic look at where the market has "unfinished business."
TECHNICAL LOGIC & ORIGINALITY
This script is published Open Source to contribute to the Pine Script community’s understanding of dynamic object management and order flow visualization.
ATR-Relative Filtering: To ensure only significant voids are plotted, the script uses a user-defined ATR (Average True Range) multiplier. This filters out market noise and focuses on institutional "impulse" moves.
Dynamic Box Management: Utilizing the Pine Script box array system, the script manages memory efficiently by updating existing objects rather than creating redundant ones.
The "Repair" Algorithm: The script tracks the high and low of every active void. When price action fully traverses the coordinates of a void, the script "seals" the box, visually marking the moment of liquidity equilibrium.
HOW TO USE
1. Identifying the "Magnet" (The Void)
When price moves aggressively, it leaves a "hole" in the auction.
Bullish Voids (Green): These represent areas where price surged so fast that buyers may still have unfilled orders sitting below. These act as Magnets for pullbacks.
Bearish Voids (Red): These represent areas where price plummeted, leaving a vacuum of selling pressure. These act as Magnets for relief rallies.
2. Trading the "Repair" Process
The Engine tracks how the market "repairs" these holes:
Partial Fill: If price enters a box but doesn't cross it, the "Magnet" is still active.
Full Repair: When a box is "sealed" (stops extending right), it indicates the imbalance is gone. If price "Seals" a green box and then bounces, it confirms the zone as Valid Institutional Support.
3. Confluence with the Trend
Continuation: In a strong uptrend, look for price to drop into a Green Bullish Void and find support. This is often the "Golden Entry" for trend followers.
Reversal Confirmation: If price ignores a Red Bearish Void and blasts right through it (sealing it instantly), it signals a massive shift in market regime and extreme bullish conviction.
USER SETTINGS
Lookback Period: How far back the engine searches for un-repaired gaps.
Min Gap Size (ATR %): Increase this to see only the "Major" institutional gaps; decrease it for a more granular intraday look.
Visual Styles: Fully customizable colors and transparency to match any chart theme (Dark/Light).
NOTES & DISCLAIMER
This script is a visualization of historical price imbalances and is intended for educational purposes only. It does not provide trade signals, entry/exit points, or financial advice. All trading involves risk.

Sen Regression ChannelSen Regression Channel
OVERVIEW
The Sen Regression Channel is a trend-structure visualization tool built on the Theil–Sen estimator, a median-based regression method designed to reduce sensitivity to price outliers. Unlike traditional least-squares regression channels, this approach anchors trend using the most representative slope across the lookback period, resulting in a more stable and noise-resistant structure.
TECHNICAL LOGIC & ORIGINALITY
To protect the proprietary implementation of the median-slope engine and adaptive band construction, this script is published as Protected.
Median Slope Engine
Calculates the Theil–Sen slope by evaluating the median rate of change across the lookback window, producing a trendline less distorted by extreme candles or transient volatility.
Adaptive Volatility Bands
Channel width can be derived from either Standard Deviation or ATR, allowing the envelope to adjust dynamically to changing volatility regimes.
Multi-Reference Context (Optional)
VWAP and EMA/SMA overlays can be enabled to compare the median regression structure against commonly used price and volume-weighted references.
HOW TO USE (EDUCATIONAL)
This tool is designed to help analyze trend quality and market structure, not to generate trade signals.
Trend Direction & Stability
A sustained upward or downward slope of the median regression line indicates directional structure with reduced noise sensitivity.
Volatility Expansion Zones
Price closing outside the channel bands highlights volatility expansion relative to the median trend and may signal regime change.
Mean-Reversion Context
Price oscillation between the median line and bands reflects balanced conditions; movement toward the outer bands indicates relative extension.
VWAP Confluence
Alignment between the regression midline and VWAP may highlight areas of consensus value.
USER INPUTS
Lookback Period – Sets the window for the median slope calculation
Band Multiplier – Scales the channel width
Band Method – Standard Deviation or ATR-based envelope
Visual Overlays – Toggle VWAP, midline, and cloud transparency
NOTES
This script is a historical charting and visualization tool for educational purposes only.
It does not provide trade signals, alerts, or financial advice.
All values are calculated in real time using available chart data.
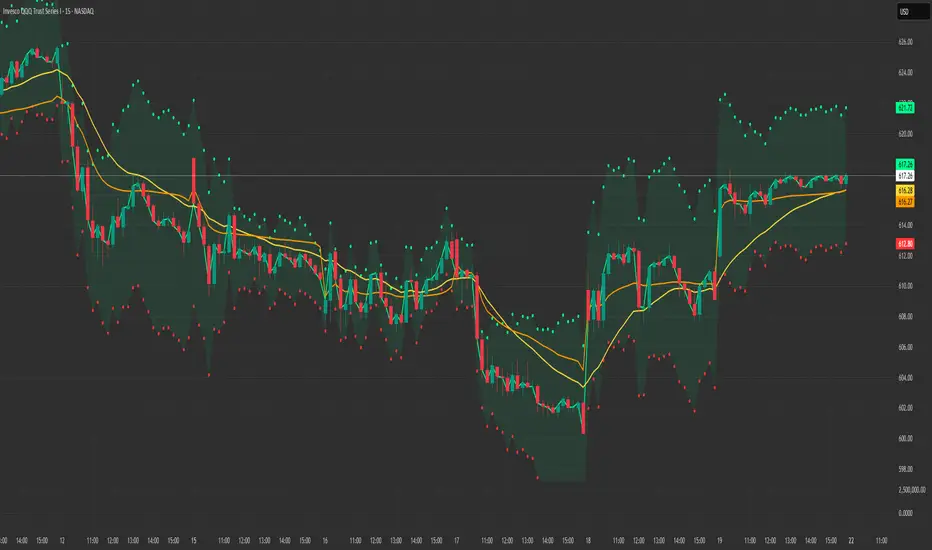
Structure Lite - Automatic Major Trend LinesStructure Lite – Pivot-Based Market Structure Visualization
OVERVIEW
Structure Lite is an open-source charting tool designed to assist traders in visualizing higher-timeframe market structure. The script identifies major swing points using high-period pivot analysis and projects structural support and resistance lines directly on the chart. Its purpose is to highlight persistent market structure while minimizing visual noise.
CORE CONCEPTS & CALCULATIONS
Pivot Identification
The script uses Pine Script’s built-in ta.pivothigh() and ta.pivotlow() functions to identify confirmed swing highs and lows. A pivot is only validated after a user-defined number of bars (Major Pivot Lookback) have formed on both sides of the price extreme, ensuring that only structurally significant pivots are selected.
Structural Pairing
Each structural line is created only after two consecutive pivots of the same type are confirmed (high-to-high or low-to-low). The script stores the price and bar index of these pivots and uses them as fixed anchor points.
Line Projection
Once a valid pivot pair is formed, the script draws a line between the two points using line.new() and extends it forward using extend.right. These lines represent projected structural boundaries rather than trade signals.
Object Management
To maintain chart clarity and performance, the script manages all drawn objects through a line array. A FIFO (First-In, First-Out) method is applied so that only the three most recent structural lines remain visible. Older lines are automatically deleted as new ones are created.
DESIGN PHILOSOPHY & ORIGINALITY
While many indicators plot frequent swing points or short-term pivots, Structure Lite focuses on structural persistence. By filtering for higher-period pivots and limiting the number of displayed projections, the script emphasizes dominant market structure rather than short-term fluctuations. This approach is intended to support discretionary analysis, not replace it.
HOW TO USE
Major Pivot Lookback
Increase the value to focus on higher-timeframe structure (e.g., swing or position trading).
Decrease the value to visualize intraday structural levels.
Visual Encoding
Green lines represent projected structural support
Red lines represent projected structural resistance
Visibility Control
A boolean input allows all structure lines to be hidden instantly to restore a clean price chart.
LIMITATIONS & DISCLAIMER
This script is a visualization tool only. It does not generate trade signals, entry or exit points, alerts, or directional forecasts. All plotted levels are derived from historical price action and may change as new pivots form. The script is provided for educational and analytical purposes and should be used in conjunction with other forms of market analysis

Order Flow Signals - Alphaomega18═══════════════════════════════════════════════════════════════════════════════
ORDER FLOW SIGNALS - TRADINGVIEW PUBLICATION (ENGLISH)
Created by Alphaomega18
═══════════════════════════════════════════════════════════════════════════════
📌 PUBLICATION TITLE
═══════════════════════════════════════════════════════════════════════════════
Order Flow Signals - Absorptions & CVD Divergences - Alphaomega18
📝 COMPLETE DESCRIPTION
═══════════════════════════════════════════════════════════════════════════════
🎯 DETECT INSTITUTIONAL MOVES IN REAL-TIME
Order Flow Signals is an advanced order flow analysis indicator that displays institutional absorption signals, hidden CVD divergences, and extreme buy/sell pressure directly on your chart.
Fully customizable with 9 configurable colors, adjustable label sizes, and extreme absorption detection (300%+), this indicator allows you to trade WITH institutions, not against them.
🔥 THE PROBLEM IT SOLVES
Have you ever:
✗ Taken a technically perfect setup but got stopped out?
✗ Seen price reject a support/resistance but go the other way?
✗ Entered counter-trend without knowing institutions were accumulating?
✗ Missed big moves due to lack of confirmation?
Order Flow Signals solves these problems by revealing what smart money is REALLY doing behind each candle.
📊 SIGNALS DISPLAYED ON CHART
🔷 ABSORPTIONS (💎 Diamonds)
Institutions absorb order flow when volume is high BUT price doesn't move in the expected direction.
💎 BULLISH ABSORPTION (Cyan)
→ Volume spike + bearish candle + positive delta
→ Institutions are BUYING despite selling pressure
→ Strong accumulation signal
💎 BEARISH ABSORPTION (Orange)
→ Volume spike + bullish candle + negative delta
→ Institutions are SELLING despite buying pressure
→ Strong distribution signal
🔥 EXTREME ABSORPTIONS (Fuchsia Fire)
→ Volume > 300% of average (customizable)
→ MASSIVE institutional activity
→ Ultra-rare and ultra-strong signals
→ Indicates major moves in preparation
🔺 DIVERGENCES (▲ Green Triangles)
Price makes lower lows BUT CVD makes higher lows
→ Hidden accumulation in progress
→ Bullish reversal signal likely
→ Confirms your BUY entries
🔻 DIVERGENCES (▼ Red Triangles)
Price makes higher highs BUT CVD makes lower highs
→ Hidden distribution in progress
→ Bearish reversal signal likely
→ Confirms your SELL entries
🚀 EXTREME BUY PRESSURE (Rockets)
Delta > 2x average
→ Massive aggressive buying
→ Strong bullish momentum
→ Continuation likely
💥 EXTREME SELL PRESSURE (Explosions)
Delta < -2x average
→ Massive aggressive selling
→ Strong bearish momentum
→ Capitulation or panic
📈 DELTA PER CANDLE DISPLAY (NEW)
Option to display numerical delta on each candle:
• ✅ GREEN when delta positive (+250, +180, etc.)
• ❌ RED when delta negative (-320, -150, etc.)
• Tiny size to avoid clutter
• Perfect for tracking flow in real-time
🎯 REAL USE CASES
📌 Example 1: Avoid the Classic Trap
Technical setup:
→ Price rejects VWAP Weekly (resistance)
→ FVG below attracting
→ Single Prints above
→ You think: "Perfect SELL setup!"
WITHOUT Order Flow Signals:
❌ You enter SELL
❌ Price goes up and stops you out
❌ Frustration and loss
WITH Order Flow Signals:
✅ You see 💎 CYAN DIAMOND (Bullish absorption)
✅ Institutions are BUYING despite rejection
✅ You DON'T ENTER SELL
✅ Trade saved, loss avoided!
📌 Example 2: Confirm a Breakout
Setup:
→ Price breaks major resistance
→ But is it a real breakout or fakeout?
Check Order Flow Signals:
→ 🚀 ROCKET appears (extreme buy pressure)
→ 💎 CYAN DIAMOND (bullish absorption)
→ Massive positive delta visible
Clear signal: It's a REAL breakout!
→ Enter BUY with confidence
→ Institutions pushing price
📌 Example 3: Detect Hidden Accumulation
Situation:
→ Price consolidating in range
→ Apparently neutral
→ No clear technical signal
Order Flow Signals reveals:
→ ▲ GREEN TRIANGLE (bullish divergence)
→ Price flat BUT CVD rising progressively
→ Institutional accumulation in progress
Action: Prepare LONG position
→ When price breaks, it will be violent!
⚙️ COMPLETE CUSTOMIZATION
🎨 COLORS (9 configurable colors)
• Bullish Absorption (default: cyan)
• Bearish Absorption (default: orange)
• EXTREME Absorption (default: fuchsia)
• Bullish Divergence (default: green)
• Bearish Divergence (default: red)
• Buy Pressure (default: lime)
• Sell Pressure (default: fuchsia)
• Positive Delta (default: green)
• Negative Delta (default: red)
Adapt the indicator to your chart style!
📏 LABEL SIZES
5 sizes available: Tiny / Small / Normal / Large / Huge
→ Perfect for all screen types
→ Large 4K screen? → Large or Huge
→ Small laptop? → Small or Normal
🔍 CUSTOMIZABLE DETECTION
• Normal Absorption Threshold: 1.5x (default)
• EXTREME Absorption Threshold: 3.0x (default)
• Divergence Periods: 14 (default)
• All thresholds adjustable to your style
👁️ ON/OFF DISPLAY
• Absorptions 💎 (On/Off)
• Divergences ▲▼ (On/Off)
• Extreme Pressure 🚀💥 (On/Off)
• Delta per Candle (On/Off)
Display only what you need!
🔔 COMPLETE ALERT SYSTEM
8 independently configurable alert types:
1. 🔵 Bullish Absorption
2. 🔴 Bearish Absorption
3. 🔥🔵 EXTREME Bullish Absorption
4. 🔥🔴 EXTREME Bearish Absorption
5. 📈 Bullish Divergence
6. 📉 Bearish Divergence
7. 🚀 Extreme Buy Pressure
8. 💥 Extreme Sell Pressure
Receive push, email or SMS notifications when institutions act!
💡 MARKETS AND TIMEFRAMES
✅ ALL markets compatible:
• Futures (ES, NQ, YM, RTY, MNQ, MES, etc.)
• Forex (EUR/USD, GBP/USD, USD/JPY, etc.)
• Crypto (BTC, ETH, altcoins)
• Stocks (Tesla, Apple, Nvidia, etc.)
• Indices (S&P 500, Nasdaq, Dow Jones)
• Commodities (Gold, Oil, etc.)
✅ All timeframes:
• Scalping: 1min, 5min
• Day Trading: 15min, 30min, 1H ⭐ (optimal!)
• Swing Trading: 4H, Daily
Note: More reliable signals with real volume data
→ TradingView Premium recommended for tick data
🏆 UNIQUE ADVANTAGES
✅ Automatic institutional absorption detection
✅ EXTREME absorptions (300%+) for ultra-strong signals
✅ Integrated CVD (Cumulative Volume Delta)
✅ Optional per-candle delta display (green/red)
✅ 9 customizable colors - adapt to your style
✅ 5 label sizes - perfect for all screens
✅ Clear visual signals directly on chart
✅ Detailed tooltips on each signal
✅ 8 independent configurable alerts
✅ Clean, optimized code, no repaint
✅ Compatible all markets and timeframes
📊 RECOMMENDED CONFIGURATION
For MNQ / ES / NQ (15min):
```
Detection:
├─ Normal Absorption Threshold: 1.5x
└─ EXTREME Absorption Threshold: 3.0x
Display:
├─ Absorptions: ✅ ON
├─ Divergences: ✅ ON
├─ Extreme Pressure: ✅ ON
└─ Delta per Candle: ❌ OFF (or ON if preferred)
Customization:
└─ Label Size: Normal (or Large for big screen)
Colors:
└─ Default (or customize!)
Alerts:
└─ All ✅ ON
```
For Scalping (1-5min):
```
└─ Label Size: Small
└─ Delta per Candle: ✅ ON (useful in scalping)
└─ Absorption Threshold: 2.0x (stricter)
```
🎓 SUPPORT AND TOOLTIPS
Each signal includes detailed tooltip on hover:
• Exact volume and multiplier (e.g. 2.3x)
• Precise delta
• Signal explanation
• Suggested action
Hover over 💎▲🚀 to understand each signal!
🔗 PERFECT COMPLEMENT
This indicator works perfectly with:
• Order Flow Dashboard (to see CVD and pressures)
• VWAP Multi-Timeframe
• Fair Value Gaps (FVG)
• Market Profile (POC/VPOC)
• Support/Resistance
Combine Order Flow signals with your technical analysis!
⚠️ DISCLAIMER
Technical indicators are decision support tools. No indicator guarantees profits. Always use:
• Appropriate risk management
• Stop loss on every trade
• Proper position sizing
• Demo account testing first
Order Flow Signals improves your analysis but doesn't replace a complete strategy.
📞 CONTACT AND SUPPORT
Created by Alphaomega18
For questions, bugs or suggestions:
Find my other indicators:
• Order Flow Dashboard (CVD and pressures)
• VWAP Multi-Timeframe Pro
• Fair Value Gap Detector
• Volume & Volatility Crisis Detector

Cave Diving 3 Lines System
🤿 Cave Diving Dashboard - A Deep Dive into Market Structure
## The Cave Diving Analogy
Imagine you're a cave diver exploring underwater caverns. As you descend deeper, you encounter different layers of the cave system:
- **The Surface (Internal Levels)** - Where you currently are, constantly shifting with each breath
- **The First Chamber (De Novo Levels)** - Your last known safe position, recently established
- **Deep Caverns (External Levels)** - Ancient, untouched chambers deeper in the system
Just as a cave diver must constantly monitor their position relative to these reference points, traders must track price action against key structural levels.
---
## 🎯 Understanding the Three-Tiered System
### 📍 **INTERNAL LEVELS** (Current 15m Candle)
*Your real-time position in the market*
**Internal High** 🟡 - The highest point reached in the current unfinished 15-minute candle
**Internal Low** 🟢 - The lowest point reached in the current unfinished 15-minute candle
**Think of these as:**
- Your current depth while actively diving
- They update continuously as price moves
- Status shows "Updating" when actively changing, "Intact" when stable
- These are NOT trade levels—they're awareness zones
**Key Insight:** When Internal Low drops below De Novo Low, you're in **Situation A** (bearish pressure building)—the indicator highlights this with red coloring.
---
### 🎯 **DE NOVO LEVELS** (Previous Closed 15m Candle)
*Your most recent confirmed safe zone*
**De Novo High** 🔵 - The high of the last completed 15-minute candle
**De Novo Low** 🟣 - The low of the last completed 15-minute candle
**Etymology:** "De Novo" = Latin for "from new" or "anew"—these are freshly established reference points
**Think of these as:**
- The last solid ground you stood on
- Your most recent confirmed position
- The bridge between where you are (Internal) and where you've been (External)
**Status Tracking:**
- **⬆️ Upgrade** - Level moved favorably (Higher high for resistance, Higher low for support)
- **⬇️ Downgrade** - Level moved unfavorably (Lower high, Lower low)
- **= Same** - No structural change from previous candle
**Trading Significance:**
- Primary reference points for intraday structure
- Breaking De Novo levels often signals directional commitment
- Can merge with External Level 1 when they align (shown as "DN🟰Ext1")
---
### ⛽🤿 **EXTERNAL LEVELS** (Unmitigated Historical 15m Levels)
*Deep liquidity pools waiting to be discovered*
**External High 1 & 2** 🟢🔵 - The two most recent unmitigated 15m highs
**External Low 1 & 2** 🟠🌸 - The two most recent unmitigated 15m lows
**Think of these as:**
- Untouched chambers in the cave system
- Liquidity pools that smart money is targeting
- Levels that "remember" and attract price
**What Makes a Level "Unmitigated"?**
- **Highs**: Price has NOT yet traded through them (broken above)
- **Lows**: Price has NOT yet swept them (broken below)
- Once touched, they're "mitigated" and removed from tracking
- The indicator automatically maintains the two most recent unmitigated levels
**Why "External"?**
They exist outside your current candle structure—historical reference points that institutions use for:
- Stop loss placement
- Profit taking targets
- Liquidity hunting zones
---
## 🎨 Color Coding System
### HIGHS (Resistance/Targets) - Cool Colors
- 🔵 **Ext High 2** - Light Blue (Distant target)
- 🟢 **Ext High 1** - Lime Green (Primary target)
- 🔵 **De Novo High** - Cyan (Recent resistance)
- 🟡 **Internal High** - Lemon Yellow (Current ceiling)
### LOWS (Support/Stops) - Warm Colors
- 🟢 **Internal Low** - Lime (Current floor)
- 🟣 **De Novo Low** - Purple (Recent support)
- 🟠 **Ext Low 1** - Orange-Red (Primary stop zone)
- 🌸 **Ext Low 2** - Pink (Distant support)
---
## 📊 Dashboard Breakdown
### The Table Shows:
1. **Level** - Which level you're tracking
2. **Price** - Exact price of the level
3. **Pts** - Distance from current price (+ above, - below)
4. **Status** - Current state or role of the level
### Special Features:
- **⏰ Countdown Timer** - Shows time remaining until next 15m candle close (next De Novo update)
- **⚠️ Proximity Alerts** - Bottom row warns when within threshold distance of key levels (default: 25 points, adjustable)
---
## 🎯 Trading Applications
### **For Buyers (Going Long):**
- **Entry Zone**: Between De Novo Low and Ext Low 1
- **Stops**: Below Ext Low 1 (or Ext Low 2 for wider stops)
- **Targets**: De Novo High → Ext High 1 → Ext High 2
- **Confirmation**: Internal Low holds above De Novo Low
### **For Sellers (Going Short):**
- **Entry Zone**: Between De Novo High and Ext High 1
- **Stops**: Above Ext High 1 (or Ext High 2 for wider stops)
- **Targets**: De Novo Low → Ext Low 1 → Ext Low 2
- **Warning**: Watch for Situation A (Internal Low < De Novo Low)
### **Risk Management:**
- **DN🟰Ext1** status means De Novo = External 1 (tighter range, use caution)
- Proximity alerts help you avoid chasing price into resistance/support
- "Updating" status on Internal levels = active volatility
- "Upgrade/Downgrade" signals = structural shift in progress
---
## ⚙️ Customization Options
### Lookback Period
- Default: 500 candles (searches 125 hours of 15m data)
- Increase for more historical External levels
- Decrease for focus on recent structure
### Proximity Threshold
- Default: 25 points
- Set based on your instrument's average range
- Lower = tighter alerts (for scalping)
- Higher = strategic warnings (for swing trading)
### Visual Customization
- Line thickness (1-5)
- Line style (Solid/Dashed/Dotted)
- All colors fully customizable
- Show/hide lines independently
---
## 🧭 The Cave Diving Mindset
**Never dive deeper than you can safely return from.**
In trading terms:
- Know your Internal position (real-time awareness)
- Respect your De Novo levels (recent structure)
- Hunt for External liquidity (where the targets are)
- Always have an exit plan (stops below Ext Lows, above Ext Highs)
The market, like a cave, has structure. This indicator illuminates that structure across three timeframes of reference, helping you navigate with precision rather than guessing in the dark.
---
## 🎓 Key Takeaways
1. **Internal** = Real-time, unfinished, awareness only
2. **De Novo** = Just confirmed, primary reference, updates every 15m
3. **External** = Historical, unmitigated, high-probability targets/stops
4. **Upgrades/Downgrades** = Trend signals
5. **DN🟰Ext1** = Structural alignment (tighter range)
6. **Situation A** = Bearish warning (Internal < De Novo Low)
---
## 📝 Credits
*"In cave diving, you plan your dive and dive your plan. In trading, you plan your levels and trade your levels."*
**Indicator:** Cave Diving Dashboard - Part 1: Price Levels
**Timeframe:** Optimized for 15-minute structure on any chart timeframe
**Philosophy:** Structure first, price second. Know where you are, where you've been, and where the liquidity waits.
---
Happy Diving! 🤿📈

ICT Unicorn Model [Kodexius]ICT Unicorn Model is a market structure and imbalance confluence tool that automatically detects high probability “Unicorn” setups by combining three key elements into a single, clean script:
-A first, clean break of that swing level (displacement style break)
-A Fair Value Gap that overlaps a breaker candle body range
Instead of plotting every pivot or every imbalance independently, the script waits for a specific sequence: price establishes a valid swing, breaks that swing for the first time, and prints a setup only when the resulting context aligns with a valid, volatility filtered FVG and a clearly defined breaker range.
Each detected setup is drawn directly on the chart with labeled zones (Breaker and FVG) and is then actively monitored. If price violates the breaker boundary based on your chosen invalidation basis (Close or Wick), the setup is marked inactive and can optionally be removed to keep the chart clean.
This indicator is designed for traders who work with ICT style concepts such as liquidity runs, displacement, breaker blocks, and imbalance reversion, and who want a structured, rules based visualization rather than discretionary drawing.
🔹 Features
🔸 Fair Value Gap Detection With Volatility Filtering
Bullish and bearish FVGs are detected using classic three candle imbalance logic. To avoid low quality gaps during compression, the script applies an ATR based minimum size filter using the “FVG Min Size (ATR Multiplier)” input. Only gaps larger than ATR * threshold are considered valid.
🔸 First Break Validation (Clean Break Logic)
A key part of the model is identifying a “first break” of a swing level. The script checks whether the swing price has already been invalidated between the swing bar and the current bar. If it has, the swing is ignored. This helps reduce repeated signals and focuses on fresh structural breaks.
🔸 Breaker and FVG Confluence With Overlap Requirement
After a valid break occurs, the script defines a breaker range using the body of the swing candle (open and close). A setup is only created if this breaker body range overlaps the detected FVG price range. This overlap requirement is what filters many “almost” conditions and keeps signals more selective.
Bullish Unicorn:
Bearish Unicorn:
🔸 Configurable Invalidation Basis (Close or Wick)
You can choose how a setup fails:
-Close: invalidation requires a candle close beyond the breaker boundary
-Wick: invalidation occurs as soon as any wick crosses beyond the breaker boundary
This allows the tool to adapt to different trading styles, from conservative confirmation to more sensitive risk control.
🔸 Automatic Cleanup of Failed Setups
If “Delete Invalidated Setups” is enabled, the script removes the breaker box, FVG box, and label as soon as the setup is invalidated. If disabled, the zones remain visible for review while the setup is marked inactive internally.
🔸 Clear Chart Visuals
Each setup plots:
-A labeled Breaker zone box
-A labeled FVG zone box
-A directional Unicorn label (Bull or Bear) that updates position as the chart advances
Colors for bullish and bearish structures are fully configurable.
🔸 Alert Conditions
Two alert conditions are provided:
-Bullish Unicorn Setup Detected
-Bearish Unicorn Setup Detected
Alerts trigger only on the bar a new setup is created.
🔹 Calculations
This section summarizes the main computations used internally. The goal here is to explain the model mechanics rather than reproduce every implementation detail.
1. Swing Detection (Pivot High / Pivot Low)
Swing levels are detected using a symmetric pivot definition with “Swing Length” bars on both sides:
float ph = ta.pivothigh(high, swingLength, swingLength)
float pl = ta.pivotlow(low, swingLength, swingLength)
When a pivot is confirmed, its price and originating bar index are stored:
-Swing High: price = pivot high, isHigh = true
-Swing Low: price = pivot low, isHigh = false
The script keeps a limited history (most recent swings) to stay efficient.
2. Fair Value Gap Detection
FVGs use the classic three candle displacement imbalance:
Bullish FVG condition
bool isBullFVG = high < low
Bullish gap range is defined as:
-Top = low
-Bottom = high
Bearish FVG condition
bool isBearFVG = low > high
Bearish gap range is defined as:
-Top = low
-Bottom = high
3. ATR Based Minimum Gap Filter
ATR is computed (length 14), then the gap size is compared against a user threshold:
float atr = ta.atr(14)
bool validBullFVG = isBullFVG and (bullFvgTop - bullFvgBot) > (atr * fvgThreshold)
bool validBearFVG = isBearFVG and (bearFvgTop - bearFvgBot) > (atr * fvgThreshold)
This prevents very small imbalances from generating setups in low volatility conditions.
4. “First Break” Check Using Level Invalidation Scan
Before accepting a swing break, the script scans forward from the swing bar to the current bar to confirm the level has not already been breached. The scan can be based on wick or close:
-Wick mode: uses high or low
-Close mode: uses close
Conceptually:
priceToCheck = mode == "Wick" ? (checkBelow ? low : high) : close
If a prior breach is found, the swing is treated as already invalidated and is ignored for setup creation.
5. Break Of Structure Condition
Bullish break requirement
A bullish setup requires breaking a stored swing high with bullish body intent:
-close > swingHighPrice
-open < close
Bearish break requirement
A bearish setup requires breaking a stored swing low with bearish body intent:
-close < swingLowPrice
-open > close
An additional proximity filter is applied in the bearish branch to reduce weak or overly extended breaks by requiring the prior close to be reasonably near the swing level.
6. Breaker Range Construction
Once a qualifying swing is found, the breaker range is derived from the body of the swing candle (the candle at the swing bar index). The body boundaries are:
float breakerTop = math.max(bOpen, bClose)
float breakerBot = math.min(bOpen, bClose)
This models the breaker as the candle body range rather than full wick range, which typically produces more practical invalidation boundaries.
7. Overlap Test Between Breaker and FVG
A setup is only created if the breaker body overlaps the FVG zone. Conceptually the script rejects cases where one range is fully above or fully below the other:
-If there is no overlap, no setup is created
-If overlap exists, the Unicorn setup is valid
8. Active Monitoring and Invalidation
Each setup remains active until invalidated. Invalidation is evaluated every bar using your selected basis:
-Close basis: compares close to breaker boundary
-Wick basis: compares high or low to breaker boundary
Bullish invalidation
Setup fails if price crosses below breaker bottom.
Bearish invalidation
Setup fails if price crosses above breaker top.
If deletion is enabled, all drawings related to that setup are removed immediately on invalidation.
9. Drawing Updates and Object Lifecycle
Breaker and FVG boxes are extended to the right while the setup is active to keep zones visible into the near future. The Unicorn label is also repositioned as new bars print so the most recent context stays readable.
