Variable Moving Average Bands [LazyBear]VMA Bands are ATR bands with VMA as its centre. For a description of options, refer to my VMA post:
I have moved VMA calculation in to a separate function. Feel free to use calc_vma() in your scripts. For more MA calculation function (KAMA, VIDYA and others), refer to my complete list of indicators below.
Wish you all a very prosperous New year. Hope these indicators make you all more money this year too :)
List of my other indicators:
- GDoc: docs.google.com
- Chart:
價格通道

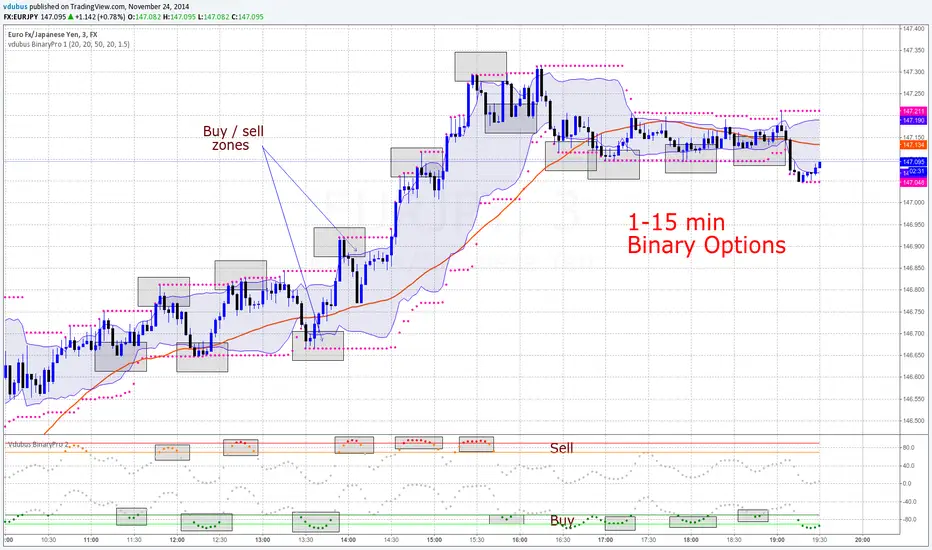
vdubus BinaryPro - Indicators 1 & 2For both scripts - Go to 'MAKE IT MINE'
Modified scripts for Binary trading 1- 3 min charts / 5 -15 min intervals
vdubus BinaryPro 1
Vdubus BinaryPro 2
------------------------------
Vdubus BinaryPro Money Management Strategy: $10 - $50,000 in 15 trades
Tip * break consecutive trades down to lots of 5 compounded / repeat to build up a solid equity foundation., then move on the the next 5 x 3 = 15
if you lose one trade out of the 5, restart the proses. You only ever lose the initial trade size you started with * DOUBLE YOUR WINNINGS NOT YOUR LOSSES !
If you struggle to win 5 compounded trades in a row, compound 2 or 3 trades at a time
drive.google.com
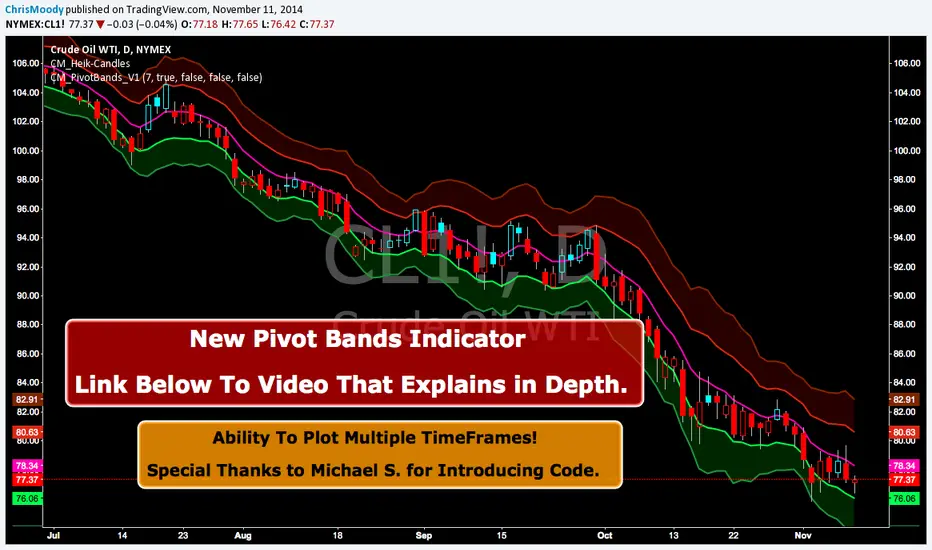
CM Pivot Bands V1CM_Pivot Bands V1
Special Thanks to Michael S for Introducing Code.
Instead of a Long Write Up I Recorded A Video Going Into Detail On V1 Of This Indicator. Please View To See My Initial Findings, My Thoughts For V2, And Items I Need YOUR Help With!!!
In Inputs Tab Indicator Has Ability to Turn On/Off Multiple TimeFrames…Thought Process Explained In Video.
Link To Video:
vimeopro.com
Link To PDF Mentioned In Video:
d.pr
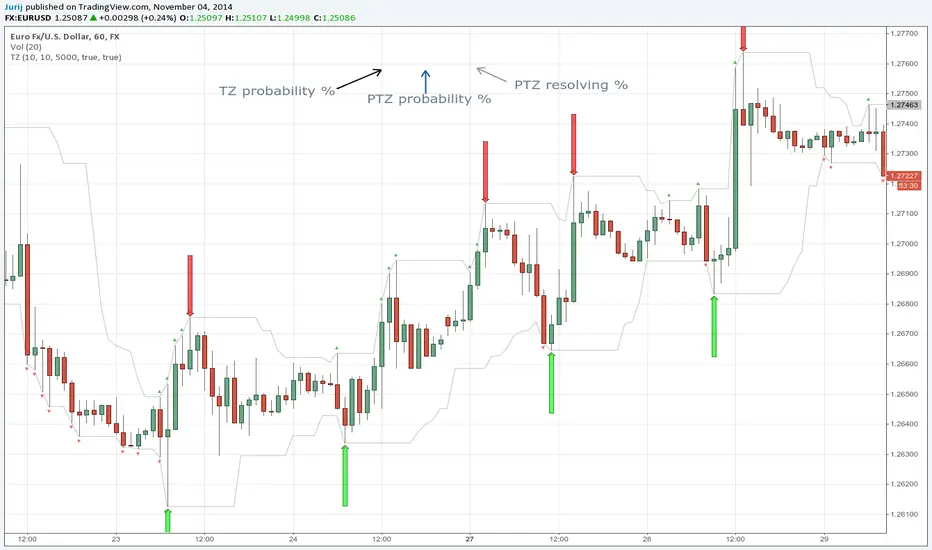
Transient Zones v1.1Simple indicator to visualize Transient Zones (TZ) and Potential Transient Zones (PTZ).
The last 3 numbers in the header represent: probability of true TZ (black), probability of PTZ (navy) and probability of PTZ resolving (gray).
Original ForexFactory thread by EURUSDD www.forexfactory.com
Version 1.1:
- Added TZ/PTZ occurrence probability thanks to SPYderCrusher
Todo:
- Mid bar transient zones detection
- Draw rectangles for zones (once rectangle drawing gets implemented in pine script) or use dot/circle lines
- Mark forming PTZs more clearly
Previous version 1.0:
Indicator: Price Headley Accelaration Bands [LazyBear]The Acceleration Band System was published in "Big Trends in Trading" by Price Headley in 2002. The system designed to catch stocks as they start to trend but before they go parabolic. The system is simple but supposed to be very effective.
This system makes use of %R and ADX a lot to determine the entries/exits. Refer to the documents listed below for the complete set of rules.
More info:
* System Trading Rules: drive.google.com
* www.bigtrends.com
* www.slideshare.net

Indicators: Hurst Bands and Hurst OscillatorThese 2 indicators are derivative work from Jim Hurst's book - "The Magic of Stock Transaction Timing".
The bands are % bands around a median that gets calculated according to Hurst's formula. The outer bands (called ExtremeBands) signify extreme overbought/oversold conditions. Inner bands signify potential pullback points. As you can see, they also act as dynamic S/R levels.
The oscillator bands match the bands overlaid on price, so you will get an excellent indication of where the price is gonna do by using the oscillator along with the bands. Note that Hurst Oscillator can be used separately too, there is no technical dependency on Hurst Bands.
More info on Hurst Method:
www.readtheticker.com

3 projection Indicators - PBands, PO & PBAll these indicators are by Mel Widner.
Projection Bands :
-------------------------------------------------------
These project market data along the trend with the maxima and minima of the projections defining the band. The method provides a way to signal potential direction changes relative to the trend. Usage is like any other trading band.
Projection Oscillator :
-------------------------------------------------------
This indicates the relative position of price with in the bands. It fluctuates between the values 0 to 100. You can configure the "basis" to make it oscillate around a specific value (for ex., basis=50 will make it oscillate between +50 and -50). EMA of PO (length configurable, default is 5) is plotted as a signal line. There is also an option to plot the difference (oscillator - signal), just like MACD histogram. When you see a divergence in this oscillator, remember that it just indicates a potential movement with in the band (for ex., a bullish divergence shown may cause the price to cross the median and move up to the top band).
Projection Bandwidth :
-------------------------------------------------------
This shows the % width of the projection bands. A trend reversal is signaled by a high value. Low value may indicate the start of a new trend. This is also a trend strength indicator.
More info: drive.google.com
Borrowed the color theme for this chart from @liw0. Thanks :)
