Cryptocurrency Profitability Rankings with Popular ListA good cryptocurrency may multiply your earnings - with the same effort.
This indicator helps crypto traders to find the trading securities that suit their profitability and volatility preference.
This indicator calculates and generate a ranking of profitability from a popular list of crypto currencies, based on MACD cycles within user-defined time span.
Multiple time frames: This indicator is designed for day trading, so suggested time frames are: 3m, 5m, 15m, 30m, 1H. Users can try other time frames (< 1D) if they find it useful.
Developed based on Profitability Meter for Day Trading PRO
About popular list of Cryptocurrency:
The author has the right to change the list from time to time without notice.
PRO Version of this Indicator: (invite-only)
Advanced functions:
Customisable(User-Defined) Cryptocurrency List
Option to select Open or Close price as start point for calculation.
Flexible Time Span Type: Hours and Bars, besides Days
More statistics options: Display price change(%) of latest rising/falling MACD cycle
Format Configuration:
Profitability Threshold: a percentage of price movement within a MACD cycle that a user thinks can be used to define profitability, defval: 0.8%.
Statistics Options
timeSpan: time span for statistics
timeSpanType: time span type for statistics
Related Indicators:
Profitability Meter for Day Trading PRO - Calculating and evaluating individual trading securitie's profitability.
About Loading Time: It may take up to 2 minutes for your browser to load a new format setting, depending on the your computer and network speed.
List of the author's Indicators
www.tradingview.com
Disclaim: By using or requesting access to this indicator, you acknowledge that you have read and accepted that this indicator is for study purposes only and it does NOT guarantee you will make money.
I am not financial adviser and I am NOT responsible for any profits or losses you may incur by using this indicator!
Users should make their own decisions, carefully assess risks and be responsible for investment and trading activities.
The latest updates override the previous description. Please check the updates.
加密货币赢利潜力排行指标 热门列表
优质的交易币种可能倍增你的收益-在付出同样的努力的情况下。
该指标基于Profitability Meter for Day Trading PRO开发,帮助加密货币玩家找到适合其赢利性和波动率偏好的币种。
该指标根据用户定义的时间跨度内的MACD周期,计算和比对一组虚拟货币,生成一个赢利潜力排名。
多时间维度:本指标为日内交易设计,因此建议使用时间维度:3m,5m,15m,30m,1H; 如果用户需要,也可以用于其他小于1D的维度。
关于加密货币的热门列表:
作者有权随时更改列表,恕不另行通知。
该指标的PRO版本:Cryptocurrency Profitability Rankings PRO with Customisable List (Invite-Only)
可自定义加密货币列表,上至10个
可选择开盘价或收盘价作为计算起点。
灵活的时间跨度类型:小时,蜡烛数,天数
更多统计选项:显示最近上涨/下跌的MACD周期的价格变动(%)
格式配置:
盈利能力阈值:用户自定义的MACD单次波动的可赢利的百分比,默认为0.8%
统计选项
timeSpan:统计功能的时间跨度
timeSpanType:统计功能的时间跨度单位
相关指标:
日内交易盈利潜力指示仪PRO (Profitability Meter for Day Trading PRO):用于计算和评估单个交易品种的盈利能力
关于载入新设置:每次载入新的设置可能需要0-2分钟,取决于用户的电脑配置和网络速度。
试用开发者的其他指标
www.tradingview.com
免责声明:在要求获得本指标使用权之前以及在使用本指标之前,用户认可已经完全了解和接受:本指标仅供教育和研究目的, 它不提供任何赢利的可能性。
本指标的开发者并非专业投资顾问,因此不对用户的任何赢亏负责。
用户应独立判断,审慎评估并自负投资和交易风险!
最新更新会覆盖之前的说明。 请检查更新。
Profitable

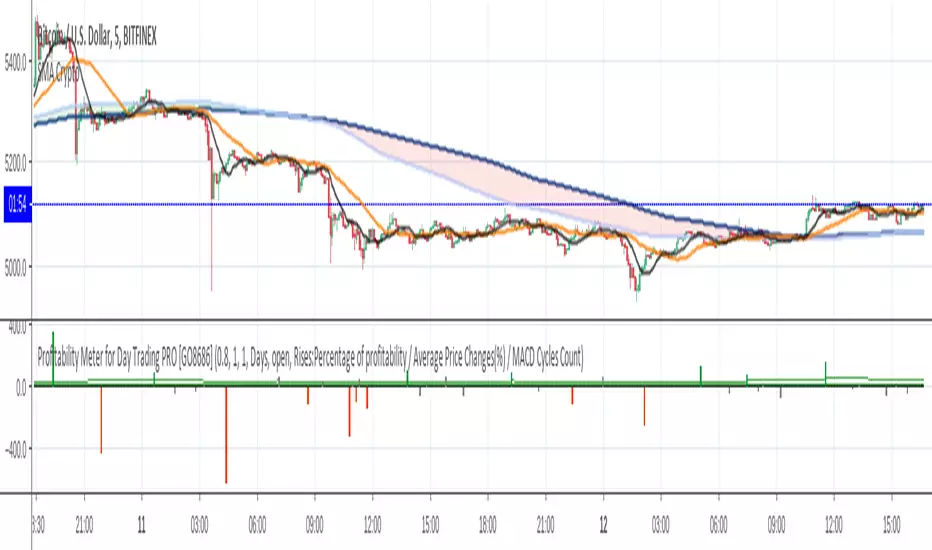
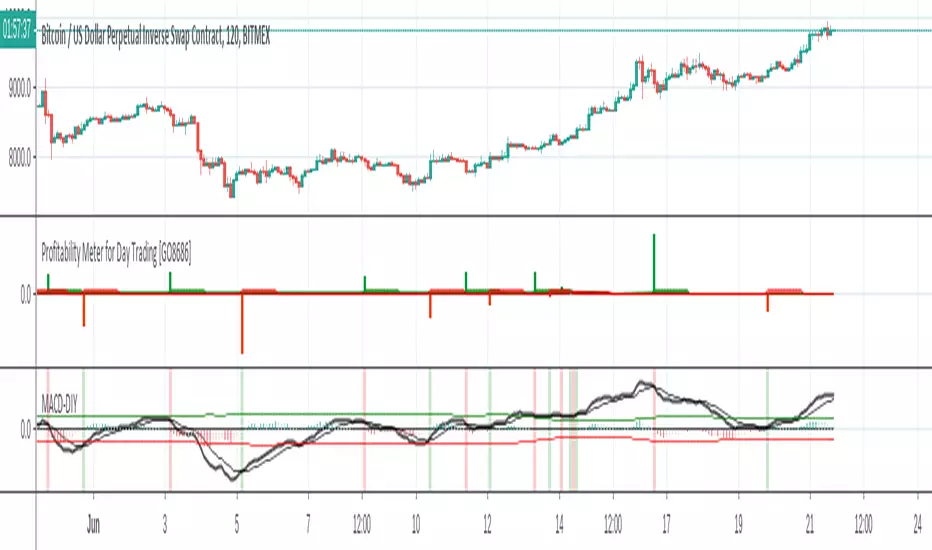
Profitability Meter for Day Trading PRO [GO8686]For day traders, keeping a position is risky and costly, a popular strategy is to open a position ONLY when volatility is active, in other words, only when profitability is back.
This indicator reveals the movements of the underlying profitability of a trading security in different time dimensions.
This indicator calculates and displays price change percentage of MACD cycles, highlights those MACD cycles that are over the profitability threshold, helping traders identify range area, the start of a new trend and the fading of a trend.
Multiple time frames: This indicator is designed for day trading, so suggested time frames are: 3m, 5m, 15m, 30m, 1H. Users can try other time frames (< 1D) if it fits their trading practice.
Range area in general: a small green column and a small red column appear alternately, or most columns are gray within the period.
The start of a new trend: an outstanding green or red column means the macd cross brought a price change that was higher than the profitability threshold, which could mean a new trend, especially when it was from a range area.
The fading of a trend: for instance, when green columns are getting smaller and red columns appear, a fading of bull trend could be on the way.
This is PRO version of Profitability Meter for Day Trading
PRO excluded functions:
Alert Function: allowing user to set alert for price change with Profitability, or set alert for statistics results.
Statistics within Customisable Time Span: Percentage of MACD cycles with profitability, the average of price change(%) and MACD cycles count. Users can customize the time range by days,hours or bars (up to the maximum backtracking value that Tradingview allows).
Subscribers of this indicator may apply for two-month free-trial of "Crypto Currency Profitability Rankings PRO with Customisable List"
Free trial of two-week: Please leave a comment asking for a trial, you should get access in 48 hours. In case it doesn't happen, please message the author.
Visibility:Invite-Only
Format Configuration:
Profitability Threshold: a percentage of price movement within a MACD cycle that a user thinks is good to define profitability, defval: 0.8%.
Alertthreshold: Threshold percentage for alert.
timeSpan: Time span for statistics
timeSpanType: Time span type for statistics
Related Indicators:
Crypto Currency Profitability Rankings Standard with Popular List (Protected): The Indicator calculates and compares the profitability of a group of popular crypto currencies - based on MACD cycles and user-defined time span, helping traders to find the most suitable trading security.
Crypto Currency Profitability Rankings PRO with Customisable List (Invite-Only): Contact the author for a free trial.
List of the author's Indicators
www.tradingview.com
Disclaim: By using or requesting access to this indicator, you acknowledge that you have read and accepted that this indicator is for study purposes only and it does NOT guarantee you will make money.
I am not financial advisor and I am NOT responsible for any profits or losses you may incur by using this indicator!
Users should make their own decisions, carefully assess risks and be responsible for investment and trading activities.
The latest updates override the previous description. Please check the updates.
日内交易盈利潜力指示仪PRO
这是日内交易盈利潜力指示仪的PRO版本
PRO专属功能:
预设警报:方便用户为赢利性变动和统计学结果设置警报。
统计功能:过去特定时间段的可赢利波动的百分比,波动百分比平均值和MACD周期计数。用户可以自定义时间幅度:可以用天数,小时数,蜡烛数(上至Tradingview最大回溯值)
本指标用户可以申请免费试用两个月“Crypto Currency Profitability Rankings PRO with Customisable List (Invite Only)”
指标特征描述
本指标帮助交易员认知交易标的在不同时间维度的赢利潜力的变化。
对于日内交易,保持仓位是要承担风险和成本的,一种交易策略是只在波动率被激活至可赢利水平后才开仓位。
本指标计算和展示赢利潜力-基于MACD周期的波动百分比,用颜色来突出高赢利性的波动周期。方便交易员辨识非交易区间,新趋势的开始和旧趋势的衰减。
多时间维度:本指标为日内交易设计,因此建议使用时间维度:3m,5m,15m,30m,1H; 如果用户需要,也可以用于其他不大于1D的维度。
盘整区的一般特征:当波动率消减时,波动率低于可赢利门槛,呈现灰色; 或者小的绿色和红色波动率间隔出现。
新趋势的开始:在盘整后期,新出现的绿色或者红色波动率可能标识着新趋势的开始。
旧趋势的衰减:以上升趋势为例,当绿色波动率逐渐缩小,而红色波动率开始出现时,可能标识着上升趋势衰减。
设置:盈利能力阈值:用户自定义的MACD单次波动的可赢利的百分比,默认为0.8%
免费试用两周:跟帖评论, 要求试用,您应该会在48小时内获得访问权限。 如果没有获得,请私信作者。
相关指标:
Crypto Currency Profitability Rankings Standard with popular list (Protected) 加密货币赢利潜力排行指标 标准版 热门列表: 指标计算和比对一组热门虚拟货币的可赢利属性 - 基于MACD波动周期和用户自定义的时间周期,帮助交易员发掘最适合自己赢利和风险偏好的交易品种。
Crypto Currency Profitability Rankings PRO with Customisable List (Invite-Only): 加密货币赢利潜力排行指标 PRO 自定义列表
试用开发者的其他指标
www.tradingview.com
免责声明:在要求获得本指标使用权之前以及在使用本指标之前,用户认可已经完全了解和接受:本指标仅供教育和研究目的, 它不提供任何赢利的可能性。
本指标的开发者并非专业投资顾问,因此不对用户的任何赢亏负责。
用户应独立判断,审慎评估并自负投资和交易风险!
最新更新会覆盖之前的说明。 请检查更新。
Profitability Meter for Day Trading [GO8686]Disclaim:
By using or requesting access to this indicator, you acknowledge that you have read and accepted that this indicator is for study purposes only and it does NOT guarantee you will make money.
I am not financial adviser and I am NOT responsible for any profits or losses you may incur by using this indicator.
Users should make their own decisions, carefully assess risks and be responsible for investment and trading activities.
Indicator Description
Visibility:Protected
This indicator helps traders understand the movements of the underlying profitability of a trading security in different time dimensions.
For day trading, keeping a position is risky and costly, a popular strategy is to open a position ONLY when volatility is active, in other words, only when profitability is back.
This indicator calculates and displays price movement percentage of MACD cycles, highlights those MACD cycles that are over the profitability threshold, helping traders identify range area, the start of a new trend and the fading of a trend.
Multiple time frames: This indicator is designed for day trading, so suggested time frames are: 3m, 5m, 15m, 30m, 1H. Users can try other time frames (< 1D) if they find it useful.
Range area in general: a small green column and a small red column appear alternately, or most columns are gray within the period.
The start of a new trend: an outstanding green or red column means the MACD cross brought a price change that was higher than the profitability threshold, which could mean a new trend, especially when it was from a range area.
The fading of a trend: for instance, when green columns are getting smaller and red columns appear, a fading of bull trend could be on the way.
Format Configuration:
Profitability Threshold: a percentage of price movement within a MACD cycle that a user thinks is good to define profitability, defval: 0.8%.
PRO Version of this Indicator: Profitability Meter for Day Trading - PRO (Invite-Only)
Alert Function: allowing user to set alert for price change with profitability, or set alert for statistics results.
Statistics with Customisable Time Span: Percentage of MACD cycles with profitability, the average of price change(%) and MACD cycles count. Users can customize the time range by days,hours or bars (up to the maximum backtracking value that Tradingview allows).
Related Indicators:
Crypto Currency Profitability Rankings Standard with Popular List (Protected):
This indicator calculates and generate a ranking of profitability from a popular list of crypto currencies, based on MACD cycles within user-defined time span, helping crypto traders to find the trading securities that suit their risk and volatility preference.
Crypto Currency Profitability Rankings PRO with Customisable List (Invite-Only): Contact the author for a free trial.
List of the author's Indicators
www.tradingview.com
The latest updates override the previous description. Please check the updates.
日内交易盈利潜力指示仪
免责声明:在要求获得本指标使用权之前以及在使用本指标之前,用户认可已经完全了解和接受:本指标仅供教育和研究目的, 它不提供任何赢利的可能性。
本指标的开发者并非专业投资顾问,因此不对用户的任何赢亏负责。
用户应独立判断,审慎评估并自负投资和交易风险!
指标特征描述
本指标帮助交易员认知交易标的在不同时间维度的赢利潜力的变化。
对于日内交易,保持仓位是要承担风险和成本的,一种交易策略是只在波动率被激活至可赢利水平后才开仓位。
本指标计算和展示赢利潜力-基于MACD周期的波动百分比,用颜色来突出高赢利性的波动周期。方便交易员辨识非交易区间,新趋势的开始和旧趋势的衰减。
多时间维度:本指标为日内交易设计,因此建议使用时间维度:3m,5m,15m,30m,1H; 如果用户需要,也可以用于其他不大于1D的维度。
盘整区的一般特征:当波动率消减时,波动率低于可赢利门槛,呈现灰色; 或者小的绿色和红色波动率间隔出现。
新趋势的开始:在盘整后期,新出现的绿色或者红色波动率可能标识着新趋势的开始。
旧趋势的衰减:以上升趋势为例,当绿色波动率逐渐缩小,而红色波动率开始出现时,可能标识着上升趋势衰减。
设置:盈利能力阈值:用户自定义的MACD单次波动的可赢利的百分比,默认为0.8%
高级版本功能: Profitability Meter for Day Trading - PRO (Invite Only)
预设警报:方便用户为赢利性变动和统计学结果设置警报。
统计功能:过去特定时间段的可赢利波动的百分比,波动百分比平均值和MACD周期计数。用户可以自定义时间幅度:可以用天数,小时数,蜡烛数(上至Tradingview最大回溯值)
相关指标:
Crypto Currency Profitability Rankings Standard with popular list (Protected) 加密货币获利机会排行指标 标准版 热门列表(保护,开放使用权): 指标计算和比对一组热门虚拟货币的可赢利属性 - 基于MACD波动周期和用户自定义的时间周期,帮助交易员发掘最适合自己赢利和风险偏好的交易品种。
Crypto Currency Profitability Rankings PRO with Customisable List (Invite-Only): 加密货币获利机会排行指标 PRO - 自定义列表
试用开发者的其他指标
www.tradingview.com
最新更新会覆盖之前的说明。 请检查更新。
MTF Deviation - Mtrl_ScientistHi everyone,
There are a lot of possible ways to look at markets and find valid patterns.
This time, I've looked at how shorter time frames deviate from the overall price consensus.
What you're seeing here is a range-bound difference of the lowest time frame from the overall price consensus (baseline), represented as blue line.
When lower time frames agree with the baseline, the difference becomes 0.
Logically, this difference cannot deviate too much from the baseline, and to quantify that, I've added fib-levels based on a deviation percentage that depends on price volatility and can be adjusted in the settings.
How it works:
First of all, you need to switch to the 1min time frame to get access to the lowest time frame data.
Look at how the blue line follows the support/resistance fib levels.
Oversold conditions are usually given by entering the lowest red band, whereas overbought conditions are given by entering the upper red band.
However, there are also extreme cases, where the blue line exceeds the set fib levels. In that case, price will reverse with very high likelihood.
Alternatively you can also ping-pong between two fib levels for frequent small trades.
Note that this indicator doesn't use any security functions to access time frame data. Instead, I found a different way to avoid repainting.
At the moment I'm just playing around with this to see how I can improve it. Feedback is very welcome!

Trend Precognition - Mtrl_Scientist (arrow-only)Hey everybody,
Per request, I'm also adding the arrow-version to the updated base algorithm.
However, I advise everyone to also add the indicator version that I published previously.

Trend Precognition - Mtrl_ScientistHi everyone,
This is an updated version of my base algorithm "BTC Precognition". I've managed to remove some lag, while at the same time smoothing the curve (blue).
All you need to know about it is on the chart's legend. The arrows just correspond to the bottoms/tops of the blue signal curve (marked with green/red circles). However, predicting turning points is difficult and I'm still working on that. So for now, the signals are offset by 1 candle into the past. This means that all of your trades will be 1 candle late, unless you trade intrabar using your own intuition. As a help, I've also included the first derivative (black curve) that will tell you the slope of the blue curve. Remember, when the curve is about to turn, the slope becomes zero. However, you can anticipate this by looking at the slope's direction and guessing when it will cross the zero line.
This is still all work in progress, so invite-only.

Customer Request: Trend Precognition - Mtrl_ScientistHi everyone,
This is a private build specifically requested by one user.
There are options to enable/disable 4 additional algorithms, whereas the current setting only shows the base algorithm ("BTC Precognition").
The "warning" text indicates a possible trend change, and is based on overbought/oversold conditions that can be adjusted in the settings.

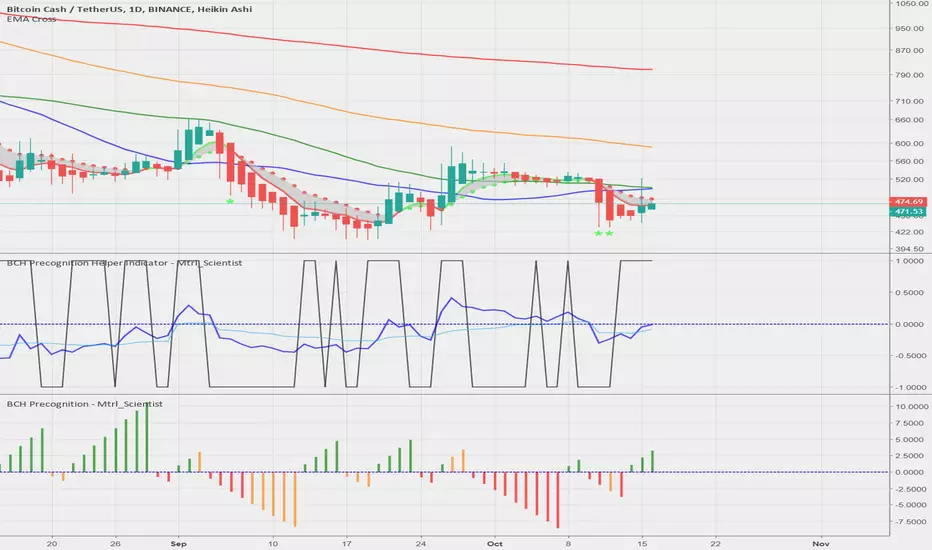
BCH Precognition - Mtrl_Scientist (study version)Hey everyone!
As requested, this is the study version of the improved 'BCH- Precognition' algorithm, meaning you'll only see the indicator and not have 'longs/shorts' painted on your chart.
- Works better with normal candles now, as internal calculations are forced to be done on Heikin Ashi, regardless of chosen candle format
- Turned into a study, rather than strategy, as not to interfere with strategies that are already in place
- Added Overbought/Oversold conditions (orange) with adjustable threshold, based on normalized price action helper indicator
Green means buy condition is valid, red mean short condition is valid, and orange means overbought/oversold (adjustable in settings).
Reminder: Only for use with BCHUSD, as it draws data for that coin from specific exchanges!
These changes were also added to the strategy version.
Please let me know what you would like to see improved!
BTC Precognition - Mtrl_Scientist (study version)Hey everyone!
This is the study version of the improved 'BTC - Precognition' algorithm, meaning you'll only see the indicator and not have 'longs/shorts' painted on your chart.
- Works better with normal candles now, as internal calculations are forced to be done on Heikin Ashi, regardless of chosen candle format
- Turned into a study, rather than strategy, as not to interfere with strategies that are already in place
- Added Overbought/Oversold conditions (orange) with adjustable threshold, based on normalized price action helper indicator
Reminder: Only for use with BTCUSD, as it draws data from specific exchanges!
I will also add these changes to the strategy version.
Please let me know what you would like to see improved!

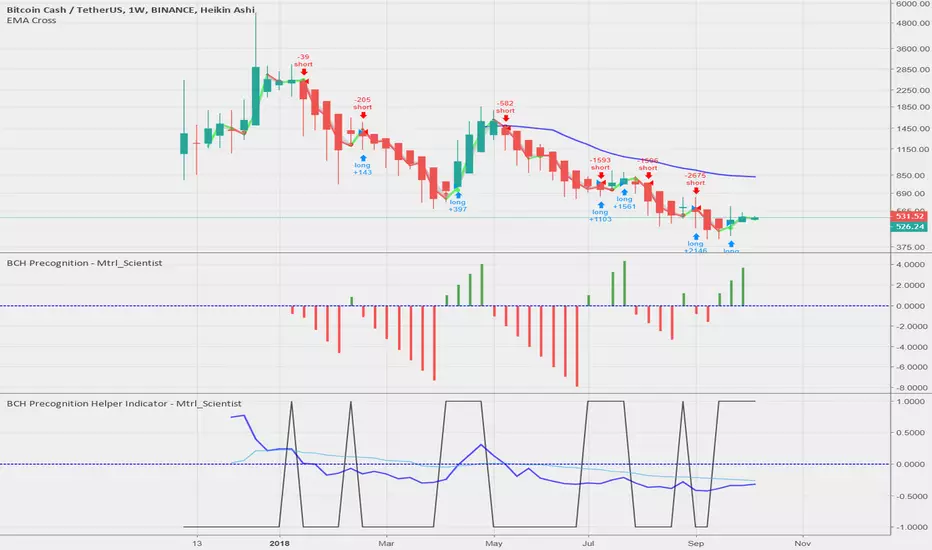
BCH Precognition - Mtrl_ScientistHello everyone,
Following up on my first bot, I've tuned my algorithm to work with Bitcoin Cash. In order to get rid of these nasty (and sometimes costly) indecision points, I've just enabled the 'Recalculated After Order Fill' option, which... well, recalculates the algorithm on the spot (instead of waiting for 1 additional bar) for situations where a signal is immediately followed by a conflicting signal, effectively cancelling it out. Obviously you have to rely on your own judgement if that happens in a real world scenario. However, in this simulated environment, this change resulted in a 0% risk, whereas the gain exceeded 800% with an initial capital of $100'000.
Again, in order for the results to be as accurate as possible, I've averaged the date from all major exchanges.
All of this is free to use for you, and you are welcome to share it.
If you like it, please give me a follow on Trading View & Twitter.
If you have any requests or suggestions/concerns, please let me know!
Note:
- This algorithm works best for Heikn Ashi candles, but I'm working on improving it for normal candles
- This is not financial advice (I'm in chemistry, not finance), so do your own research
Mtrl_Scientist
BTC Precognition - Mtrl_ScientistHello Everyone,
I have been interested in algorithmic trading for a while now, and have picked up coding in Python/C++ 2 years ago, which made it possible for me to understand Pine Script (Trading View's proprietary language) fairly easily. I got interested in Bitcoin in 2013, but have only started actually investing in mid 2017. Making money during a bull run is easy but it's really the bear market that teaches you a lesson. So I went about and tried to avoid losses in future bear markets by digging into the analysis of financial time series. I looked around and found useful books, examples of pine script code, technical analyses from fellow chartists and sought out to combine it all into algorithms that can help prevent losses during the next bear market.
I came up with several profitable scripts, but let this be the first one I'm actually sharing with you guys. It draws data from all major Bitcoin exchanges (Hence this script will ONLY work for BTCUSD ) and is based on CVI, Fractal Adaptive Moving Avergage ( FRAMA ), and some calculus operations to make sense of their relationship.
I tried to tidy the final version up as much as possible, so that it becomes straightforward to use. All you need to look at is when the bar becomes green/red, the bar height is just the integrated area since it's crossed the 0-line and can serve as a threshold on lower time frames to avoid noise.
I've got a degree in Chemistry, so don't take this as financial advice, but please do let me know what you think!
Note:
- This is a re-upload because the first version got pulled due to linking to Twitter
- Script works best with Hekin Ashi candles
Planned features:
- Reduce amount of signals on lower time frames
- Make it work better with normal candles
Suggestions?


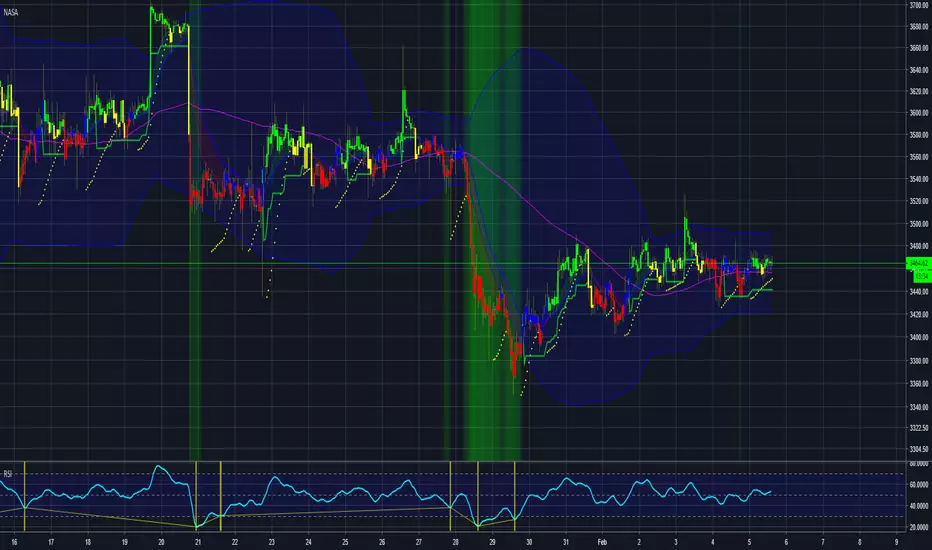
Crypto Low Frequency Trader [ALERTS] - NO REPAINTLow Frequency Trading Signals - Safe to trade with low leverage leverage and make a retirement fund.
Absolutely NO REPAINT.
Very conservative approach.
Works best on 1H chart.
This is the alerts indicator, check my profile for the strategy with backtest.
This Level of Strategy, will not be free. PM for access - Monthly Subscription.

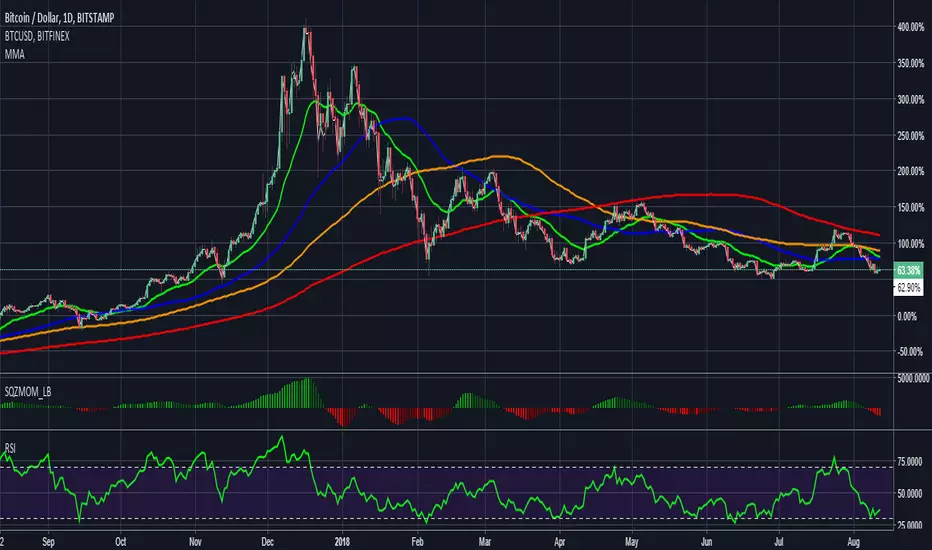
Heikin Ashi Trend StrategyStrategy Overview
Uses two timeframes to combine and identify trends for buying + selling securities. Works well on Bitcoin, currencies and indices.
Usage
This strategy should be used on 1-hour or 4-hour candles. Try it on 4-hour bitcoin for example.
Normal candles are fine but lead to more fakeouts. Heiken ashi candles lead to fewer trades and longer hodling of the trend but harder to enter/exit because Heiken Ashi candles are not true prices.
Strategy results
In my testing I ran the backtest from mid December onwards to capture the very tricky bear market that bitcoin has suffered. In this market it made huge profits from a $100k initial virtual account. Profit ratio is very high and trade success rate very high. However, a warning. In live trading it will flip BUY/SELL as the trend changes . This is a bug / flaw in the TradingView scripting engine in my opinion. It should not change past buy or sell signals. So to confirm the trend signal you want to see at least one block of the orange indicator complete or maybe use this indicator in combination with other.
Watch it for confirmation of keeping in existing trades and don't do everything it says as it says or bet the farm or you may rekt. Would recommend paper trading to understand the indicator + the signals.
My advice would be not to short an uptrend and not to long a downtrend. Some of the most profitable trades are with the trend and not the whips + saws.
Inputs
Trade Short? Default false. When true generates short trades not just close long
Backtest Start Year/Month/Day. Limits the backtest window to a certain timeframe to test tricky markets
Higher Timeframe: The length of the higher timeframe to monitor
Lower timeframe: The length of the lower timeframe to monitor
Show trades? When true shows the buy sell trades and performs the backtest. When false its just an indicator
Tips!
Any tips would be gratefully received. My addresses are as follows:
BTC: 35m8CyMQeWCezRUzQdaH3qEBpEyzSPAazS
ETH: 0xD09605A5D9ef9768e5AE17A74A5f0D42c97eC3a9
LTC: MV9yLEFoM5R8sgCHdeaehH3owjLni8FFz1

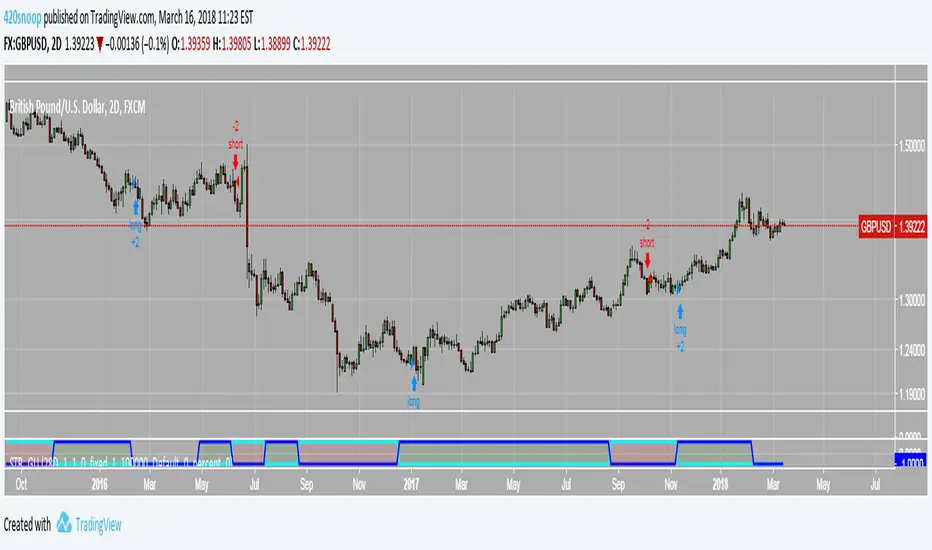
GBPUSD Strength [420]Similar to EU str but optimized for GU
This one has alerts and some other features
Msg me for access :)
xoxo
snoop
(link to euro/dollar old version no alerts etc)
Magic Moving Averages!Magic Moving Averages! is an indicator that comes standard in many forex trading platforms, and now on Tradingview designed for comfortable readability! It incorporates a series of simple moving averages plotted together with increasing periods. Finding a good trade with this is easily found with a set of rules. I took a course with Alex du Plooy on these rules and am using his suggested default values, however there are many more teachers of this method that have various rules that may be similar. If you desire a greater MA spread simply increase the MA Separation value in the input. Best for 15 mins or longer charts.
Happy trading
Vix FIX / StochRSI StrategyThis strategy is based off of Chris Moody's Vix Fix Indicator . I simply used his indicator and added some rules around it, specifically on entry and exits.
Rules :
Enter upon a filtered or aggressive entry
If there are multiple entry signals, allow pyramiding
Exit when there is Stochastic RSI crossover above 80
This works great on a number of stocks. I am keeping a list of stocks with decent Profit Factors and clean equity curves here .
Possible ways to use this:
Modify this script and setup alerts around the various entries
Use as is with different stocks or currency pairs
Modify entry / exit points to make it more profitable for even more symbols and currencies
