Pullback Screener Pro [LevelUp]Pullbacks are often considered high-probability entry points within trending markets. This screener helps streamline the search for such opportunities using trend analysis through customizable moving averages, price action and volatility filters with ATR (Average True Range).
🔹 Why Trade Pullbacks
Pullbacks represent temporary counter-moves within a broader trend. Instead of chasing extended moves, traders can enter at more favorable price levels.
Pros
▪ Improved Entry Prices : Entering closer to support or resistance levels often provides a better risk/reward ratio.
▪ Trend Alignment : Pullbacks occur within established trends, allowing traders to participate in potential continuation moves.
▪ Defined Risk Levels : Key moving averages and recent swing points can be used to set stop-loss orders.
Cons
▪ Not all pullbacks resume the trend; some signal reversals.
▪ Price can temporarily overshoot levels, creating whipsaws.
▪ Pullback strategies work best in trending markets and may underperform in sideways conditions.
🔹 Custom Feature : Require Lower Low
The optional requirement for a lower low may help confirm that an actual pullback is occurring, rather than just sideways chop or continuation strength.
Stricter Definition of a Pullback
▪ A pullback implies some retracement against the prevailing trend.
▪ By requiring a lower low, you ensure price is genuinely pulling back, not just consolidating at the highs.
Avoids False Triggers
▪ Without this filter, you might catch stocks that simply paused for a bar (small doji, tiny inside candle) but haven’t really pulled back.
▪ The lower low condition filters for bars where sellers actually pushed price down.
Improves Entry Timing
▪ Many traders want to enter as pullbacks are maturing, not while price is still pushing higher.
▪ A lower low shows some weakness that may soon transition into support, giving a cleaner “buy-the-dip” opportunity.
Psychological Confirmation
▪ From a trader psychology standpoint, a lower low indicates that at least some holders are taking profits and that short-term participants are testing the trend.
▪ This is often the moment when strong hands step in if the trend is healthy.
🔹 Custom Feature : Specify Closing Range
Closing range % is another optional feature that can be very useful when scanning for pullbacks as it helps separate healthy retracements from weak price action.
Shows Buyer Support Within the Bar
▪ Closing near the top of the day’s range (e.g., above 60–70%) signals that even though price pulled back intraday, buyers stepped in and pushed it higher by the close.
▪ That strength is a good sign the pullback may be stabilizing.
Filters Out Weak Pullbacks
▪ If a stock closes near the low of the day, sellers are still in control — the “dip” might not be done.
▪ By requiring a higher Closing Range, you filter out setups that may keep falling.
Timing Advantage
▪ Many traders prefer entering when a pullback shows early signs of turning.
▪ A strong closing range is an objective way to catch that transition, often right before the next leg higher.
Psychological Read
▪ Closing strength suggests demand is stepping back in — traders and investors still want exposure to the trend.
▪ It reflects confidence, whereas weak closes show hesitation or distribution.
🔹 Custom Feature : ATR % Filter
Specifying an ATR (Average True Range) filter is helpful when scanning for stocks because it normalizes volatility relative to price, enabling traders to identify stocks with suitable price movement for their strategy while managing volatility by filtering out excessively erratic stocks (high ATR %) or those with insufficient movement (low ATR %), thus aligning with risk tolerance and optimizing position sizing and stop-loss placement.
Focus on Stocks With Tradable Volatility
▪ ATR measures how much a stock typically moves in a day.
▪ By setting a minimum ATR, you avoid slow, low-volatility stocks that don’t move enough to create good opportunities.
Filters Out “Too Wild” Stocks
▪ Extremely high ATR stocks can be erratic, difficult to size properly, and risky to trade.
▪ By specifying a maximum ATR (or ATR % relative to price), you can avoid setups where risk is too unpredictable.
Normalizes Price Differences
▪ A $20 stock and a $200 stock can’t be compared just on raw dollar moves.
▪ ATR (or ATR as a % of price) gives a volatility-adjusted way to compare them, so your screen is consistent across all price levels.
Improves Entry & Stop Placement
▪ Knowing that a stock typically moves, say, 2% daily versus 0.5% daily helps you set realistic stops and targets.
▪ Screening for stocks with ATR in your preferred range means trades will line up better with your risk/reward model.
Psychology
▪ ATR captures behavior. Stocks with healthy, steady volatility attract active traders because they offer movement without chaos.
▪ Too quiet = boring, too wild = stressful. ATR filters help you stay in the sweet spot.
🔹 Customization Options
With extensive customization options, traders can fine-tune pullback scans by adjusting moving averages, proximity to those averages, bar structure, closing range strength, and volatility filters. This flexibility supports different trading styles, timeframes, and risk preferences.
Configurable Moving Averages
Scanning is optimized for daily and weekly timeframes.
▪ Select up to three moving average lengths and types (e.g. 20 EMA, 50 SMA, 200 SMA) for daily and weekly timeframes.
▪ Tailor scans to different trading styles:
• Short-term traders may prefer faster averages (e.g. 10–20 EMA).
• Swing traders often use medium-term averages (e.g. 50 SMA).
• Long-term investors may focus on slower averages (e.g. 200 SMA).
Pullback Within X % of Moving Average
▪ Specify the total range of a pullback using % above and % below a moving average. The bar low is used for this comparison.
▪ For example, .5% above and .5% below a moving average, giving price a total range of 1%. If the low is outside the range, it's not considered a valid pullback.
Require Low Lower
▪ Optional setting to require that the current bar to be a lower low compared to the prior bar.
▪ See above section for more information.
Closing Range %
▪ Specify a closing range to help you spot pullbacks where buyers are reasserting control.
▪ Define how close the closing price is to the daily high or low.
▪ See above section for more information.
ATR % Filter
▪ Incorporates volatility by measuring price movement relative to Average True Range (ATR).
▪ Options include:
• Above a specified ATR %
• Below a specified ATR %
• Within a specified ATR range
This options enables filtering for setups that align with volatility preferences and risk tolerance.
🔹 Trader Psychology
Pullback trading requires both patience and discipline. Understanding the psychology behind it can improve decision-making:
▪ Patience Over FOMO: Traders must resist the urge to chase extended moves. Waiting for a pullback often leads to better entries.
▪ Confidence in the Trend : Entering during a pullback can feel counterintuitive, as price is moving against the trend in the short term. Trusting the larger trend is essential.
▪ Managing Doubt: False pullbacks and whipsaws can create frustration. Keeping risk small and consistent helps maintain emotional balance.
▪ Discipline in Risk Control: Stops should be respected. Moving or ignoring stop-loss levels during a pullback can turn a small loss into a large one.
Successful pullback traders focus on process over outcome , knowing that consistency across many trades matters more than the result of any single trade.
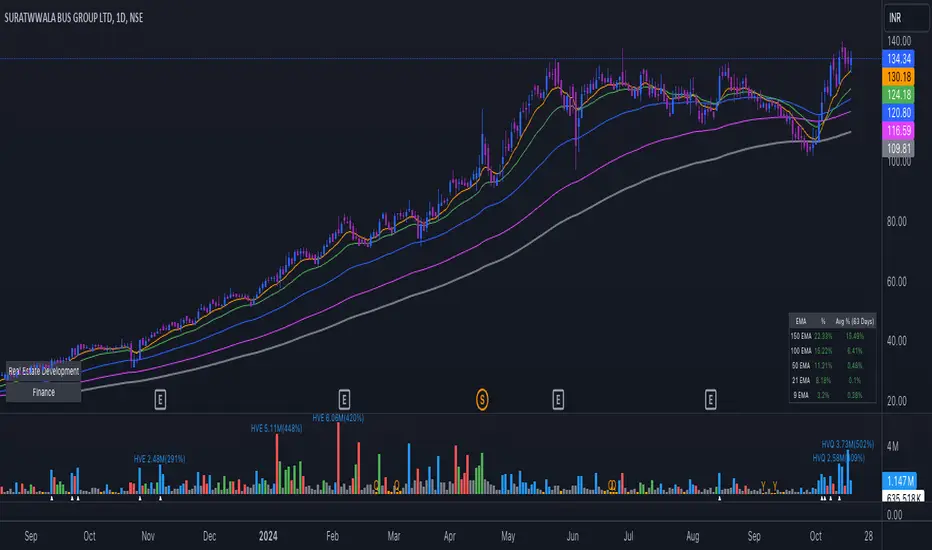
🔹 True Market Leader Pullbacks
▪ GEV: Pullback to 10-EMA and 21-EMA
▪ NVDA: Pullback to 50-SMA
🔹 Best Practices
▪ Trend First : Pullbacks are most effective when traded in the direction of the larger trend. Confirm trend strength before acting on screener results.
▪ Combine Filters : Use moving average, closing range, and ATR filters together for higher-quality setups.
▪ Chart Review : Always verify results visually before trading.
▪ Risk Management : Consider swing lows (uptrends) or highs (downtrends) to define stop-loss placement.
🔹 Summary
The Pullback Screener helps traders quickly locate potential opportunities where price retraces toward key moving averages within an ongoing trend. With customizable filters for moving averages, closing range, and ATR, the screener adapts to a wide range of strategies and risk profiles.
Pullback trading offers favorable entries and defined risk, but success requires patience, discipline, and confirmation of trend conditions.
付費腳本