Combo Month-to-Month % Return (January - June)This tool acts as Month-to-Month % Return but in Combo mode. Allows to compare the asset's monthly performances across the preferred years. It works everywhere but better in use on the daily timeframe.
變動率指標(ROC)
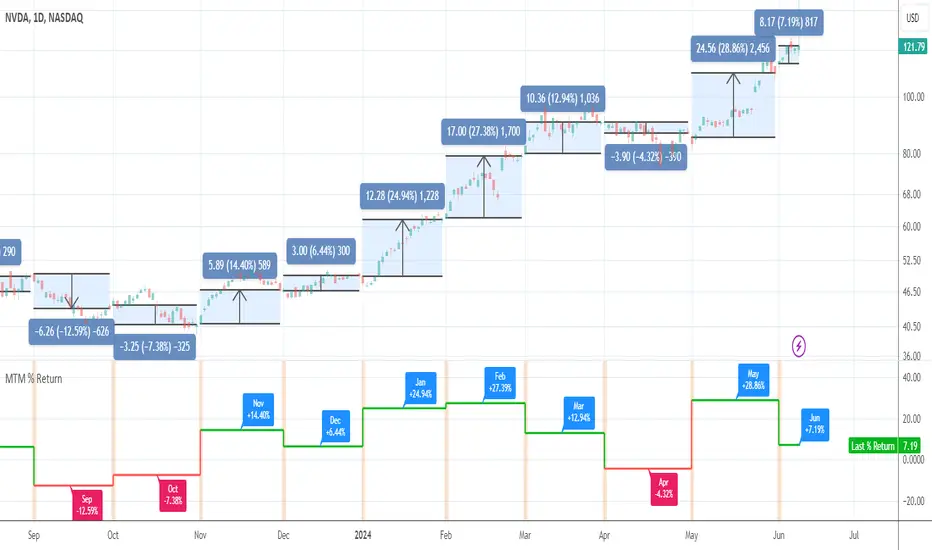
Month-to-Month % ReturnAn utility tool to see month-to-month performance of the asset and to eliminate the need in drawings. It works everywhere but better in use on the daily timeframe.
ROC Divergence — SharkCIAThis script helps to identify ROC pivot points and aims to show you when the trend has changed direction.

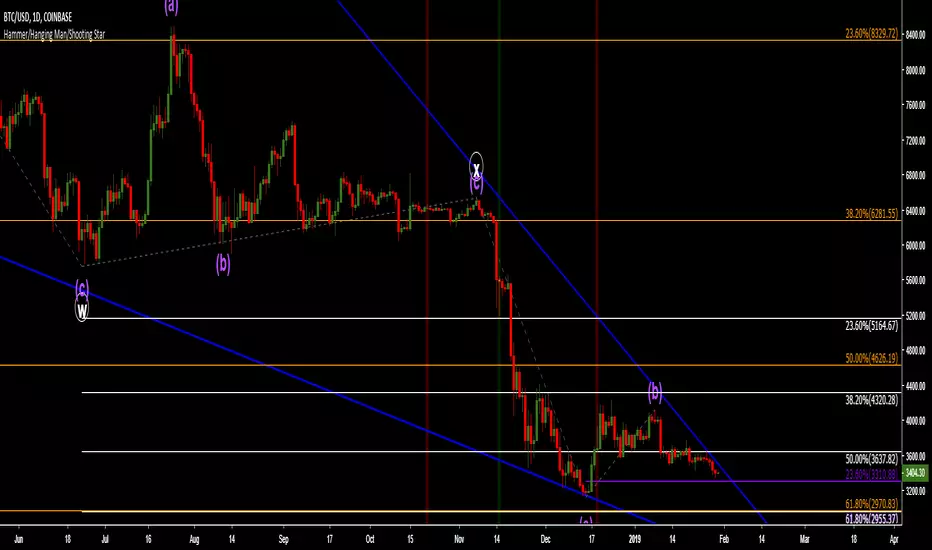
Hammer/Hanging Man/Shooting StarThe script highlights the Hammer, Hanging Man, and Shooting Star candlesticks on the main chart screen. Please use an oscillator that shows oversold and overbought conditions with this script.
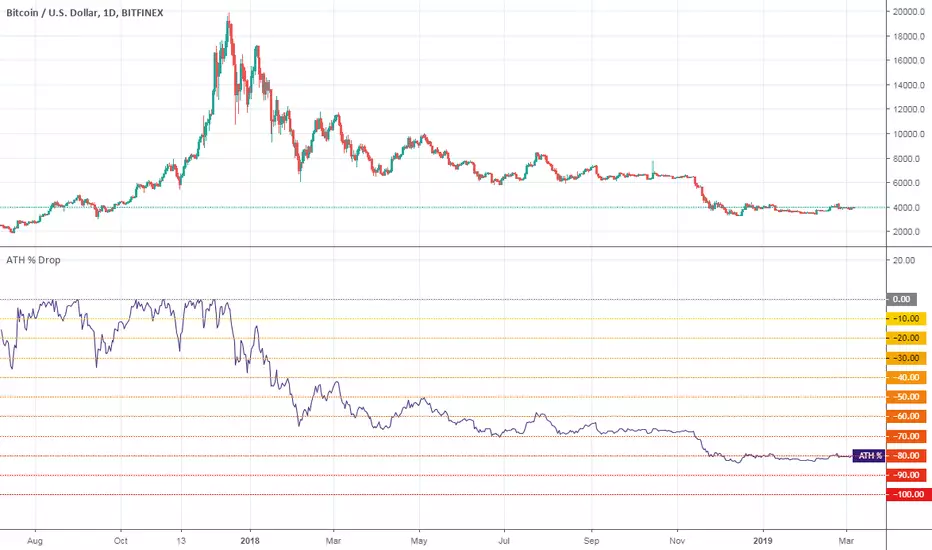
All-Time High % DropA utility tool to show price % drop since All-Time High.
Works on any ticker/instrument/asset.
Good luck!
Numeraire Market CapHello traders!
This is Market Cap chart of Numeraire cryptocurrency with some additional features.
What is included
Dynamic market capitalization chart
Customizable SMA of the market capitalization
Crossovers highlighting
Alerts for crossovers
Alert for the specified positive % change
Alert for the specified negative % change
How to get access
Buy for only 20$ to get lifetime access to this indicator
Like and follow for more cool indicators!
Happy Trading!

Waves Market CapHello traders!
This is Market Cap chart of Waves cryptocurrency with some additional features.
What is included
Dynamic market capitalization chart
Customizable SMA of the market capitalization
Crossovers highlighting
Alerts for crossovers
Alert for the specified positive % change
Alert for the specified negative % change
How to get access
Buy for only 20$ to get lifetime access to this indicator
Like and follow for more cool indicators!
Happy Trading!

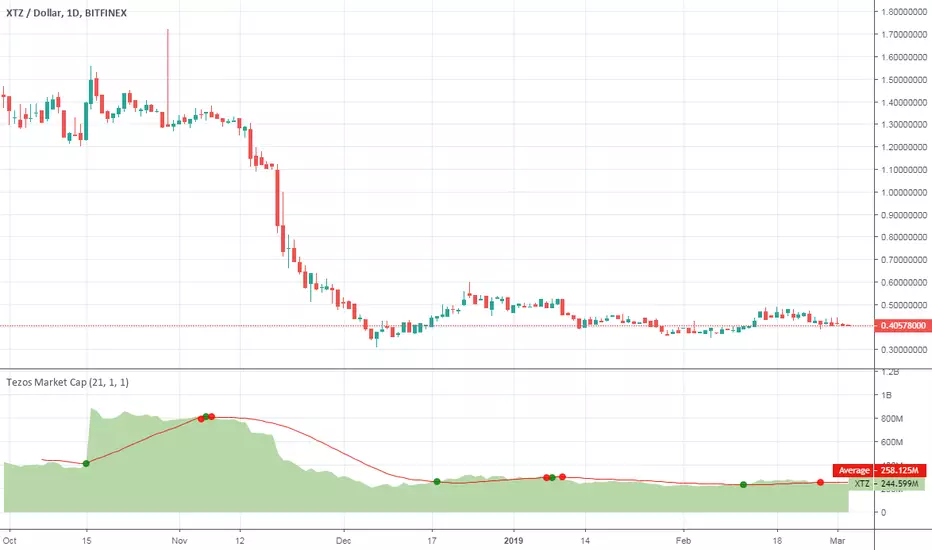
Tezos Market CapHello traders!
This is Market Cap chart of Tezos cryptocurrency with some features.
What is included
Dynamic market capitalization chart
Customizable SMA of the market capitalization
Crossovers highlighting
Alerts for crossovers
Alert for the specified positive % change
Alert for the specified negative % change
How to get access
Buy for only 20$ to get lifetime access to this indicator
Like and follow for more cool indicators!
Happy Trading!
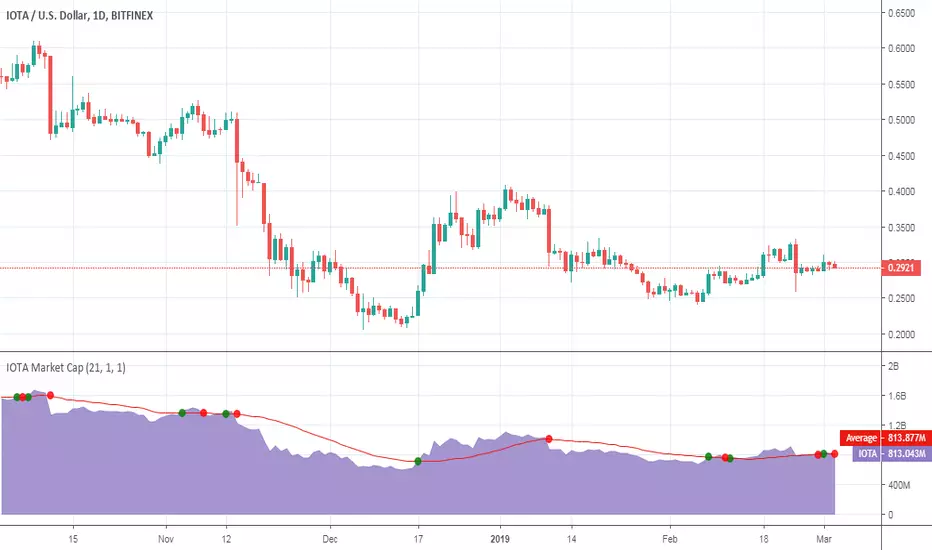
IOTA Market CapHello traders!
This is Market Cap chart of IOTA cryptocurrency with some features.
What is included
Dynamic market capitalization chart
Customizable SMA of the market capitalization
Crossovers highlighting
Alerts for crossovers
Alert for the specified positive % change
Alert for the specified negative % change
How to get access
Buy for only 20$ to get lifetime access to this indicator
Like and follow for more cool indicators!
Happy Trading!
Zcash Market CapHello traders!
This is Market Cap chart of Zcash cryptocurrency with some features.
What is included
Dynamic market capitalization chart
Customizable SMA of the market capitalization
Crossovers highlighting
Alerts for crossovers
Alert for the specified positive % change
Alert for the specified negative % change
How to get access
Buy for only 20$ to get lifetime access to this indicator
Like and follow for more cool indicators!
Happy Trading!

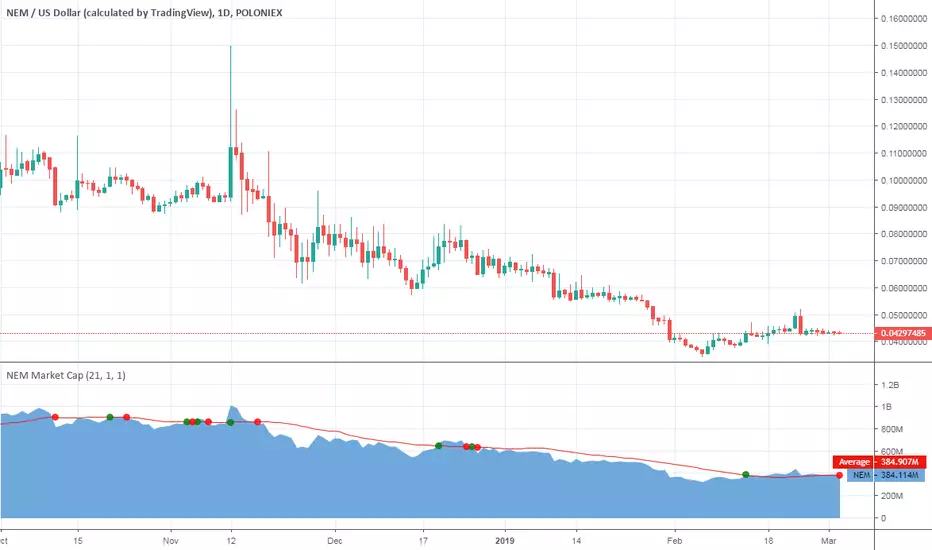
NEM Market CapHello traders!
This is Market Cap chart of NEM cryptocurrency with some features.
What is included
Dynamic market capitalization chart
Customizable SMA of the market capitalization
Crossovers highlighting
Alerts for crossovers
Alert for the specified positive % change
Alert for the specified negative % change
How to get access
Buy for only 20$ to get lifetime access to this indicator
Like and follow for more cool indicators!
Happy Trading!
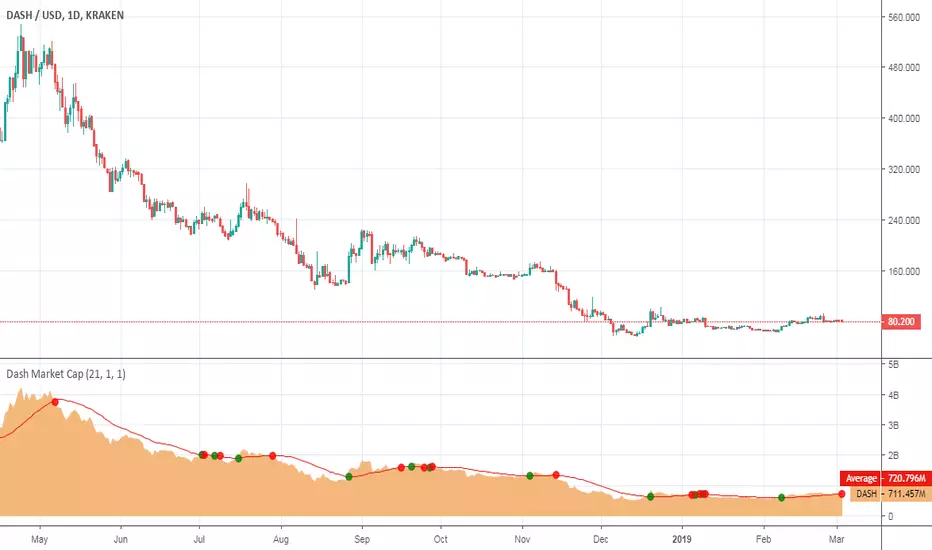
Dash Market CapHello traders!
This is Market Cap chart of Dash cryptocurrency with some features.
What is included
Dynamic market capitalization chart
Customizable SMA of the market capitalization
Crossovers highlighting
Alerts for crossovers
Alert for the specified positive % change
Alert for the specified negative % change
How to get access
Buy for only 20$ to get lifetime access to this indicator
Like and follow for more cool indicators!
Happy Trading!
[RESEARCH] Rate of ChangeHello traders and developers!
I was wondering how built-in "roc" function in Pine is defined and calculated so I made a little research.
I examined 4 samples:
1) "roc" function itself
2) "roc" according to its description
3) price change ratio
4) price percent change ratio
The results of the first and fourth samples are identical.
So, TV built-in roc(source, length) = 100 * change(source, length) / source .
And it's description is incorrect.
If you didnt know it - now you know it.
Good luck!

🥢 Crypto-Sticks: Rate of Change v1.0 by Cryptorthyhms🥢 Crypto-Sticks™ Rate of Change
A new series of indicators brought to you by Cryptorthyhms...giving you an alternate look at your trusted favorites!
🚀 Indicator Specific Info
⛔Please remember that you will have to adjust the ROC overbought and oversold levels to suit the volatility of the instrument you are working with. In the future I will implement a feature that does this automatically, but for now its manual.
The OB/OS zones are given in two levels, because often you can find a line of best fit that will hit "small movements" and one that will hit "big movements." In this case I chose 2 and -2 for the small zones. For the bigger zones i chose 5 and -5.
Heiken Ashi candles adds some more clear trend changing points which can be executed at the second candle going in either direction. Other coins/charts will require their own strategy - you could potentially have to tweak that parameter. In this example you would enter on 2nd green, exit on 2nd red.
Volume weighting the HA candles adds a different dimension to the indicator which I have to explore more fully.
Since WTI doesnt have volume, this feature is irrelevant for this chart.
💭Please leave me any ideas or feedback you have!
🚫If you use volume weighting you should be on heiken candles.
🚀 Crypto-Sticks General Info
🚧This series isnt polished 100%, and I have some more options I will add in the future. But for now, I want to just release them, as I am not sure when I will have the time to put more work into them (many other big projects I am working on).
📊Its basically reinterpretations of all your favorite indicators. I calculate the values a little bit differently than normal, but the end result is creating a candlestick chart (for the indicator!). Then I added the option to plot them as Heiken Ashi candles to smooth out noise and make signaling easier. Here's how it looks as Heiken Ashi:
🔊Lastly I implemented a Volume Weighting system for them all which simply integrates volume into the formulas for these indicators. For the most part this feature is experimental and doesn't provide huge utility (yet - I have other ways I want to try it as well - just no time). Though on some of the indicators it already shows great promise.
👍Enjoying this indicator or find it useful? Please give me a like and follow! There are many more indicators to be released in this series, not to mention I post crypto analysis and other free indicators regularly.
💬Questions? Comments? Want to get access to an entire suite of proven trading indicators? Come visit us on telegram and chat, or just soak up some knowledge. We make timely posts about the market, news, and strategy everyday. Our community isnt open only to subscribers - everyone is welcome to join.

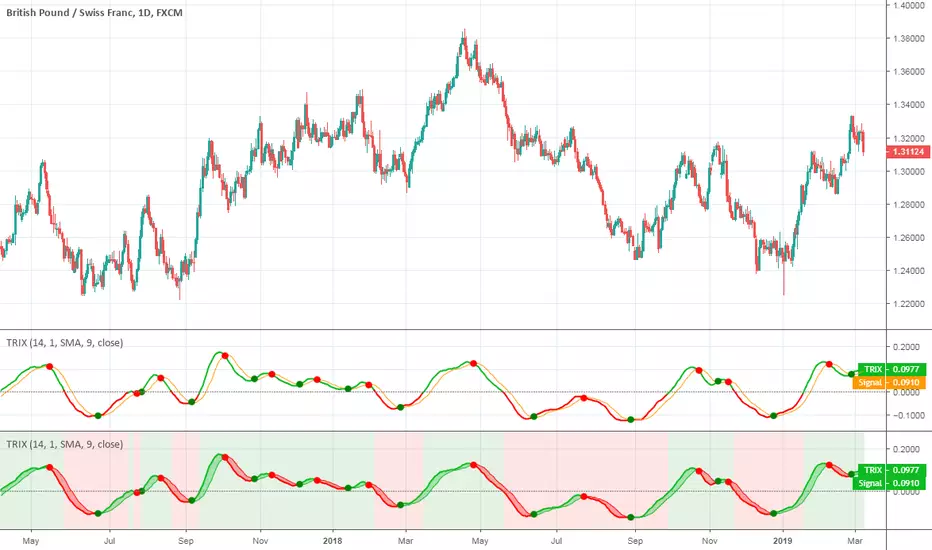
TRIXThis indicator was originally developed by Jack K. Hutson (Stocks & Commodities (July 1983): "Good TRIX").
Percent Change Smoothed (PCT + EMA)ROC works great on data with only positive numbers (like prices).
But it fails to correctly represent the rate of change when source series have negative values.
ROC is positive when:
Source is positive AND Source is rising
OR Source is negative AND Source is falling
Percent change (PCT) is just a ROC that deals with this sign confusion.
Anyone with Data Science backgroud would likely know about it.
PCT is positive only when:
Source is rising
When applying to only positive data PCT = ROC they are exactly equal.
I've also added EMA smoothing option.
Enjoy!

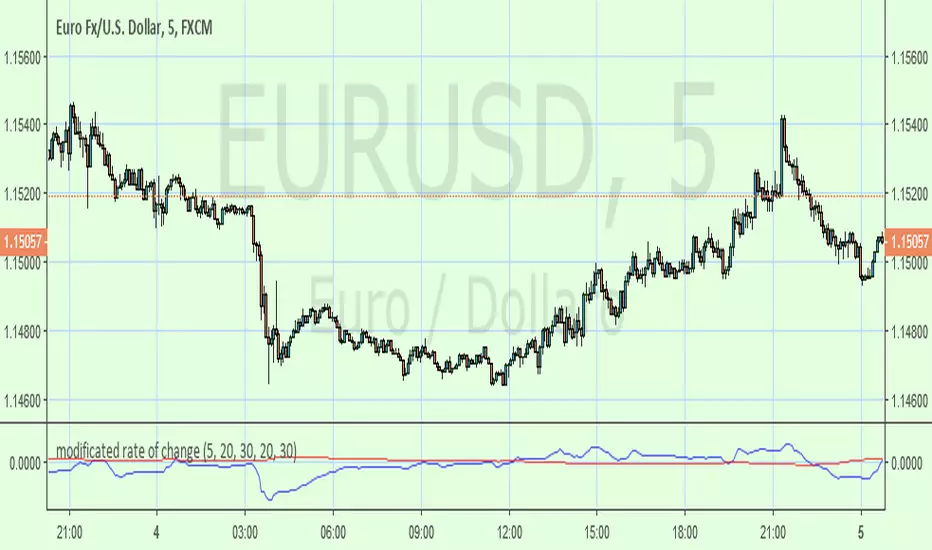
modificated rate of changeBased on ROC this indicator has been smoothed with filter and the zero line changed by a longer period of inverted ROC filtred as well . Buy/sell at the cross.
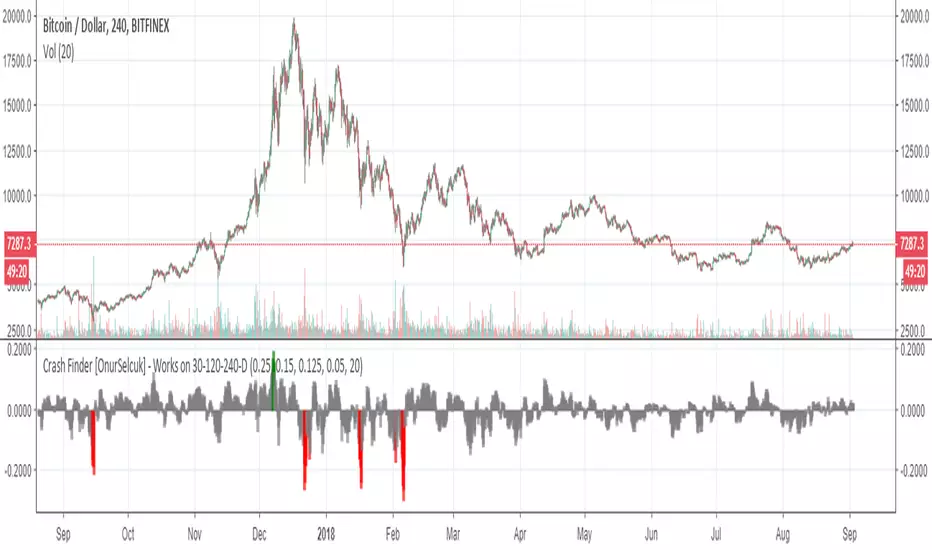
Crash Finder [OnurSelcuk] - Works on 30-120-240-D V.1This indicator helps you to find possible bottoms and tops. Works only 30-120-240-Daily pattern.
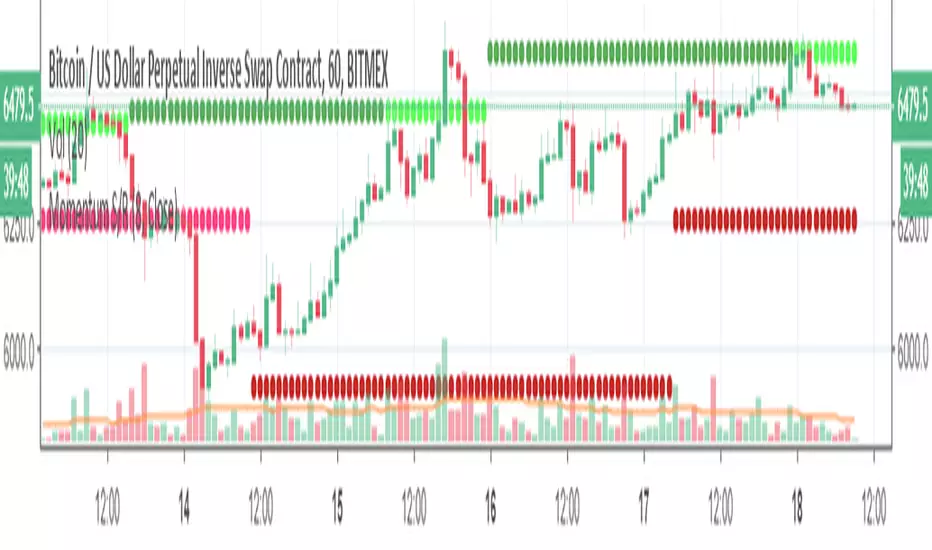
Momentum S/R (w/ confirmations)A momentum based approach to finding support/resistance, with the S/R lines changing color if price action confirms it as support or resistance.
These lines only track the most recent significant support or resistance, so the price can end up above or below both lines. In that case there is an option to "Plot Higher High" or "Plot Lower Low", which will attempt to find a previous weekly top/bottom that is above/below the current price.

Closing Leverage and Rate of ChangeShows BTCUSDLONGS vs BTCUSDSHORTS along with their rate of change on a scale that's friendly for a combined indicator. ROC is increased proportionally so you can see it in relationship to Open Shorts and Open Longs on the same graph without zooming. I had been using an offset as well, but using an offset to adjust position causes the highs to look lower and it makes the lows look less low. It was significant enough to seem like a bad idea to include.
