Relative Strength LineRelative Strength Line compares equity's price performance with S&P 500 (default). The indicator will retrieve current equity value comparing it with S&P 500 equivalent time frame.
S&P 500 is set as the default index for comparison. This value can be change to any equity available in the market, located at the format settings of the indicator.
相對強弱比較(RSC)
Simple Currency Strength Measurer IVVersion IV of the SCSM, this time thanks to @SAACI I learned more about the financial markets and some math stuff. This time I switched the formula a bit to use Zscores:
(close-sma(close,shortma))/stdev(close,dev)
This creates a nice oscillator like view, if you overlay TWO of them, one longer and one shorter you can get almost perfect absolute highs and absolute lows. Enjoy.

Mansfield Relative Strength indicatorUse this indicator to compare how security is performing in compare with preferred index (SPX by default).
> 0 outperforming
< 0 underperforming
Works best for weekly, but can be applied to monthly and daily charts. It will be rather useless to use it in smaller timeframes
Apply it to SPX, industry index, sector index or other security in similar sector

Buy and Sell PressureBuy and sell pressure indicator, according to MY opinion of AI Brooks Price Action method (in particular the concept of buy and sell pressure that it presents).
As I have some difficulty in analysing the pressure from the context shown in the graphic, I have created an indicator that counts the bodies (and trend-favouring shadows) of the last bars, in order to reach a value that express the resulting pressure and direction (if in that time break the Market is more for buying or selling).
Taking this resulting direction as a basis and the applied moving average, the orange signal validates a favourable input pressure (the direction of the bar in the histogram suggests whether it is for buying or selling), and the green colour signal validates a more favourable pressure.
At last, the grey colour signal suggests that an operation in favour of the majority trend does not have as much support as the pressure resulting direction. Although, this does not mean that there are no possibilities of arising viable entries to be used against the trend (especially minority trends). This indicator will not track them.
I emphasize that the indicator is ONLY A VALIDATOR. Both input decisions and output decisions must be evaluated earlier by analysing the context presented by the graphic bars.

Relative Performance between between Stock and SPXSimply plots the close to close performance of your instrument vs SPX below your main chart
Offers further SMA of EMA of such relative performance to get a better idea of the relative strength against the major market
JSE Wyckoff WaveThe Stock Market Institute (SMI) describes an propriety indicator the "SMI Wyckoff Wave" for US Stocks. This code is an attempt to make a Wyckoff Wave for the Johannesburg Stock Exchange (JSE). Once the wave has been established the volume can also be calculated. Please see code for the JSE Wyckoff Wave Volume which goes with this indicator.
The Wave presents a normalized price for the 10 selected stocks (An Index for the 10 stocks). The theory is to select stocks that are widely held, market leaders, actively traded and participate in important market moves. This is only my attempt to select 10 stocks and a different selection can be made. I am not certain how SMI determine their weightings but what I have done it to equalize the Rand value of the stock so that moves are of equal magnitude. The then provides a view of the overall condition of the market and volume flow in the market.
I have used the September 2018 price to normalize the stock price for the 10 selected stocks based. The stocks and weightings can be changed periodically depending on the performance and leadership.
Most Indecies when constructed assume that all high prices and all low prices happen at the same time and therefor inflate the wicks of the bars. To make the wave more representatives for the SMI Wyckoff Wave the price is determined on the 5 minute timeframe which removes this bias. However, TradingView does not calculate properly when selecting a lower timeframe than in current period. A work around is to call the sma of the highs and add these which provides more realistic tails. Please, let me know if there is a better work around this.
The stocks and their weightings are:
"JSE:BTI"*0.79
"JSE:SHP"*2.87
"JSE:NPN"*0.18
"JSE:AGL"*1.96
"JSE:SOL"*1.0
"JSE:CFR"*4.42
"JSE:MND"*1.40
"JSE:MTN"*7.63
"JSE:SLM"*7.29
"JSE:FSR"*8.25

QQE AsYouWish IMQ Component v02 An AsYouWish component of Inigo Montoya's Quest, dynamic strategy. This is not a stand alone indicator. It is instead designed/skewed to provide RSI-based trade recommendations, immediately following a reversal stop-out. It's suitable for any time frame, from 1 minute to 1+day bars.


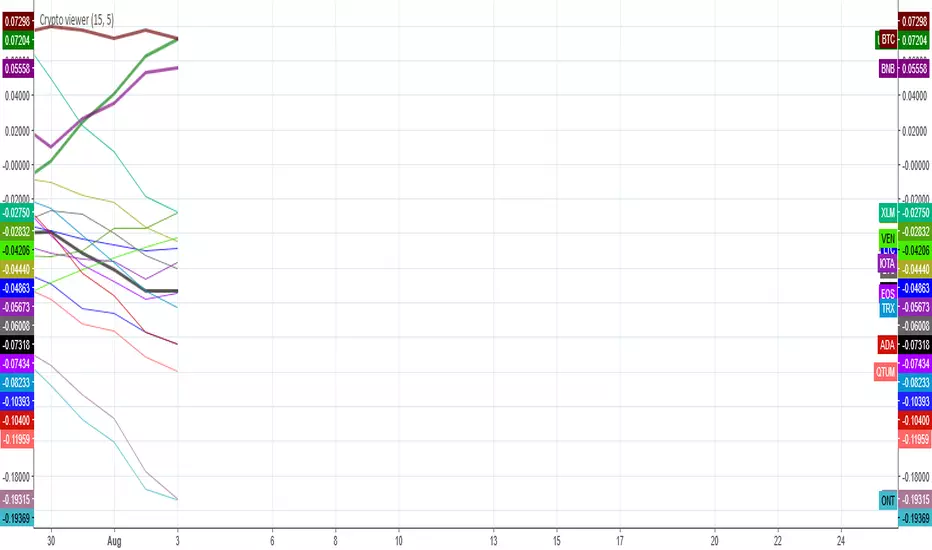
Crypto MeasurerI'm proud to finally announce the Crypto measurer!!!, 20 coins chosen from the selection available at Binance, you're free to modify the code to add your own coins or remove them or if you use another exchange.
This works similar to the SCSM, except it's for cryptos, never miss a PUMP & DUMP scheme again, don't get tricked into buying the losing coins anymore. The stronger coins are at the top while the losing coins at the bottom, works on any TF too, but be careful of volatility in lower TFs.
This picture is only of ETH and BTC, see how ethereum rallies in mid april until mid may, then bitcoin becomes the more dominating coin and remains like that, pushing ETH/BTC lower.
Again, here it's the chart for ETH and BNB, with the corresponding comparison.
And here is LTC/BTC to finish the comparisons.
Simple Currency Strength Measurer IIIThis is an updated version to the Currency Strength Measurer I created before. I'm not updating that script due to differences in the features and in the idea. The original script was a lagging indicator, I hope that this one is more of a leading indicator, the idea is the same. This indicator has way fewer inputs and it's more lightweight. Try it and compare it with the original SCSM and choose whichever suits your strategy best.
I'm open to comments or ideas on how to upgrade it.

Relative StrengthRelative strength is a ratio between two assets, most often a stock and a market average (index). This implementation uses the method described here and the second method described here to calculate its value: "To calculate the relative strength of a particular stock, divide the percentage change over some time period by the percentage change of a particular index over the same time period". This indicator oscillates around zero. If the value is greater than zero, the investment has been relatively strong during the selected period; if the value is less than zero, the investment has been relatively weak. The period and the comparative symbol can be set in the settings for the indicator (the defaults are 50 and SPX), there you can also find an option to turn on a moving average.
Relative StrengthCompare the strength of the current stock to a benchmark (default SPX).
Includes a SMA (default 13 weeks/3 months).
Best used on the weekly time frame.

RelSThis indicator is the measure of price trend of an instrument compared to another. For Dynamic Traders.

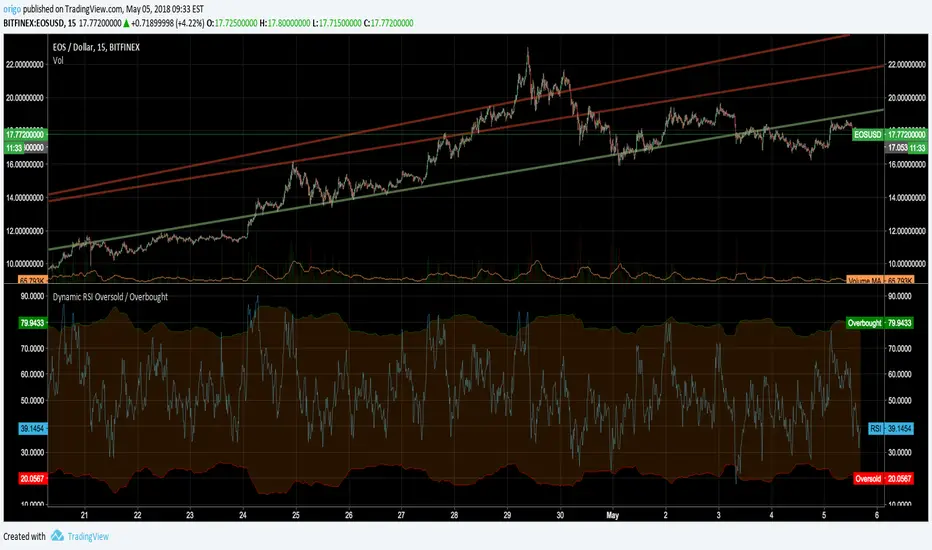
Dynamic RSI Oversold / OverboughtJust an idea I had about using the RSI stdev to find oversold / overbought signals. Might be useful..
C320up RSI Compare X2C320up RSI Compare X2
- Compare the strength of any two securities at once including Bitcoin and EOS shorts and longs.
Simply click on the Ticker Input, type the first letter or two of the security you wish to compare then select from the list.
All tickers listed on TradingView are available.
Default settings are a black line for the first ticker (Bitcoin), and gray for the second (EOS), with the RSI length set at 14.
You can change these colours to suit your preferences.
For example, let’s say you wanted to compare EOS shorts and longs, search for EOSUSDSHORTS and EOSUSDLONGS, and change the colour of the first line to red for shorts, and change the second to green for longs.
You can also change the background colour, and adjust the 70% and 30% lines to suit.
Any questions, just leave a comment.
Check out our scripts page for more indicators.
Happy Trading!

IBD Relative strengtHThis code is to replicate the relative strength indicator as used on investors.com (on lists like the IBD 50, big cap 20 etc).
Let me know if any issues / any updates wanted.

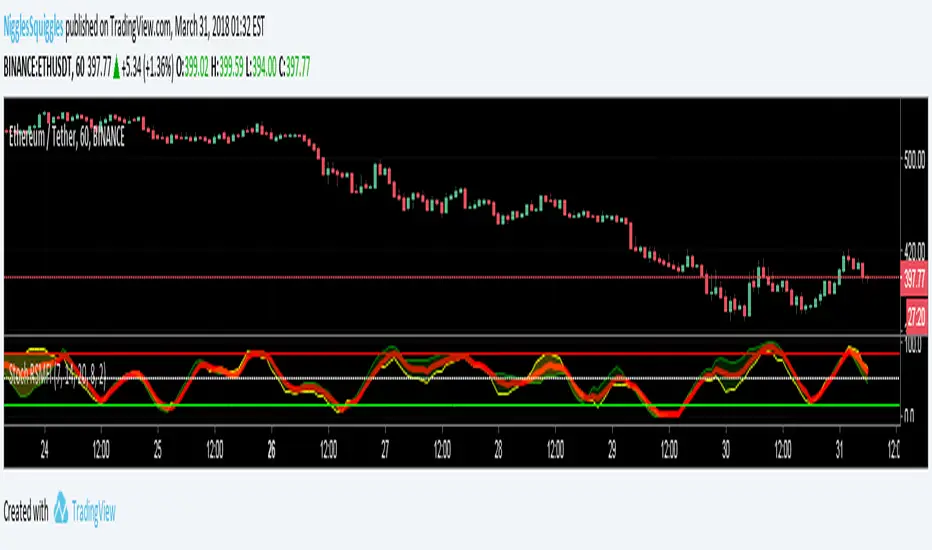
Stochastic RSMFI RibbonFor those of you who like to use the StochasticRSI, this indicator adds a StochasticMFI (Money Flow) into the mix, making it volume weighted.
The red signal line is the StochasticRSI and StochasticMFI averaged together.
The green and yellow ribbon is the two plot lines filled in and coloured depending on which is greater (RSI or MFI).
// Created 2018 - by @Squiggles#8806
// LTC Tip Jar: LX4bUBdjiRPsagUbZoAczSGgDC4YqTJL7w
Mansfield Relative Strength Multi TrendThis indicator is an advanced studie of 'Mansfield Relative Strength Trend' indicator
Since it is too time consuming to constantly change the index, I have developed a multi-index indicator.
The default order of the indexes is:
1. S&P 500
2. Dow Jones Industrial Average
3. Nasdaq Composite
4. NYSE Composite
5. DAX
You can change all indexes in the settings if you want.
*********************************
'Stan Weinstein' developed an indicator called Relative Strength which compares the relative strength of a stock with the associated index.
This indicator combines the relative strength with Weinstein's stage analysis.
The indiacator was made for weekly stock charts only!
BUY & HOLD Conditions (green):
1. Mansfield Relative Strength is above the zero line
2. Price is above the Simple Moving Average (30)
3. Simple Moving Average (30) is rising
SELL & HOLD Conditions (red):
1. Mansfield Relative Strength is below the zero line
2. Price is below the Simple Moving Average (30)
3. Simple Moving Average (30) is falling
It is recommended to end the trade when the trend changes.
*********************************
Please always remember, there is no holy grail indicator!
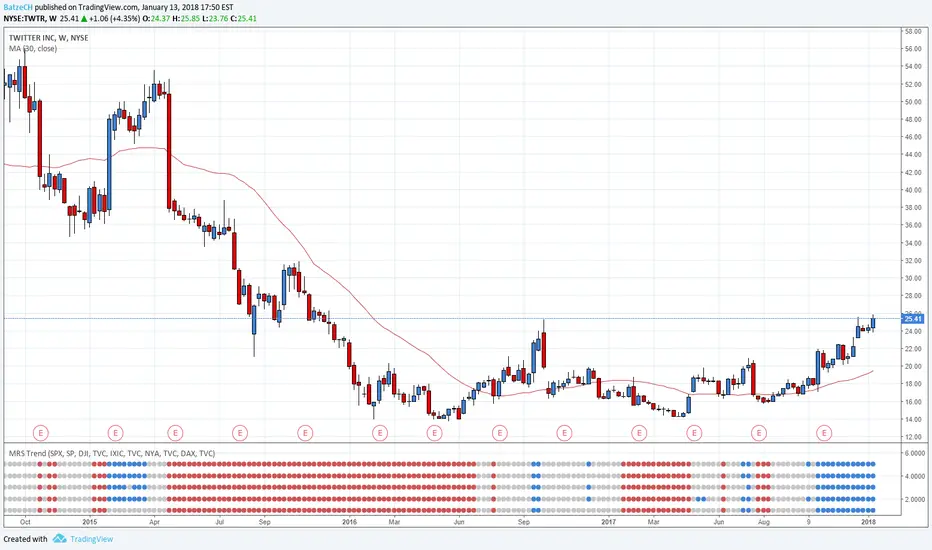
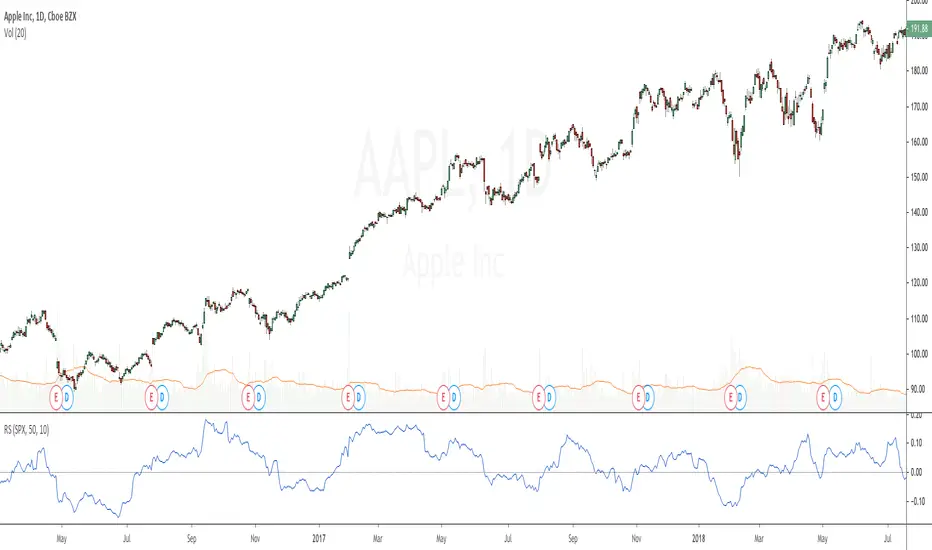
Mansfield Relative Strength Trend'Stan Weinstein' developed an indicator called Relative Strength which compares the relative strength of a stock with the associated index (in this case the S&P 500).
This indicator combines the relative strength with Weinstein's stage analysis.
The indiacator was made for weekly stock charts only!
BUY & HOLD Conditions (green):
1. Mansfield Relative Strength is above the zero line
2. Price is above the Simple Moving Average (30)
3. Simple Moving Average (30) is rising
SELL & HOLD Conditions (red):
1. Mansfield Relative Strength is below the zero line
2. Price is below the Simple Moving Average (30)
3. Simple Moving Average (30) is falling
It is recommended to end the trade when the trend changes.
Default index is S&P 500, but you can change the index in the settings if you want.
Please always remember, there is no holy grail indicator!

Currency StrengthRepublished: The original script violated house rules by including an external link to Backtest Rookies.
Background
The currency strength indicator takes up to 4 forex pairs and calculates the average strength across all pairs. The indicator uses the pair's daily percentage change to calculate the overall strength. For flexibility, it can accept any instrument as an input. This means you can use multiple instances to track various currency strengths. It was designed with the major pairs in mind but there is no reason why it cannot be used for other FX pairs.
Note: The indicator defaults to GBP. When setting it up for other currencies, be sure to flag whether the currency is a counter currency or not.
The code is provided free and open source. Please modify it as you see fit.
Screenshots
Defaults with Annotation
Yen strength beating pound strength
Opposing Trends

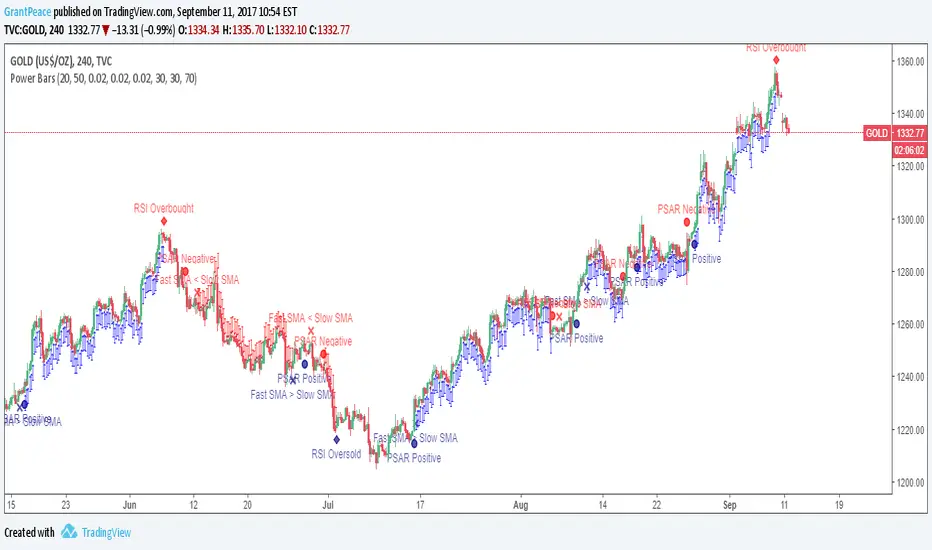
Power Bars This is the latest and greatest of technical analysis .
Values for your favourite indicators can easily be changed to customise your strategy.
When an indicator becomes bullish or bearish , a notification appears on the bar.
When all indicators align, Power Bars show up. Red Power Bars are bearish , blue Power Bars are bullish.
This is what the bars look like close-up.