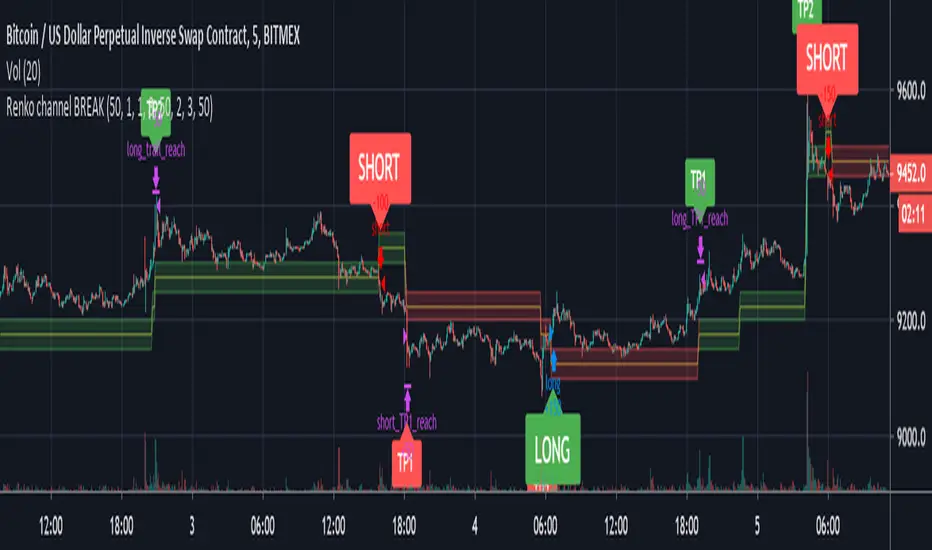
Renko channel BREAK (alert)This is the Alert version for Renko channel BREAK.
Please use this script after research the Strategy version!!
Renko

Backtesting on Non-Standard Charts: Caution! - PineCoders FAQMuch confusion exists in the TradingView community about backtesting on non-standard charts. This script tries to shed some light on the subject in the hope that traders make better use of those chart types.
Non-standard charts are:
Heikin Ashi (HA)
Renko
Kagi
Point & Figure
Range
These chart types are called non-standard because they all transform market prices into synthetic views of price action. Some focus on price movement and disregard time. Others like HA use the same division of bars into fixed time intervals but calculate artificial open, high, low and close (OHLC) values.
Non-standard chart types can provide traders with alternative ways of interpreting price action, but they are not designed to test strategies or run automated traded systems where results depend on the ability to enter and exit trades at precise price levels at specific times, whether orders are issued manually or algorithmically. Ironically, the same characteristics that make non-standard chart types interesting from an analytical point of view also make them ill-suited to trade execution. Why? Because of the dislocation that a synthetic view of price action creates between its non-standard chart prices and real market prices at any given point in time. Switching from a non-standard chart price point into the market always entails a translation of time/price dimensions that results in uncertainty—and uncertainty concerning the level or the time at which orders are executed is detrimental to all strategies.
The delta between the chart’s price when an order is issued (which is assumed to be the expected price) and the price at which that order is filled is called slippage . When working from normal chart types, slippage can be caused by one or more of the following conditions:
• Time delay between order submission and execution. During this delay the market may move normally or be subject to large orders from other traders that will cause large moves of the bid/ask levels.
• Lack of bids for a market sell or lack of asks for a market buy at the current price level.
• Spread taken by middlemen in the order execution process.
• Any other event that changes the expected fill price.
When a market order is submitted, matching engines attempt to fill at the best possible price at the exchange. TradingView strategies usually fill market orders at the opening price of the next candle. A non-standard chart type can produce misleading results because the open of the next candle may or may not correspond to the real market price at that time. This creates artificial and often beneficial slippage that would not exist on standard charts.
Consider an HA chart. The open for each candle is the average of the previous HA bar’s open and close prices. The open of the HA candle is a synthetic value, but the real market open at the time the new HA candle begins on the chart is the unrelated, regular open at the chart interval. The HA open will often be lower on long entries and higher on short entries, resulting in unrealistically advantageous fills.
Another example is a Renko chart. A Renko chart is a type of chart that only measures price movement. The purpose of a Renko chart is to cluster price action into regular intervals, which consequently removes the time element. Because Trading View does not provide tick data as a price source, it relies on chart interval close values to construct Renko bricks. As a consequence, a new brick is constructed only when the interval close penetrates one or more brick thresholds. When a new brick starts on the chart, it is because the previous interval’s close was above or below the next brick threshold. The open price of the next brick will likely not represent the current price at the time this new brick begins, so correctly simulating an order is impossible.
Some traders have argued with us that backtesting and trading off HA charts and other non-standard charts is useful, and so we have written this script to show traders what happens when order fills from backtesting on non-standard charts are compared to real-world fills at market prices.
Let’s review how TV backtesting works. TV backtesting uses a broker emulator to execute orders. When an order is executed by the broker emulator on historical bars, the price used for the fill is either the close of the order’s submission bar or, more often, the open of the next. The broker emulator only has access to the chart’s prices, and so it uses those prices to fill orders. When backtesting is run on a non-standard chart type, orders are filled at non-standard prices, and so backtesting results are non-standard—i.e., as unrealistic as the prices appearing on non-standard charts. This is not a bug; where else is the broker emulator going to fetch prices than from the chart?
This script is a strategy that you can run on either standard or non-standard chart types. It is meant to help traders understand the differences between backtests run on both types of charts. For every backtest, a label at the end of the chart shows two global net profit results for the strategy:
• The net profits (in currency) calculated by TV backtesting with orders filled at the chart’s prices.
• The net profits (in currency) calculated from the same orders, but filled at market prices (fetched through security() calls from the underlying real market prices) instead of the chart’s prices.
If you run the script on a non-standard chart, the top result in the label will be the result you would normally get from the TV backtesting results window. The bottom result will show you a more realistic result because it is calculated from real market fills.
If you run the script on a normal chart type (bars, candles, hollow candles, line, area or baseline) you will see the same result for both net profit numbers since both are run on the same real market prices. You will sometimes see slight discrepancies due to occasional differences between chart prices and the corresponding information fetched through security() calls.
Features
• Results shown in the Data Window (third icon from the top right of your chart) are:
— Cumulative results
— For each order execution bar on the chart, the chart and market previous and current fills, and the trade results calculated from both chart and market fills.
• You can choose between 2 different strategies, both elementary.
• You can use HA prices for the calculations determining entry/exit conditions. You can use this to see how a strategy calculated from HA values can run on a normal chart. You will notice that such strategies will not produce the same results as the real market results generated from HA charts. This is due to the different environment backtesting is running on where for example, position sizes for entries on the same bar will be calculated differently because HA and standard chart close prices differ.
• You can choose repainting/non-repainting signals.
• You can show MAs, entry/exit markers and market fill levels.
• You can show candles built from the underlying market prices.
• You can color the background for occurrences where an order is filled at a different real market price than the chart’s price.
Notes
• On some non-standard chart types you will not obtain any results. This is sometimes due to how certain types of non-standard types work, and sometimes because the script will not emit orders if no underlying market information is detected.
• The script illustrates how those who want to use HA values to calculate conditions can do so from a standard chart. They will then be getting orders emitted on HA conditions but filled at more realistic prices because their strategy can run on a standard chart.
• On some non-standard chart types you will see market results surpass chart results. While this may seem interesting, our way of looking at it is that it points to how unreliable non-standard chart backtesting is, and why it should be avoided.
• In order not to extend an already long description, we do not discuss the particulars of executing orders on the realtime bar when using non-standard charts. Unless you understand the minute details of what’s going on in the realtime bar on a particular non-standard chart type, we recommend staying away from this.
• Some traders ask us: Why does TradingView allow backtesting on non-standard chart types if it produces unrealistic results? That’s somewhat like asking a hammer manufacturer why it makes hammers if hammers can hurt you. We believe it’s a trader’s responsibility to understand the tools he is using.
Takeaways
• Non-standard charts are not bad per se, but they can be badly used.
• TV backtesting on non-standard charts is not broken and doesn’t require fixing. Traders asking for a fix are in dire need of learning more about trading. We recommend they stop trading until they understand why.
• Stay away from—even better, report—any vendor presenting you with strategies running on non-standard charts and implying they are showing reliable results.
• If you don’t understand everything we discussed, don’t use non-standard charts at all.
• Study carefully how non-standard charts are built and the inevitable compromises used in calculating them so you can understand their limitations.
Thanks to @allanster and @mortdiggiddy for their help in editing this description.
Look first. Then leap.

Renko channel BREAKThis strategry based on the Renko chart that provided by TV, which is Repainting !
Used after your own research
*** EXPERIMENTAL ***
*** USE AT YOUR OWN RISK ***
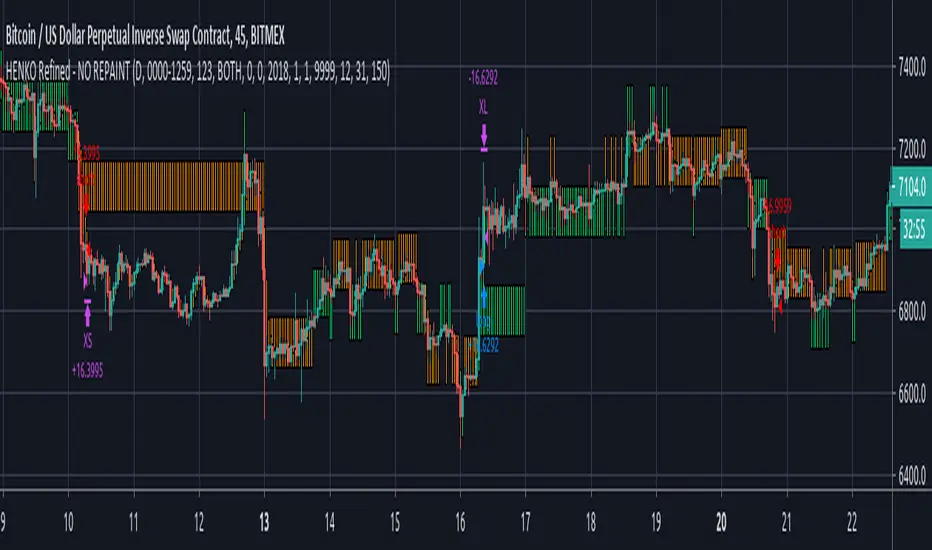
HENKO (Renko + HeikinAshi) -- No RepaintThis particular work is completely mine.
I have not used anyone else's code (not even a fragment).
Parts of the code are used from Open Source library linking to www.investopedia.com and TradingView's example section at www.tradingview.com
The above sources have been used to get Custom Heikin Ashi Candles.
Calculations on Renko bars is completely on me as I have used Daily close and open values to build my own Renko Candles.
Custom Bricksize for Float values has been made available in this public version.
I take no responsibility for the performance of this indicator as I have completely turned off the Repainting in this version of my script.
I am publishing the script for Public use.
I'll be releasing updates for this script in future as the performance is somewhat acceptable.
Profit Factor will decrease with bigger backtest data.
NO REPAINTING issues shall be reported at all costs as the tradingview's default Time based renko has been completely discarded, thus making it rely on its own.
Be advised that as the Renko Bars are calculated at 00:00 UTC, you're not supposed to mess with the timing in the script, unless you're working with Stock markets where it is important that you set your day start and end precisely.
You can play with the Brick Size to see what's more beneficial for you.
No Repaint RENKO
NOTE:= PERFORMANCE OF THIS INDICATOR DEPENDS UPON THE BRICKSIZE OF RENKO BARS.
real Renko traditionalThis is traditional Renko chart that can overly conventional Candles chart.
Different from the original Renko chart provided by Tradingview (which is Repainting and Misleading ), this script does not use the SECURITY function so there is no Repainting!
//Inspired by backtrader
// github.com

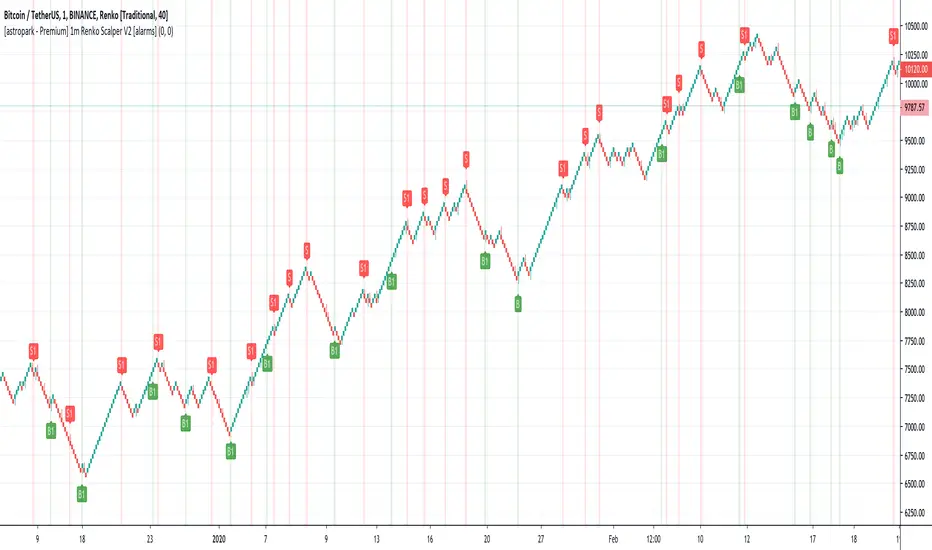
[astropark - Premium] 1m Renko Scalper V2 [alarms]Dear Followers,
today a new Scalper Tool , which works great on 1 minute timeframe , which is the best and more secure timeframe to use on a Renko chart, besides it works great up to 15m (I don't suggest to use a renko chart over 15m timeframe)!
It is an upgraded version of Bitmex Renko Scalper that you can find in my tradingview script page.
This tool has some cool features:
it works on 1 minute timeframe : so you can enjoy high-frequency trading by using a 24/7 running bot;
wait bricks optional mode : you may like to make script wait for triggering a new signal by waiting 1 or 2 more confirmation bricks
trailing stop : you can set a trailing stop in trade, so script will alert you if it will be reached in chart
This strategy can trigger till 5 buy or 5 sell signals in a row before reverting, so use a proper money management .
Strategy results are calculated on the timeframe from july to now, so on about 4 months, using 10000$ as initial capital and working at 3x leverage (very safe leverage!).
The user who wants to use this strategy, especially via an automated bot, must always set a stoploss at 5% from entry point or use a proper risk management strategy .
This is not the "Holy Grail", so use it with caution.
This script will let you set all notifications you may need in order to be alerted on each triggered signals.
The backtesting script version of this indicator, which will let you backtest this script and find best settings for your preferred market, can be found here below:
On Bitmex XBTUSD chart best settings is Traditional Renko chart with 10$ box size.
This is a premium indicator , so send me a private message in order to get access to this script .
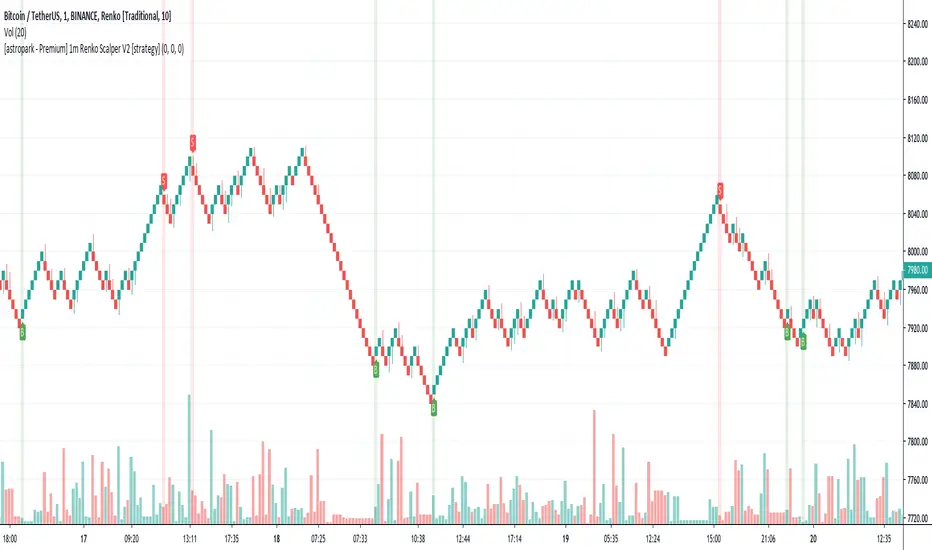
[astropark - Premium] 1m Renko Scalper V2 [strategy]Dear Followers,
today a new Scalper Tool , which works great on 1 minute timeframe , which is the best and more secure timeframe to use on a Renko chart, besides it works great up to 15m (I don't suggest to use a renko chart over 15m timeframe)!
It is an upgraded version of Bitmex Renko Scalper that you can find in my tradingview script page.
This tool has some cool features:
it works on 1 minute timeframe : so you can enjoy high-frequency trading by using a 24/7 running bot;
wait bricks optional mode : you may like to make script wait for triggering a new signal by waiting 1 or 2 more confirmation bricks
trailing stop : you can set a trailing stop in trade, so script will alert you if it will be reached in chart
This strategy can trigger till 5 buy or 5 sell signals in a row before reverting, so use a proper money management .
Strategy results are calculated on the timeframe from july to now, so on about 4 months, using 10000$ as initial capital and working at 3x leverage (very safe leverage!).
The user who wants to use this strategy, especially via an automated bot, must always set a stoploss at 5% from entry point or use a proper risk management strategy .
This is not the "Holy Grail", so use it with caution.
This script will let you backtest this script and find best settings for your preferred market. On Bitmex XBTUSD chart best settings is Traditional Renko chart with 10$ box size.
The alarms version of this indicator, which will let you set all notifications you may need in order to be alerted on each triggered signals, can be found by searching for "1m Renko Scalper V2".
This is a premium indicator , so send me a private message in order to get access to this script .

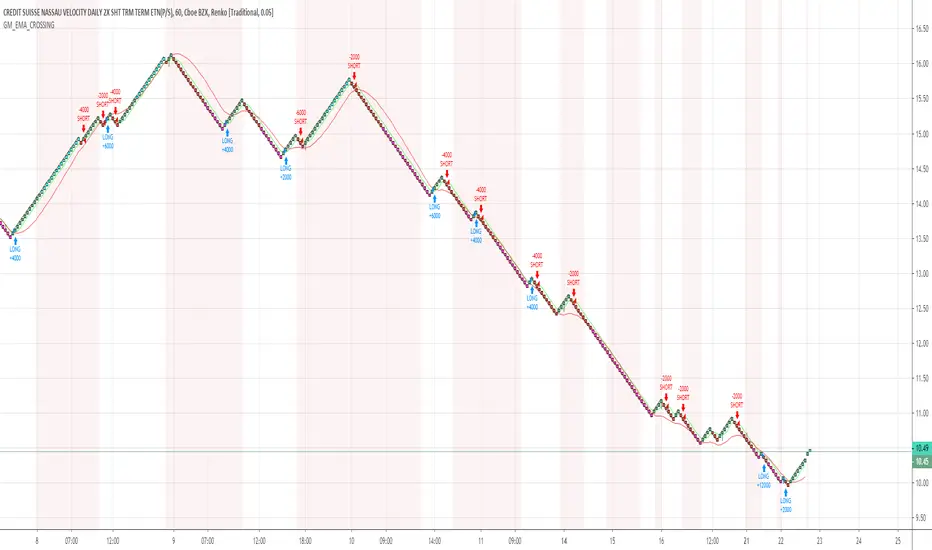
GM_EMA_CROSSINGThis is a simple Renko Strategy. The settings used were for Traditional (1.2) bars, tested on $SPX500USD. Around 70% profitable depending on timeframe, and bar size selected. Adjust the capital and suggested contract system depending on needs. The colored bars seen show blue for overbought conditions and pink for oversold conditions. If you like this strategy, please like and +rep!
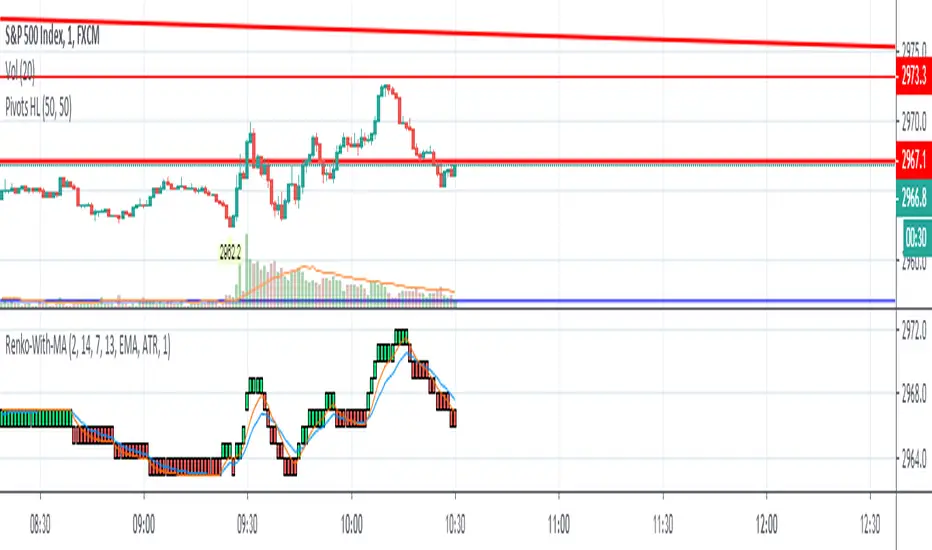
Renko Dynamic Index ZonesThe goal of this indicator is to plot the Dynamic Index, Signal, and Histogram values "as if" the chart is a true price action based Renko chart. It can be used on a time series chart or Renko series chart. The Dynamic Index is derived from the raw price action of a time-based chart, where the historic and live price values are clustered into Renko bricks. The Renko brick production algorithm is entirely backed by Renko Overlay Ribbon and thoroughly tested. The Dynamic Index gets its inspiration from the Commodity Channel Index.
The algorithm takes into account rapid brick production within a single time candle and adjusts accordingly. The output may vary slightly between different chart time frames for the same indicator settings, but this is due to the lack of price fluctuation visibility that can occur in higher chart time frames. If the brick tick size is low, an appropriate chart interval should be selected that maximizes the amount of price volatility visible to the indicator. A bad setting would be something like a 1 tick EURUSD Renko setting on an H4 or Day chart, there simply is no way to derive the exact and ordered price fluctuations in a single candle, 1 pip at a time. A more appropriate chart time frame would be 1-5 minutes for this selected Renko brick size.
The difference between this indicator and the companion Renko Dynamic Index oscillator can be understood in the following video. The indicator plots the current Dynamic Index - Signal cross and Dynamic Index - Zero cross thresholds on the chart so that you know exactly where the most important crossing values are at all times. These can be used as a dynamic stop or a dynamic entry location for trades. The overbought and oversold dynamic zones are also plotted on the chart.
If you are interested in the RSI-RENKO DIVINE™ Strategy please have a look here:
Contact me in Trading View or telegram for more information and access instructions.

Renko Strategy with Ema against price crossover/underRenko Strategy with Ema against price crossover/under
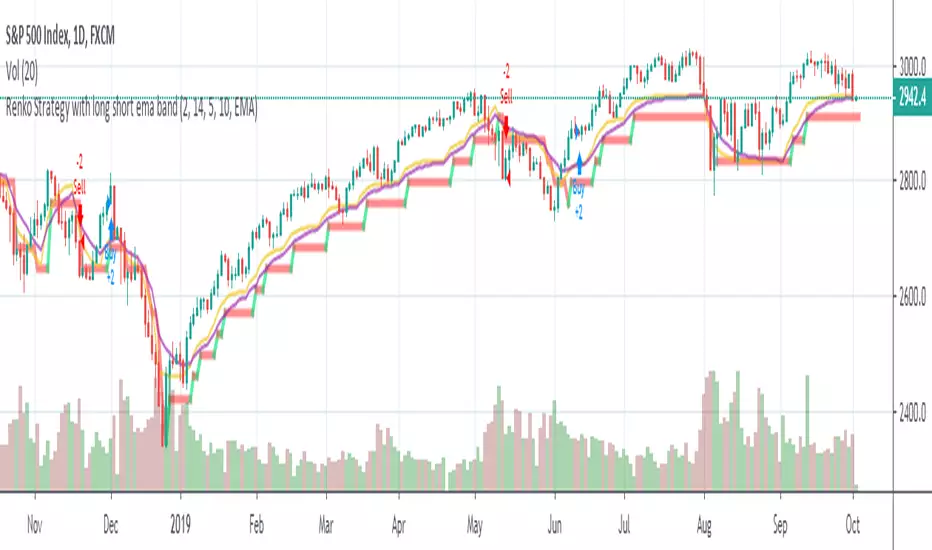
Renko Bollinger StrategyIf you build Bollinger Bands from the values of Renko or Haken Ashi, then you can get an interesting strategy.

Lancelot vstop intraday trending strategyDear all,
Free strategy again.
I found using 3 volatility stop with different settings could be very helpful when trading an intraday trending market.
With the ATR setting or 5, 10, 15, we can weed out many false break.
Vstop setting is OHLC4.
On the other hand, this strategy also utilize Renko as part of the strategy, so you could say this strategy is mainly an intraday break out trend following strategy.
Works well on BTCUSD XBTUSD, as well as other major liquid alt Pairs.
And lastly,
Save Hong Kong, the revolution of our times.

Lancelot RR StrategyDear all,
Free strategy again.
This strategy consists of 2 indicators I think works well with each other as a trend following strategy.
The 2 indicators are Renko chart and Relative Vigor Index.
This is a long-only breakout strategy that aims to capture the majority of the trend.
Works well on BTCUSD XBTUSD, as well as other major liquid Pair.
Please acknowledge my effort by like and follow.
And lastly,
Save Hong Kong, the revolution of our times.

Use On Renko Chart - Cheap Entry Signals HI BIG PLAYERS,
in according of an enquiry from an user of tradingview I coded this script for free.
This script allows to identify a trend on the basis of higher high & higher low and lower high & lower low. And only after this fulfill conditions the entry signal comes out. The enquiry relates to Renko-charts, this is why it was build more usable on Renko-Charts.
In addition, it is possible to choise yourself the view of highest/lowest peaks and signals in the options.
Please give me a like to this indicator and of course: you are invited to follow me or visit my other scripts in relation to Wolfe Wave and Elliott Wave.
King regards
NXT2017

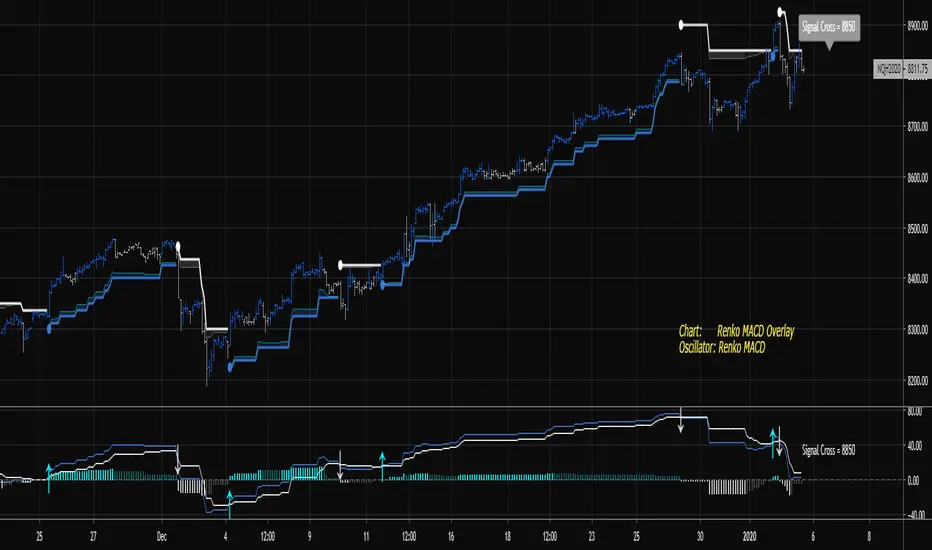
Renko MACD TrendThe goal of this indicator is to plot the MACD, Signal, and Histogram values "as if" the chart is a true price action based Renko chart. It can be used on a time series chart or Renko series chart. The MACD is derived from the raw price action of a time-based chart, where the historic and live price is clustered into Renko bricks. The Renko brick production algorithm is entirely backed by Renko Overlay Ribbon and thoroughly tested.
The algorithm takes into account rapid brick production within a single time candle and adjusts accordingly. The output may vary slightly between different chart time frames for the same indicator settings, but this is due to the lack of price fluctuation visibility that can occur in higher chart time frames. If the brick tick size is low, an appropriate chart interval should be selected that maximizes the amount of price volatility visible to the indicator. A bad setting would be something like a 1 tick EURUSD Renko setting on an H4 or Day chart, there simply is no way to derive the exact and ordered price fluctuations in a single candle, 1 pip at a time. A more appropriate chart time frame would be 1-5 minutes for this selected Renko brick size.
The difference between this indicator and the companion Renko MACD indicator can be understood in the following video. The indicator plots the current MACD - Signal cross and MACD - Zero cross thresholds on the chart so that you know exactly where the most important crossing values are at all times. This can be used as a dynamic stop or a dynamic entry location for trades.
If you are interested in the RSI-RENKO DIVINE Strategy please have a look here:
Contact me in Trading View or telegram for more information and access instructions.
Telegram: t.me
Daily Edge: www.daily-edge.com
Renko MACDThe goal of this indicator is to plot the MACD, Signal, and Histogram values "as if" the chart is a true price action based Renko chart. It can be used on a time series chart or Renko series chart. The MACD is derived from the raw price action of a time-based chart, where the historic and live price is clustered into Renko bricks. The Renko brick production algorithm is entirely backed by Renko Overlay Ribbon and thoroughly tested.
The algorithm takes into account rapid brick production within a single time candle and adjusts accordingly. The output may vary slightly between different chart time frames for the same indicator settings, but this is due to the lack of price fluctuation visibility that can occur in higher chart time frames. If the brick tick size is low, an appropriate chart interval should be selected that maximizes the amount of price volatility visible to the indicator. A bad setting would be something like a 1 tick EURUSD Renko setting on an H4 or Day chart, there simply is no way to derive the exact and ordered price fluctuations in a single candle, 1 pip at a time. A more appropriate chart time frame would be 1-5 minutes for this selected Renko brick size.
Please find the following video introduction helpful for this indicator and the Renko MACD Trend indicator:
If you are interested in the RSI-RENKO DIVINE Strategy please have a look here:
Contact me in Trading View or telegram for more information and access instructions.
Telegram: t.me
Daily Edge: www.daily-edge.com


[RESEARCH] Chart Type IdentifierA viable and workable concept of chart type identification using Pine Script.
Was wollen wir trinken , sieben Tage lang
Was wollen wir trinken, so ein Durst!
Was wollen wir trinken, sieben Tage lang
Was wollen wir trinken, so ein Durst!

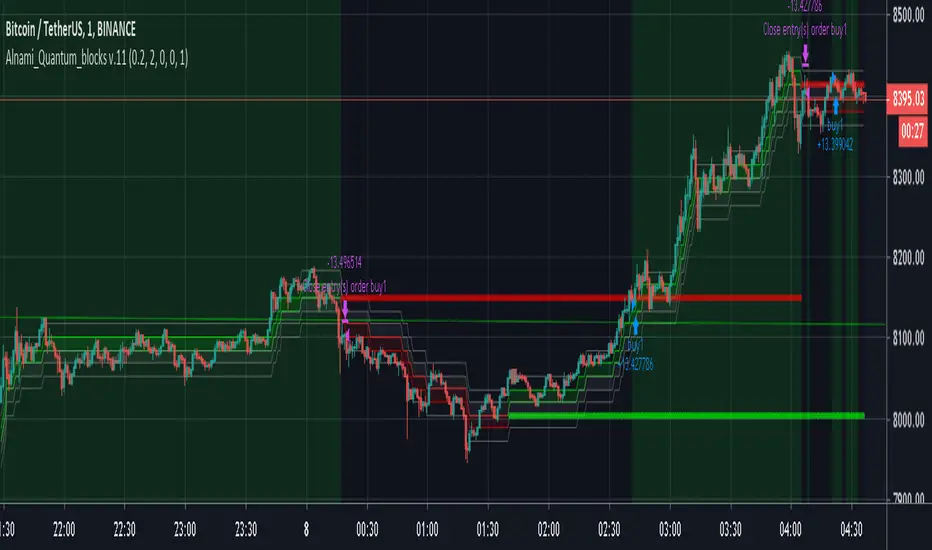
Alnami_Quantum_blocks v.11The (Al Nami Quantum Blocks v.11) script is based on Renko chart that is based on % move of the selected symbol. This is different from the traditional or ATR based Renko charts..
box size = user selected percentage x current price
Alnami Quantum Blocks Channel is composed of 5 levels that are calculated based on the box size:
1- Base
2- Green Box High (GBH) = Base + box size
3- Next Green Box trigger (GBN) = base + (box size x 2)
4- Red Box Low ( RBL ) = Base - box size
5- Next Red Box trigger ( RBN ) = base - (box size x 2)
Those levels will appear in the chart with the following order:
------GBN-------
------GBH-------
------BASE------
------RBL-------
------RBN-------
Usually when prices are trending up, the price will stay above the base for most of the time,, when it trending downwards, price stays below base most of the time..
Now how to time your entries based on the channel?
This strategy draws two levels, breakout level (top red line) and stop level (bottom green line).
If the price is above red line, place a buy order
If the price is below the green line, place a sell order
In version 11 of the Quantum blocks, you can choose to make the those two lines drawn using:
recent/near term price actions (less accurate) and fast - set the number of Legs to low value
or
wider term price actions (more accurate) and slow - set the number of Legs to high value
This version also tracks the last three changes for the red and green lines as following:
1- Above, Above, Above = 3
2- Above, Above, Below = 2
3- Above, Below, Below = 1
4- Below, Below, Below = 0
I did run full optimization for the settings of this strategy on Bitcoin (Binance:BTCUSDT) for the following multiple time frames using Amibroker scrips and data downloaded from Binance through a REST API call. The TFs were for 1min, 15min, 30min, 45min, 90min, 120min, 180min, and 240min.
pair Input Settings
btc TF Profit% Sys DD% Trade DD% sharpe% # Trades Win% Wave% # of Legs up lo
1 204 40.16 15.04 1.33 132 40.15 1.5 4 3 3
15 249 35 14.3 2.96 35 51.43 1.8 3 1 3
30 469 28.95 14.04 3.82 34 67.65 1.4 3 1 3
45 712 54.48 23.3 2.49 46 54.35 1.7 3 3 3
90 1114 40.51 21.41 3.3 48 54.17 1.4 2 3 3
120 602 25.32 16.8 2.82 51 43.14 1.2 2 3 3
180 960 35.9 20.09 3.33 42 52.38 0.9 2 2 3
240 819 46.84 28.27 3.48 46 65.22 0.6 2 3 3
I spent a lot of time and resource in providing the above, If this script/back tests helped in making some profits, then kindly express your appreciation and support to this work by sending some altcoins to any of the following wallets, this will encourage me sharing more stuff with the public:
BTC : 15VLCLZRkEhhZn6E4gNjMLVYnmCcUzKvWU
LTC : LN6mE6aZhEqVVfssmaQ3kk8PPspWQ5wToy
ETH : 0x7901035f2b6f334fa404d0ceb187d7bfcfdb72ce
[RESEARCH] Renko Chart IdentifierDespite I am not a big fan of Renko I spent some time to solve a common problem of chart type identification using absolutely obvious technique: Renko bricks have the same size. That's all. Not a cutting-edge maths.
This tool allows to identify:
ATR Renko charts (see ^)
Traditional Renko charts
Here is example for Traditional Renko:
It also works correctly with other chart types:
Classic Candles
Heikin-Ashi
Kagi
PnF
Range Bars
Remember @everget !
And pay attention to the license before use)

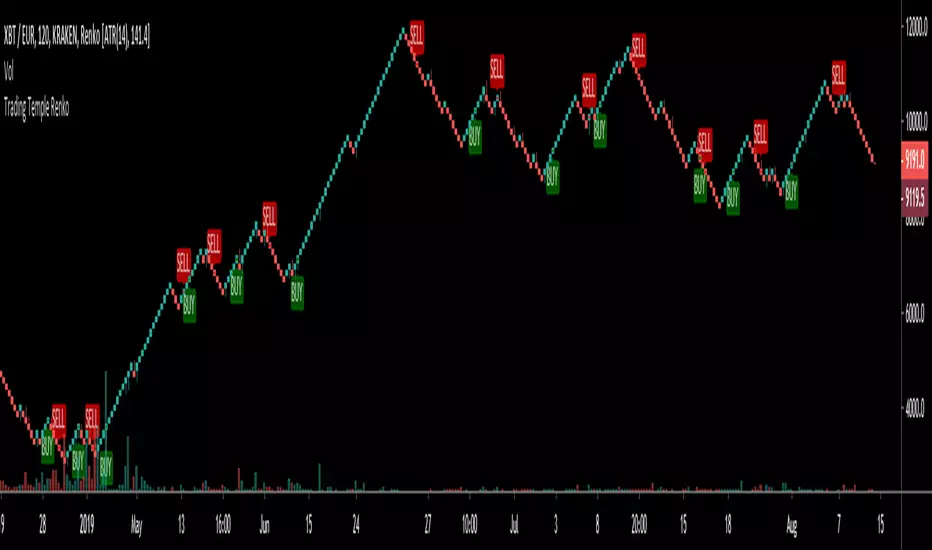
Trading Temple Trend Tracker Renko v1Trend Tracker to be used for trades following the current trend.
To be used with Renko bricks based on ATR and intraday charts (below 1D)