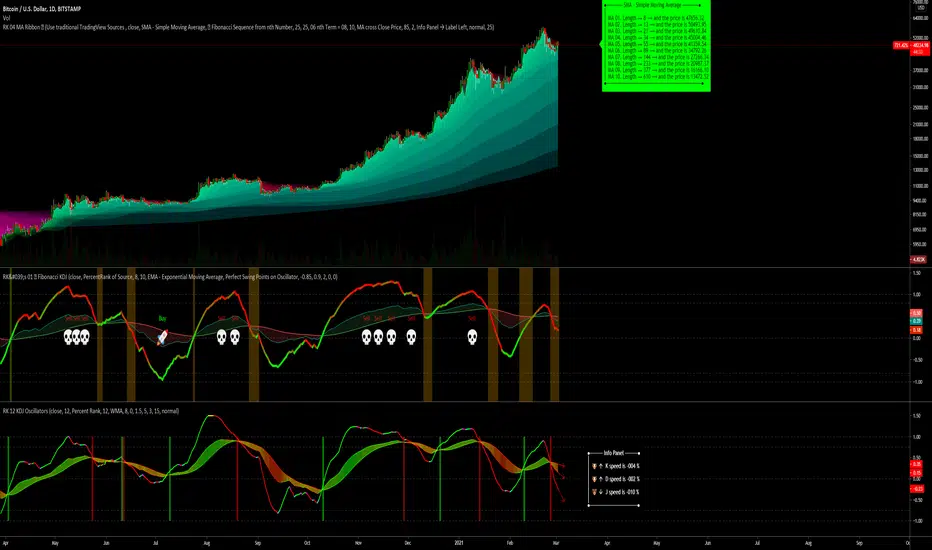
3 RSI 6sma/ema ribbon crypto strategyThis is a very efficient swing trading strategy designed for crypto long timeframes like 2h+.
Initially we have 3 RSI .
AFter that we use them as source for 6 SMA/EMA for each RSI, 5, 30, 50, 70, 90, 100. With those we create a ribbon that we are going to use in order to check the direction of the trend.
Rules for entry:
For long : if either all the SMA/EMA's from the 2nd RSI are telling us to go long, or all the all SMA/EMA's from the 3rd rsi are telling us to go long F
For short : if either all the SMA/EMA's from the 2nd RSI are telling us to go short, or all the all SMA/EMA's from the 3rd rsi are telling us to go short
We exit when we get an opposite condition than the entry one.
Caution: this strategy has no risk management inside, so use it with caution. If you have any questions , let me know !
Ribbon

Moving Average Ribbon [TheBearFighter]
This code was written using:
•Pine Script Coding Conventions.
This script provides a very useful tool for new community users and professionals. It puts at your disposal a Moving Average Ribbon by hand to graph and easily find the ones with the highest performance. The creation of this script was motivated because in free TradingView accounts there is a limit of 3 indicators by chart, and with this tool you can draw up to 32 MA's at the same time!
Choose one of 10 types of MA´s:
•KAMA Kaufman's moving average.
•HULL Hull moving average.
•TEMA Triple exponencial moving average.
•LSMA Least square moving average.
•DEMA Double exponencial moving average.
•ALMA Arnaud Legoux moving average.
•WMA Weighted moving average
•EMA Exponencial moving average.
•VWMA Volume Weighted moving average.
•SMA Simple moving average.
Use the tooltips to know the lengths of MA´s.
A main characteristic of the script is that the lengths are in days but when changing the lowest timeframes, the same daily resolution is maintained. This gives us extreme precision in intraday timeframes, e.g 30 minutes.
Once this is understood, we can turning the MA´s on/off, and changing the timeframe to our liking.
Available timeframes: M, W, D, 4H, 1H, 30m, 15m, 5m.
Also the MA´s are colored for easy visualization and know if they grow or decrease.
Thank´s to @midtownsk8rguy to let me know more about HEX colors.
Thank´s to @HPotter for his KAMA.

SMA 200 Ribbon MTF - Support and ResistanceThe SMA 200 is one of the most important and strongest support/resistance lines on any timeframe. This script pulls the SMA 200 line from multiple timeframes so traders can visually see price action bounce between support and resistance . The current timeframes SMA 200 is displayed in white and turns yellow to signify "pressure". Can be used on higher timeframes to find bull action. This indicator can also be used to filter out pumps and dumps as shown in example 3 and 4.
Example of indicator on 5 min timeframe. Candles bounce along SMA200 lines.
Example of indicator on daily timeframe . Lines turn green and price action pumps. Lines turn red and price action dumps.
Example 3: A clean crossover of lines usually signals a bullish pump.
Example 4: Tangled or messy lines tend to result in a dump as price action struggles to cross resistance. A pullback is required to "clean" the lines.
EMA Band can be turned on using "tickbox" in settings menu.

EMA 730 Ribbon MTF - Support and ReistanceThe EMA 730 line is a great way to show dynamic support and resistance . Price action travels "through" this line on each timeframe. This script pulls the EMA 730 Line from multiple timeframes so a trader can visually see price action bounce between support and resistance lines. Lower bands (white lines) can be turned off using "tickbox" in settings. EMA length can also be adjusted in settings. Some charts may work better with a length of 750.
Example of EMA Bands on lower timeframe.

Crypto EMA Bands - Support and ResistanceEMA Bands for crypto markets shows support and resistance lines. Helps identify bull and bear market trends. SMA200 is white and turns yellow to signal pressure. Can also be useful for identifying Elliot waves and breakouts.

RK's 15 ∴ Timeframed Multiple MA Types RibbonI developed this indicator focusing on the KISS (Keep It Simple, Stupid) to help me in a more direct and visual way when enteringand exiting my market position.
The idea is to configure the indicator with your favorite Moving Averages and Lengths and Enter Long when the price is above and Short when the price is below.
I put the setup that I am testing now in the tooltips to give an example.
MA Cross Ribbon + [RSI,StochRSI,VolOsc,RoC,Compare,Info Panel]
Draws all sorts of useful information directly onto the Chart
Moving Average Ribbon with configurable offsets
Allows you to easily visualize MA Crossovers
Easy to view in the Data Window
RSI Indicator (Overbought, Oversold, Healthy)
Stochastic RSI
Volume Oscillator (Bullish, Bearish, Healthy)
Rate of Change Indicator
Compare Symbol without adding a new scale (Symbol, Timeframe, Divider)
Moving the chart around won't ruin your comparison
Allows you to see the general sentiment of all your configured averages at a glance
100% Configurable
If there is anything you would like added please comment, It's very likely I will be adding more things to this.

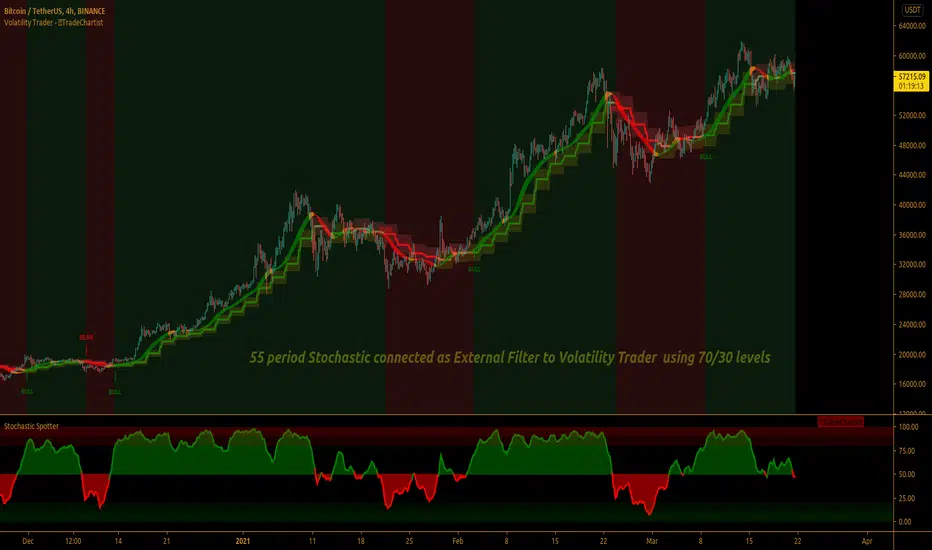
TradeChartist Volatility Trader ™TradeChartist Volatility Trader is a Price Volatility based Trend indicator that uses simple to visualize Volatility steps and a Volatility Ribbon to trade volatility breakouts and price action based on lookback length.
===================================================================================================================
Features of ™TradeChartist Volatility Trader
======================================
The Volatility steps consists of an Upper band, a Lower band and a Mean price line that are used for detecting the breakouts and also used in plotting the Volatility Ribbon based on the price action. The Mean Line is colour coded based on Bull/Bear Volatility and exhaustion based on Price action trend.
In addition to the system of Volatility Steps and Volatility Ribbon, ™TradeChartist Volatility Trader also plots Bull and Bear zones based on high probability volatility breakouts and divides the chart into Bull and Bear trade zones.
Use of External Filter is also possible by connecting an Oscillatory (like RSI, MACD, Stoch or any Oscillator) or a non-Oscillatory (Moving Average, Supertrend, any price scale based plots) Signal to confirm the Bull and Bear Trade zones. When the indicator detects the Volatility breakouts, it also checks if the connected external signal agrees with the trend before generating the Bull/Bear entries and plotting the trade zones.
Alerts can be created for Long and Short entries using Once per bar close .
===================================================================================================================
Note:
Higher the lookback length, higher the Risk/Reward from the trade zones.
This indicator does not repaint , but on the alert creation, a potential repaint warning would appear as the script uses security function. Users need not worry as this is normal on scripts that employs security functions. For trust and confidence using the indicator, users can do bar replay to check the plots/trade entries time stamps to make sure the plots and entries stay in the same place.
™TradeChartist Volatility Trader can be connected to ™TradeChartist Plug and Trade to generate Trade Entries, Targets etc by connecting Volatility Trader's Trend Identifier as Oscillatory Signal to Plug and Trade.
===================================================================================================================
Best Practice: Test with different settings first using Paper Trades before trading with real money
===================================================================================================================
This is not a free to use indicator. Get in touch with me (PM me directly if you would like trial access to test the indicator)
Premium Scripts - Trial access and Information
Trial access offered on all Premium scripts.
PM me directly to request trial access to the scripts or for more information.
===================================================================================================================
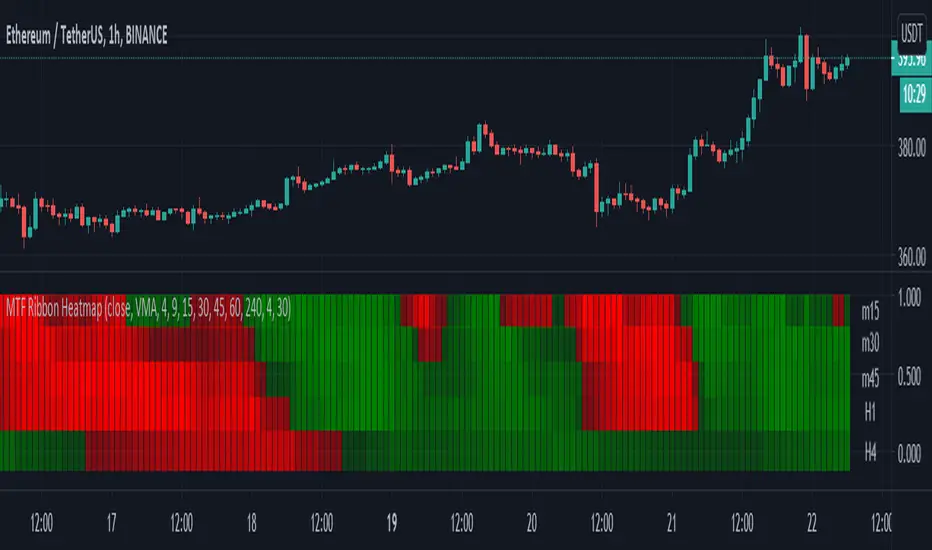
Moving Averages - 5 Ribbon MTF HeatmapThis is a 5 Ribbon heatmap moving averages indicator where each represents a different time frame, The RED or GREEN color palette is also affected by asset velocity using ATR.
Supports various moving averages including VMA (Default), Zero Lag, TSF (Time Series Forecast).
A single ribbon is set to GREEN when fast MA (moving average) is above the slower MA and RED when fast MA is below the slower MA.
In the settings you can set the ATR length (Average True Range) which will affect the velocity calculation for the colors, higher ATR length will smooth the coloring more (Less color changes), while lower ATR will show more instant changes.
HOW TO USE?
The brighter the GREEN is the stronger the up trend.
The brighter the RED is the stronger the down trend.
A weakening GREEN color can be a sign for a down reversal.
A weakening RED color can be a sign for a up reversal .
Supports alerts when fast moving average crosses slow moving average from all time frames, either way, up or down.
Comments/Suggested/Positive feedbacks are welcome and can make this indicator even better.
Follow for upcoming indicators: www.tradingview.com
A Fibonacci Moving Averages Ribbon Using One PlotThe following script aims to visually reproduce a Fibonacci moving averages ribbon by only using one plot function, the period of the moving average is determined by a number of the Fibonacci sequence. This trick is made possible by computing the value of a moving average at time t with a period determined by a periodic Fibonacci sequence and using plot.style_circles as plot style.
Settings
From Fibonacci Number: Determine the n th Fibonacci number to be used as the lowest moving average period
To Fibonacci Number: Determine the n th Fibonacci number to be used as the highest moving average period, capped at 19 to avoid errors. If you still have errors lower the value.
Src : input series of the moving average.
Details
The first thing we must do is to compute a periodic (repeating) linear sequence n from the number in From Fibonacci Number to the number in To Fibonacci Number , then we get the n th Fibonacci number from the previous sequence using Binet's formula.
To get the moving average we first compute the fib period momentum of the cumulative sum of Src , where fib is the current number of our periodic Fibonnacci sequence, we then divide the result by fib .
If we zoom in we can indeed see that there is only one point per bar.
However, zooming out and using a different color for each point allows us to get something visually similar to a ribbon. Adding more plots would create a visually more accurate result.
This trick is not the most useful in the world, but let's imagine you want to plot a massive ribbon consisting of 1000 moving averages with periods that can be determined by a specific sequence, using this trick would allow you to have the effect of 1000 plots while keeping your script relatively efficient, altho ribbons consisting of lots of moving averages are rarely easy to visualize.

21/55 EMA Cloud w/ Optional RibbonThis indicator behaves like a traditional EMA ribbon by using the 21, 25, 30, 35, 40, 45, 50, and 55 bar exponential moving averages. In this particular indicator, the traditional EMA ribbon lines are turned off by default leaving only a filled in area between the 21 and 55 bar averages. The filled in area is green when the 21 bar average is greater than the 55 and red otherwise. Additionally, the 9, 100, and 200 exponential moving averages are available for reference.

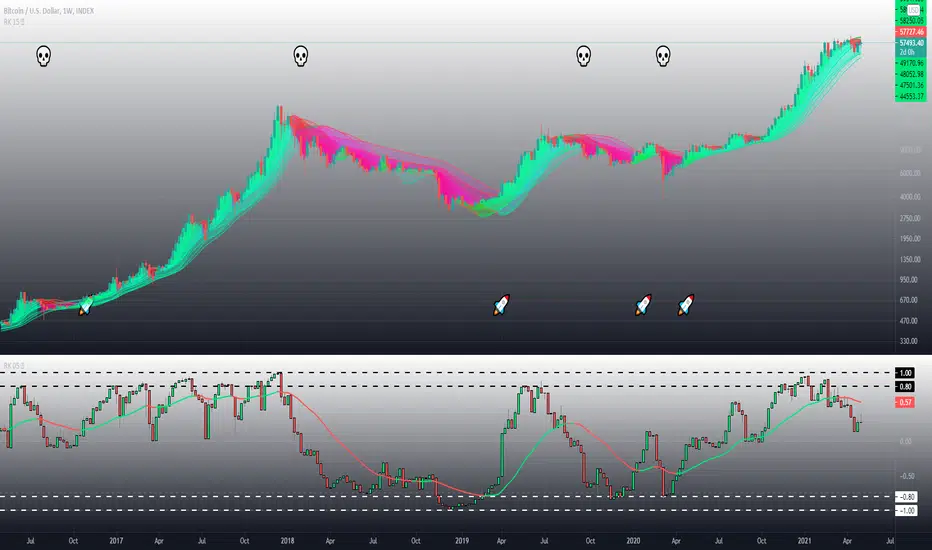
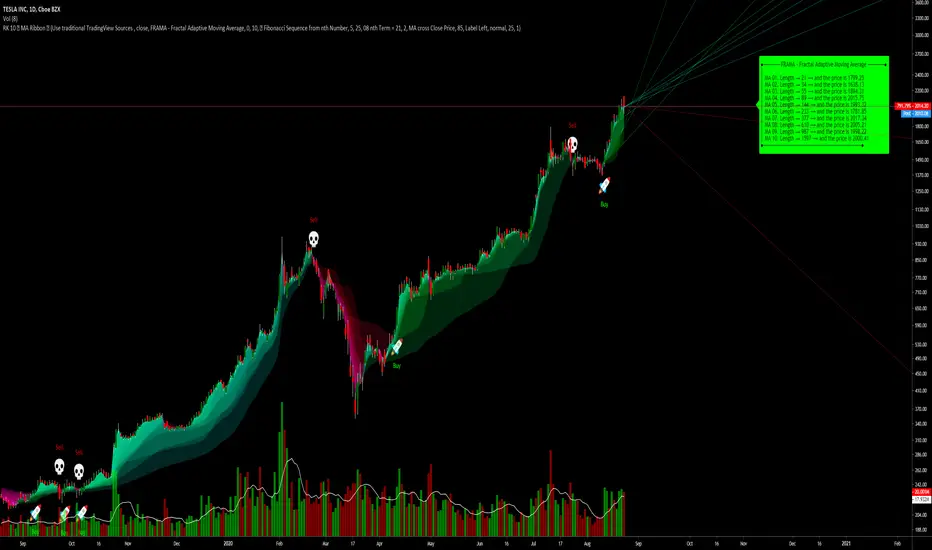
RK's 10 ∴ MA Types Ribbons (Fibonacci, Guppy and others)After some tips in my indicator
RK's 04 - Lots of MA Types Ribbon I Put some time and effort to make it better.
So, I'm sharing with you the results.
This is an up to 10 lines Moving Average Ribbon with an Auto Evaluate Length and a lots of options!!!
Type of Moving Average you can use:
SMA - Simple Moving Average
SMMA - Smoothed Moving Average
EMA - Exponential Moving Average
DEMA - Double Exponential Moving Average
TEMA - Triple Exponential Moving Average
WMA - Weighted Moving Average
HMA - Hull Moving Average
EHMA - Exponential Hull Moving Average
RMA - RSI Moving average
2PSS - Ehlers 2 Pole Super Smoother
3PSS - Ehlers 3 Pole Super Smoother
VWMA - Volume-Weighted Moving Average
ALMA - Arnaud Legoux Moving Average
STMA - Simple Triangular Moving Average
ETMA - Exponential Triangular Moving Average
LSMA - Least Squares Moving Average
ZSMA - Zero-Lag Simple Moving Average
ZEMA - Zero-Lag Exponential Moving Average
COVWMA - Coefficient of Variation Weighted Moving Average
COVWEMA - Coefficient of Variation Weighted Exponential Moving Average
FRAMA - Fractal Adaptive Moving Average
KAMA - Kaufman's Adaptive Moving Average
VIDYA - Variable Index Dynamic Average
If you want to change faster the MA type, in "Moving Average Setup:", Select "🤖 Use numbers to change MA Type", click inside the box in "🤖 Moving Average Type per Number:" and just scroll your mouse wheel. You can check what MA type you are using looking in the info panel label.
There is 4 automatic evaluate length:
Fibonacci Sequence
Arithmetic Progression
Geometric Progression
Guppy Multiple Moving Average (GMMA) without Lengths 03 and 05
And I already put a Manual Length, but I keep it inside the code, so if you want to use different lengths, just change the code, or ask me and I will put as an input.
And attending a request, this indicator can creates alerts when all the colors of the ribbons changes.
Hope you like it!
Any other good idea, just send me.
FXReaper X (Master) P1
OANDA:GBPAUD
This indicator includes all of the best indicators utilized for optimal trading.
The indicator includes the following:
- Fibonacci
- MA Ribbon
- SuperTrend
- Buy & Sell Signals
How to Use
How to use this indicator depends on you as the trader, how to best utilize this objectively is to apply it as confluence to your analysis.
- Buy/Sell signal (In your bias direction)
- Fibonacci golden zone (entry)
- SuperTrend (fits your trend bias)
- Ribbon (additional trend bias)
Ideally, you would use this to catch the best entries near support/resistance levels.
I.e. Buying off bounce of support level using signal and super trend.
Disclaimer
This by no means is a guaranteed signal. These should be used as confluence to your own technical/fundamental analysis.
Do not rely on this solely unless you know what you are doing.
These indicators were pulled and modified from existing indicators and adjusted to our personal preferences.
There are custom inputs for those to adjust to their own liking.
How to Get Access
To get access please send me a private message via TradingView.

The Enlightened Trader - Higher Time-frame Visual ConfluenceHello. This indicator is unique because the moving averages are pegged to particular time-frames. This keeps moving average placement consistent while flipping through the different time charts. Context isn't lost anymore, while curiosity is free to find profit. Honestly, I put a lot of work into this and it's serving me well. I hope you guys find it valuable too.
The default values are the result of the research study part my creating a master key indicator, however it's still subject to my biases. If you know of any awesome MA combos, feel free to comment them below. This is a long-term work-in-progress, but let me know what you think!
Thank you.

RK's 04 - Lots of MA Types RibbonHello again,
I made this script to test what is the better Moving Average type to predict the market direction, so I put a function with All the MA I know.
To go beyond, this script have an option to increase the MA length as a Fibonacci Number or any other simple number to step.
If the drawing is too slow, just reduce the amount of MA lines in the input option ("Number of MA to Plot:") to 10 or less and it will be faster.
Hope you like, and if you know other Moving Average type, just tell me how can I get the formula and (if its good, not copyrighted and I have time) I can add here and update for all of us.
Obs: To avoid errors, the Maximum Nth Fibonacci Term to use in MA Length is 19 (4181)
pivXmaspivXmas is a combined Moving Average based indicator.
pivXmas adds the following graphic functionalities to your chart:
- Adjustable Pivot-Bands with optional up-down-colored Middle-Line
- 4 Simple Moving Averages and/or 4 Exponential Moving Averages
OR an 8-segment Moving Average Ribbon
The Pivot-Bands are calculated by using time-spreaded averaged Lows and Highs.
The Length of the basic number of periods can be modified.
The brightness of all Pivot-Bands elements can be adjusted with one single control and a choice between
different color schemes is provided for convenience.
The Pivot-Bands Exponentialty can be set from 0 (Simple Moving Average) to 100 (Exponential Moving Average).
Furthermore, the Pivot-Bands Distance, the space between the upper and lower band, can be altered.
Depending on the timeframe, settings and other signals, part of a typical trading strategy could consist of
a long/buy when the price crosses the lower band from below back into the bands-range and a short/sell when
the price crosses the upper band from above back into the bands-range.
Roughly following the Middle Line curve and color also gives a good insight whether something is in an uptrend,
downtrend or in between.
The brightness of all Moving Averages can be adjusted with one single control.
The length and appearance for each Moving Average, 4 SMA's and 4 EMA's, can be modified individually.
The MA-Ribbon can be set to use simple or exponential Moving Averages. The MA-Ribbon uses the SMA/EMA 4 length
as the maximum length and the SMA/EMA 4 length divided by 8 (rounded) as the minimum length.
The MA-Ribbon consists of 8 subsequent Moving Averages. Color filling can be switched on and off.
Books have been written and many articles and videos have been made about the meaning and possible applications
of Moving Averages in trading.
A combination of these functions within pivXmas, together with the simple, yet quite usefull, visual options,
make it to a versatile indicator on every timeframe on any chart.

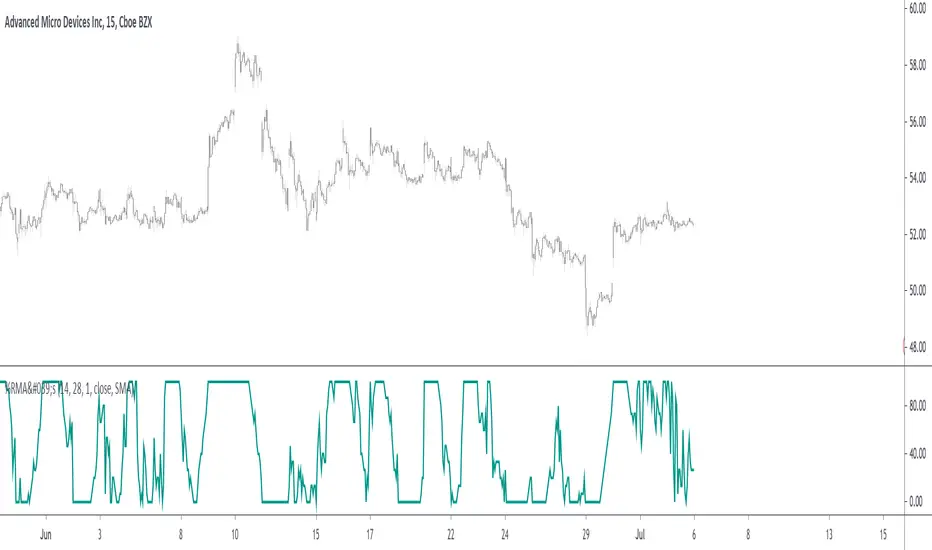
Percentage Of Rising MA'sReturn the percentage of rising moving averages with periods in a custom range from min to max , with the possibility of using different types of moving averages.
Settings
Minimum MA Length Value : minimum period of the moving average.
Maximum MA Length Value : maximum period of the moving average.
Smooth : determine the period of an EMA using the indicator as input, 1 (no smoothing) by default.
Src : source input for the moving averages.
Type : type of the moving averages to be analyzed, available options are "SMA", "WMA" and "TMA", by default "SMA".
Usages
The indicator can return information about the main direction of a trend as well as its overall strength. A value of the indicator above 50 implies that more than 50% of the moving averages from period min to max are rising, this would suggest an uptrend, while a value inferior to 50 would suggest a down-trend.
On the chart, a ribbon consisting of simple moving averages from period 14 to 19, with a color indicating their direction, below the indicator with min = 14 and max = 19
The strength of a trend can be determined by how close the indicator is to 0 or 100, a value of 100 would imply that 100% percent of the moving averages are rising, this indicates a strong up-trend, while a value of 0 would suggest a strong down-trend.
Using different types of moving averages can allow to have more reactive or on the contrary, less noisy results.
Here the type of moving average used by both the ribbon and the indicator is the WMA, the WMA is more reactive than the SMA at the cost of providing less amount of filtering. On the other hand, using a triangular moving average (TMA) provide more filtering at the cost of being less reactive.
Finally, irregularities in the indicator output can be removed by using the smooth setting.
Above smooth = 50.
Details
The indicator is based upon a for loop, this implies that both the sma, wma or change functions are not directly usable, fortunately for us, it is possible to get the first difference of both the SMA, WMA and TMA without relying on a loop by using simple calculations.
The first difference of an SMA of period p is simply a momentum oscillator of period p divided by p , there are two ways to explain why this is the case, first, simple math can prove this, the first difference of an SMA is given by:
(x + x + ... + x )/p - (x + x + ... + x )/p
The repeating terms cancel each other out, as such, we end up with
(x - x )/p
which is simply a momentum oscillator divided by p , since this division doesn't change the sign of the output we can leave it out. We can also use impulses responses to prove this, the impulse response of a simple moving average is rectangular, taking the first difference of this impulse response will give the impulse response of a momentum oscillator, with the only difference being that the non-zero values of the result will be equal to 1/p instead of 1.
The same thing applies to the WMA
above the impulse response of the first difference of a WMA, we can see it is extremely similar to the one of a high pass SMA, only 1 bar longer, as such we can have the first difference of a WMA quite easily. The TMA is simply a 2 pass SMA (the SMA of an SMA), as such the solution is also simple.
Trading With Colors7 hours ago
Hello friends. This is simply a moving average ribbon, per se. The values for the colored ribbon can have their length calculated to fit their chosen resolution on the current one. This solved problems for me, but it was my own solution. Maybe I'll learn something new from sharing this.
To everybody else who is learning as well, this script essentially serves to introduce other time-frame moving averages. This intends to helps traders find the scope of relevance and not get lost in the current time-frame.
Besides the colored moving averages (2 sets, different resolutions, great zoomed in our out), I included optional check-boxes to allow comparison of sets of moving averages at will, so that the most important to the individual trader can be compared and selected specifically.
I kept the default options set to keep it clean. It likely won't be the only indicator on one's chart, so it's naturally best to reduce indicator noise from one, as to not subtract from the benefit of the other indicators.
I integrated tons of acquired knowledge into this, so I hope somebody finds a missing piece to their collection or a solution to a coding problem within. I also hope this provides a new insight and helps others on their path to financial freedom.
Best wishes.
PS: I left some old code in comments in case it helps to understand the evolution of my code. I'll update this again once it works on the Daily. You might figure it out before I do, in wish case, do share :)

Combination Parabolic MA/IIR/ALMA Strategy, and other goodies Okay, so this is a lot. It started mostly with me combining indicators and looking for ideal entry criteria.
It is also a collection of conditions, whether used or unused, for my current chosen "best" strategy. It is currently set how I like it, but it has changed with time, and will continue to do so. Within, there are variables that are unused, but offer some insight into the overall odds of a trade. They were, in fact, once used but fell out of favor. And all details for this strategy are within the comment header of the script.
As this evolves, I most certainly wont keep any future findings and hope for profit from my peers (yinz). Also, I'd like to give a sincere thanks to the people of TV for what I learned in a few month's time and their flexible membership plans. Basically, I'm just a mad scientist, but this monster's a masterpiece and folks here before me made many indirect contributions to it.
--------------------------
Okay guys, lastly and most importantly,
Each smack of the like button is a vote of your confidence in me, to my beautiful landladies, Celeste and Adele, that my rent will be caught up and that it won't always be a problem. Which, in my mind, makes me a graph. And they've got strong hands and don't sell the low. I more than respect that. Seriously. And I'm very grateful for their willingness to work with me, but the thing is that I didn't ask first; life just happens. But few are tolerant of others. And quite importantly, I truly believe that I will be successful one day, and that "thumbs-up" button is your vote of confidence. If you're not sure, then don't hit it yet. Maybe my scripts will boost your confidence in me :)
-------------------------
PS: And you know what? I'ma give a shout-out to Philakone for teaching me everything that I know about Elliot Wave . Absolutely. Two years ago, I would keep telling myself that one day I will put something in his gratuity wallet or pursue the paid courses. And, I still plan on it, because I'm grateful. And so also, to everybody else, I'm recommending him to learn from. because as a trader who might not know everything for free, you can certainly fill in the gaps with his altruistic offerings. And I'm betting that you will then feel more than inclined to buy the Udemy course.
"If wave 2 retraces a lot; number 4 will not". Repetition. Philakone didn't fix my memory but he sure did find a workaround, haha
Okay, everyone, Thanks!

Combination Parabolic MA/IIR/ALMA Strategy, with other goodiesOkay, so this is a lot. It started mostly with me combining indicators and looking for ideal entry criteria.
It is also a collection of conditions, whether used or unused, for my current chosen "best" strategy. It is currently set how I like it, but it has changed with time, and will continue to do so. Within, there are variables that are unused, but offer some insight into the overall odds of a trade. They were, in fact, once used but fell out of favor. And all details for this strategy are within the comment header of the script.
As this evolves, I most certainly wont keep any future findings and hope for profit from my peers (yinz). Also, I'd like to give a sincere thanks to the people of TV for what I learned in a few month's time and their flexible membership plans. Basically, I'm just a mad scientist, but this monster's a masterpiece and folks here before me made many indirect contributions to it.
--------------------------
Okay guys, lastly and most importantly,
Each smack of the like button is a vote of your confidence in me, to my beautiful landladies, Celeste and Adele, that my rent will be caught up and that it won't always be a problem. Which, in my mind, makes me a graph. And they've got strong hands and don't sell the low. I more than respect that. Seriously. And I'm very grateful for their willingness to work with me, but the thing is that I didn't ask first; life just happens. But few are tolerant of others. And quite importantly, I truly believe that I will be successful one day, and that "thumbs-up" button is your vote of confidence. If you're not sure, then don't hit it yet. Maybe my scripts will boost your confidence in me :)
-------------------------
PS: And you know what? I'ma give a shout-out to Philakone for teaching me everything that I know about Elliot Wave . Absolutely. Two years ago, I would keep telling myself that one day I will put something in his gratuity wallet or pursue the paid courses. And, I still plan on it, because I'm grateful. And so also, to everybody else, I'm recommending him to learn from. because as a trader who might not know everything for free, you can certainly fill in the gaps with his altruistic offerings. And I'm betting that you will then feel more than inclined to buy the Udemy course.
"If wave 2 retraces a lot; number 4 will not". Repetition. Philakone didn't fix my memory but he sure did find a workaround, haha
Okay, everyone, Thanks!

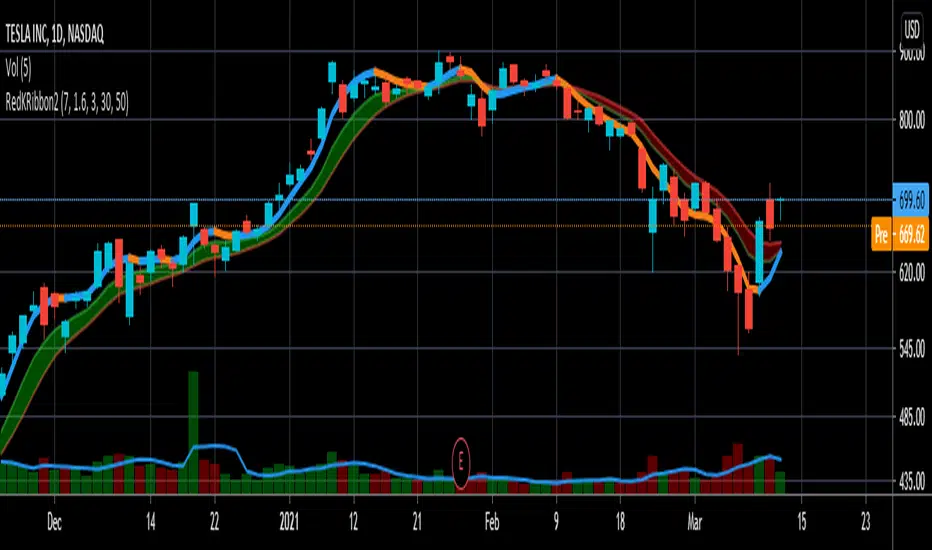
RedK Ribbon v2: Tracking Trend Made EasyThis is an update for the previously published RedK_Ribbon v1 -- and it adds some (hopefully) useful improvements:
1 - the Zero-Lag line is color-coded, to provide an early visual alert that momentum is fading, and the trend direction may change soon
2 - better colors for the ribbon :) - for the visually-oriented folks like me :)
3 - i added two optional EMAs that can be utilized as filters for the longer sentiment - to help a trader take positions only in the direction of the prevailing trends. note that these 2 EMA lines will be hidden by default until selected in the settings - to avoid clutter . Set to 30 and 50 by default but these lengths can be changed as needed
4 - code is open and commented
If you need to learn how we create the zero-lag moving average, pls refer to the "TA Basics" series - and if you need to learn more about how the Ribbon works, pls read the Ribbon v1 post
hope this is useful in your trading - and good luck!
Vwap Ribbon - JDThis indicator displays a custom timeframe VWAP line
together with several multiples of this timeframe
After a large price move, the price often tends to return to one of these multiples
JD.
#nottradingadvice
#DYOR

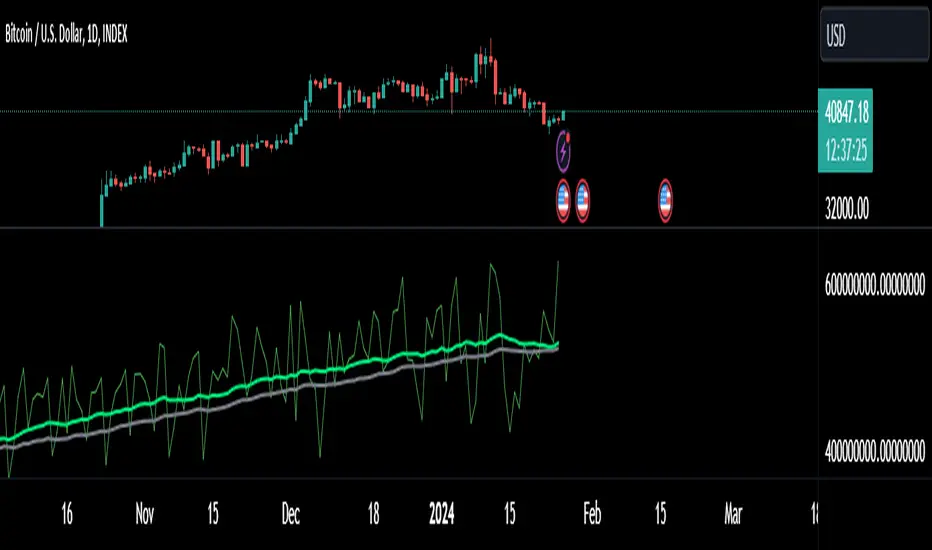
Hash Ribbons Backtest - Bitcoin Beats YT
Hello Hello Hello and welcome back to Bitcoin Beats!
This is a script written by capriole_charles
Go check out the original!
I have added leverage and stoploss % but also made it a strategy so we can look back at past trades to see patterns and profit.
Personally I feel this is not enough data to trade off as BTC is such a young asset. However I have seen other models similar to this for other assets that hold strong.
Trade safe!
Good bye from bitcoin beats!
Not Meant For The 1H! My Bad! higher timeframes are better!
The "Spring" is the confirmed Miner capitulation period:
The 1st "gray" circle is the start of Capitulation (1 month Hash Rate crosses UNDER 2 month Hash Rate)
Last "green" circle is the end of Capitulation (1 month Hash Rate crosses OVER 2 month Hash Rate)
The "greener" the spring gets (up until blue) represents Hash Rate recovery (it is increasing)
The "blue" circle is the first instance of positive momentum following recovery of Hash Rate (1m HR > 2m HR). This is historically a rewarding place to buy with limited downside.