(JS) Double StochasticThe idea for this indicator came from looking at the Stochastic RSI. The Stochastic RSI takes the RSI reading then applies the Stochastic formula to it - an indicator on top of an indicator. Using this logic, I decided to try using a Stochastic on the existing Stochastic in order to smooth it out - hence the "Double Stochastic". I have also added the option to add RSI on to the indicator as well (with smoothing if you'd like).
Resolution:
I added this so you can look at the reading on any time frame.
K & D:
This is the standard K% and D% used with the Stochastic indicator - the numbers modify the length of their calculations.
Smooth:
This is the smoothing calculation, also from the normal Stochastic indicator.
Use Second Stochastic:
This adds a second Stochastic on to the chart for analysis.
K & D 2:
This is the parameters used to calculate the second K% and D% lines.
Smooth 2:
This is the smoothing interval for the second K% and D% lines.
Use K% and D%:
The default for this is to have it on. What it means is that you wish to see both the K% and D% lines (watching for a cross). If you turn this off, the plot switches to a K% & D% difference line. It is just one line that plots the distance between the two.
SMA Length Using Difference:
If this is on, then you can smooth the difference plot with an SMA, obviously if you just want the raw difference to plot, then set this to 1.
Use RSI:
Since both RSI and Stochastic use a 0-100 scale, I added the ability to plot the RSI along with the Stochastic. This will not plot if you are using the Difference plot, being that plot isn't on a 0-100 scale.
Smooth RSI:
I also added the ability to smooth the RSI if you'd like, you can turn this off for the standard RSI reading.
RSI Length:
This is the period of bars used to calculate the RSI.
RSI Smoothing Length:
This is the smoothing interval if you'd like to apply a moving average on the regular RSI reading.
RSI Smoothing Use EMA:
This makes the RSI smoothing use an EMA, when off an SMA is used instead.
RSI Source:
And finally, this is the source used to calculate the RSI value.
I hope that you all may find this useful, I have been using it myself with a lot of success. Any questions, please leave them in the comments, thanks!
Rsi-2

[YummyProfit] RSI DivergenceHi everyone,
This scripts are used for learning and research purposes. THESE ARE NOT BUY/SELL SIGNALS.
If you have a better idea, share it here or contact me via msg. I will improve this script better in next version.
Settings:
Basically, you only need to care about "Lookback Level For Divs", this is the number of previously adjacent peak.
Feel free to use, share, comment & feedback.
Get indicator trading signals at yummyprofit.
Good luck!

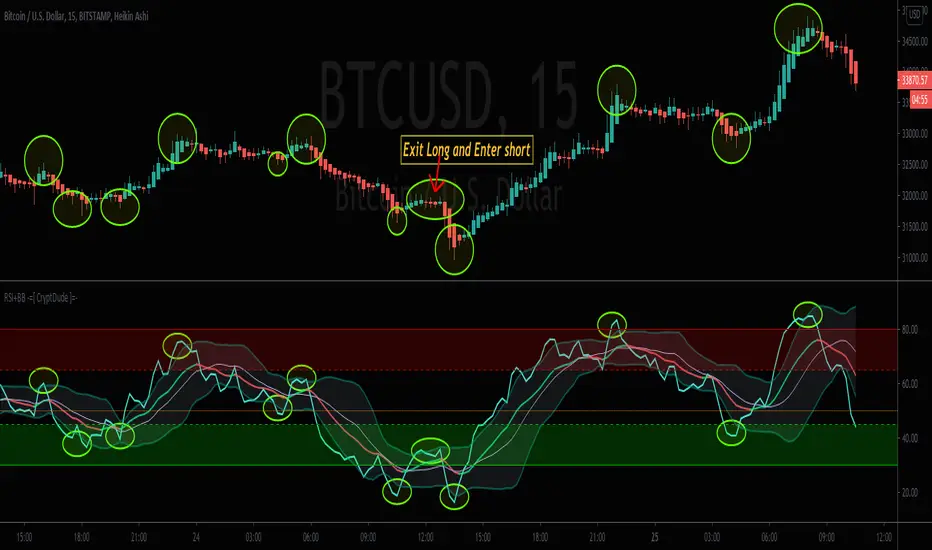
RSI+BB -=[ CryptDude ]=-RSI+BB
RSI + Bollingerbands
Credits
First of all I'd like to credit my trading pal, Vitaly905 who is a fellow Whale Crew associate for discovering this approach via another FOREX YouTuber, and turned me onto the general strategy. I created my own style template of the combo with the transitional trend color changes. My scripting skill were a little rusty at the time, so spoke with another trading friend in Whale Crew, MartyMcFly, and he put the script together for it and I generally went through, changed some nomenclature and touched some of the code as well. My other Whale Crew partner, Sydnet helped configure the alerts.
We're proud of it and hope you enjoy it. Just wanted to give credit to the collaborative effort.
The Strategy
The key to this strategy is to look for when the RSI gets very close or crosses above or below the Bollinger bands as indications of potential pivot ranges. You can also set Alerts for when the Bollinger Bands are crossed
Things to be aware of
(1) During the RSI peaks, be aware that most of them have a double hump or double tops on the RSI when they are close to or have breached the BB. Sot that means there's likely going to be an interval of time after the firs peak or dip before it finally pivots. This takes a little adjustment, but after a while you start to recognize the pattern. They almost look like an "M" on the tops and a "W" shape on the bottom; tilted in one direction or the other.
(2) Also during those peaks or dips, the RSI may move some, but price can move quite a bit more. So it's up to you, the trader, to trust your own analysis, by checking other known confluent momentum indications as to WHEN you should execute your entry, accordingly.
(3) There is a lot of consistency in this strategy after you spend more time getting intimate with it.
(4) I may ad convergence indication to it later, but It may pollute the chart more than being useful, as I don't have issue finding convergence.
(5) Set your own rules as to what constitutes an entry confirmation, which can be a confluence of other momentum indicators along with the RSI+BB.
Below is an example of the strategy with the price action
Happy trading!!
Your trading pal,
~ CryptDude
RSI HistogramThis an experiment to visualise the famous RSI indicator within a Histogram.
Opposed to regular RSI this RSI is plotted into a Histogram and uses different scales (100 to -100), in addition it has the ability to smooth the RSI with various moving averages like HMA, JMA and KAMA.
About RSI:
The RSI measures recent performance of a given stock against its own price history performance, by combining the average gain or loss a particular security owns over a predetermined time period.
Bars can be colored in Settings (Disabled by default)
Enjoy and like if you like :)

@thecf RSI + 12-EMA + Magic 89-EMA + RangesThis RSI has a couple modifications. It works with bullish and bearish control zones and implements both a 12 EMA as well as the "magic" 89 Moving Average.
First, the ranges. Whenever the RSI moves above 65 the bulls are in control.
Whenever the RSI moves blow 45 the bears are in control. Everything in between in neutral. Traders can use these levels for information on strength of either bulls or bears and also for support and resistance .
Both EMAs are best used for crossovers, as well as support and resistance .
The idea for the "magic" 89 moving average, originally stems from Fibonacci values that some traders like to use for support and resistance on price.
From observation, it holds more information though, when used as a moving average of the RSI and in combination with a 12 EMA .
When the RSI crosses above the 89 moving average, it can be interpreted as a potential shift in trend up. The 12 EMA then shortly afterwards usually confirms it by also crossing above the 89 moving average.
The 89 moving average can also signalize a potential shift in trend coming up when reaching 70.
The magic MA works best on timeframes like the daily and upwards.
For more information about the indicator feel free to leave a comment.

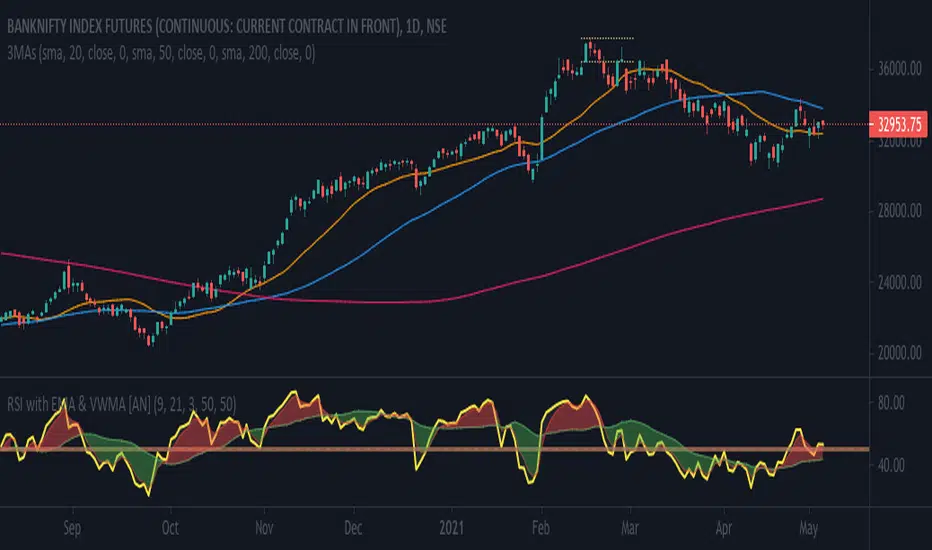
RSI with WMA & EMA [AN]Key Factors traced
- Price: EMA (Exponential Moving Average)
- Volume: WMA (Weighted Moving Avg.)
- Strength (Momentum): RSI (Relative Strength Indicator)
Default parameters
1. RSI at 9. Over brought & Under sold to 50 to be used as a median. This can be altered to the traditional 70:30 or 60:40
2. WMA at 21
3. EMA at 3, Exponential for Intraday trades
CCI & EMA_CROSS_PaydarCCI & EMA_CROSS_Paydar
Hello everyone
This indicator is actually a very efficient oscillator,
This system is a unique combination of indicators CCI and EMA, which of course has special settings, these settings are adjusted as much as possible due to signaling.
As you can see in the picture:
CCI: the two colors line, green and red, are actually the same indicator CCI that I set to 20.
*Note that in index CCI I have set the lines +100 and -100 to +75 and -75 for less error and a stronger signal to sell or buy.
EMA: The white line, which is in the form of steps, is in fact the same indicator of EMA, which I have considered as a value of 9.
_________________________________________________________________________________________________________
Instructions
-> areas:
Zone +75 to +200 = positive range or incremental price or bullish
Zone +75 to -75 = Neutral range or almost constant price (no fluctuations or very wet fluctuations)
Zone -75 to -200 = single range or discount price or bearish
->How to use:
Buy = In the bearish range, if line CCI intersects line EMA upwards and goes to the neutral zone.
None = if the index (or index lines) collide in the neutral zone
Sell = In the bullish range, if line CCI intersects line EMA down and goes to the neutral zone.
-> Please comment on this system or if you have a good experience in changing the values of the indicators or it seems to you, please share.
With great respect to:
Who had published the main idea of this system.

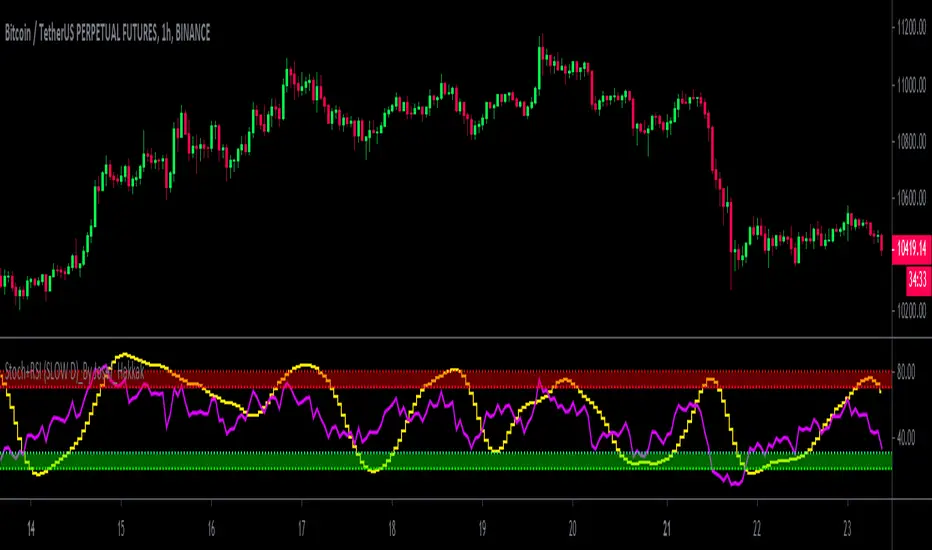
Stoch+RSI (SLOW D)_By Josef_HakkakStoch+RSI (SLOW D)_By Josef_Hakkak
Stochastic and RSI by SLOW D%
-> How to use:
B UY = When the yellow line (D of Slow Stoch ) goes out of the green range, it is better that the purple line ( RSI ) is be low
SELL = When the yellow line (D of Slow Stoch ) goes out of the red range, it is better to have the purple line ( RSI ) is be high
This script was previously written by RRanjanFX and has now been edited by me and changes have been made to optimize for shorter timeframes.
Edited and updated and optimized from:
RRanjanFX
Many thanks and loyal to RRanjanFX
Profit Accumulator On Balance VolumeOn Balance Volume Indicator
This is a support indicator to the Main Indicator which has also been published.
This indicator is from the basis of user Everget and a friend of mine on another site. This indicator has used a smoothing function in an attempt to provide more robust signals.
In this indicator the user is looking for:
Long trade: Upward sloping signal line and OBV greater than the signal line (shaded green).
Short trade: Downward sloping signal line and OBV less than the signal line (shaded red).
A horizontal signal line is a sign that the market is moving horizontally and trades should be placed very carefully. This indicator should definitely be used with the others in the suite to provide confluence when making a trade.
I've been using this successfully on the one hour FX charts, but seems to work equally as well on higher or lower time frames (not less than 15min).
The other indicators which are part of the suite are shown on the website which is highlighted in my signature at the bottom of the page. Purchase of the main indicator gives access to the full suite of eight indicators. I use the other indicators to confirm the direction of the trade and to determine if I want to trade or not. I use it along with the 2min, 15min and 4hr timeframes to identify the best entry window and how long I'm likely to be in the trade.
Support can be provided via private message or in the comments below.
The links are provided below for access to the indicator.

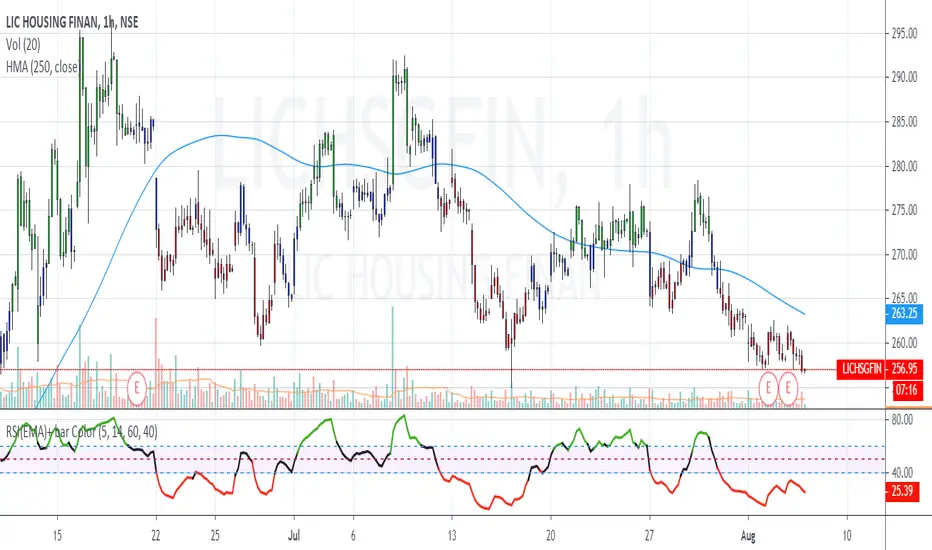
RSI(EMA) - Reducing Noise This script is a modified version of the Relative Strength Indicator ( RSI ). While using RSI to trade the markets, the signals generated are very choppy.
Approach 1. One way to reduce this noise is to use a higher period for the RSI calculation. (say 20 instead of 14 period). In this approach, the valid signal comes quite late.
Approach 2. My unique solution is to use a Exponential Moving Average as the input for the RSI calculation. Usually RSI calculations are based on close value of the candles. If we use an appropriate EMA value, then the signal efficiency will increase.
Using the approach 2, strategies similar to regular RSI can be utilized i.e. RSI breakout, RSI divergence, RSI Hidden divergence.
RSI Colors explained
GREEN = BULLISH momentum when RSI >60
RED = BEARISH momentum when RSI <40
BLACK = NEUTRAL market conditions when RSI is between 40 and 60
Breakout Strategy
LONGS - RSI color is GREEN + Price breaks a Resistance
SHORTS - RSI color is RED + Price breaks a Support
Recommended default settings: EMA =7 period , RSI =14 period
ADDITIONAL TIP: Works wonderfully with Pivot Points (standard)
I recommended to use on minimum 5 MINUTE timeframe for intraday trades . But you can use different timeframes as well.
Please leave comment below If you have any question or development idea.
DELTA7 HistogramDELTA7 Histogram is placement of the DELTA7 core functionality script into a centered oscilator show up 3-layered waves.
(this is not a signal bot. It's meant for analysis as toolkit for DELTA7 Suit traders)
Each wave are the reperesentation of the DELTA7 on-chart overlay trends plotted into a centered oscilator.
The Delta Lead is ploted as the baseline and the difference between Delta Lead, Delta-Price and Price Average from each wave.
This indicator will allow the trader/analyst to make observations around how extended are the trends against each other as well as serving as basis for divergence and trendline studies plotted manually by the analyst. The oscilator turn green/red (default color-scheme) as observable the main chart overlay.
This offer a horizontal plotted view of the same on-chart DELTA7 trends while making divergences or hyperbolic rallies more evident.
It also has the same DELTA7 scoring ploted into the baseline that match the default settings on DELTA7 ot alternatively user chan check in options for one of the available 7 scorings.
Furthermore, script has 7 available color-scheme themes (4 for dark background and 3 for light backgrounds)
DELTA7:
DELTA7 RSI :
This script is optional and meant to be used in combo with DELTA7 Suit main scripts.
Traders interested in this suit need to get in touch via DM or contact provided in signture.

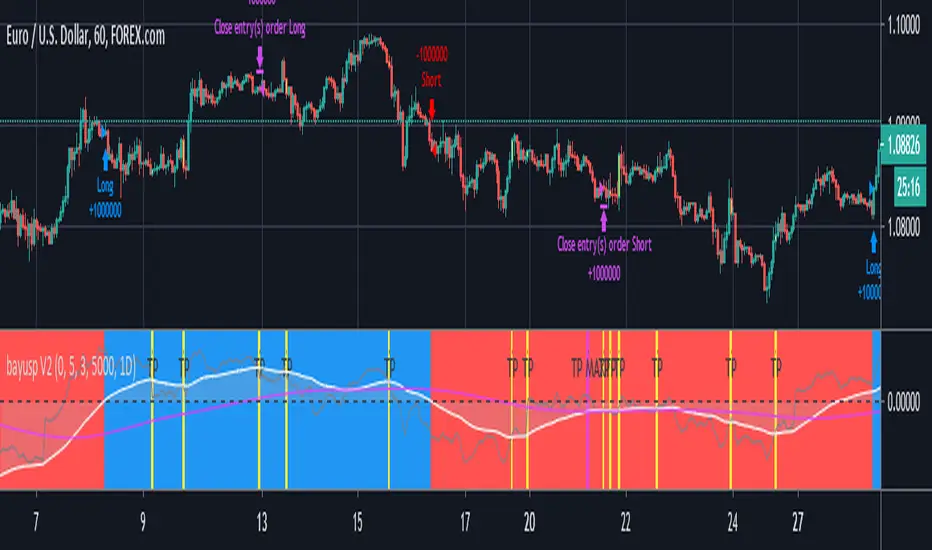
bayusp V2Using multi source like RSI , MACD , Stochastic , SMA , EMA and Huge Noural Network to Predicted Open Position.
Sell Gravitation IndexThe Sell Gravitation Index was created by Howard Wang and was published in Stocks & Commodities V37:02 (36-38)
This indicator is similar to the relative strength index but the big difference is that this indicator gives early buy and sell signals which I find very helpful. Buy when it rises above its signal line and sell when it falls below its signal line.
Let me know if you would like to see me publish any other scripts!

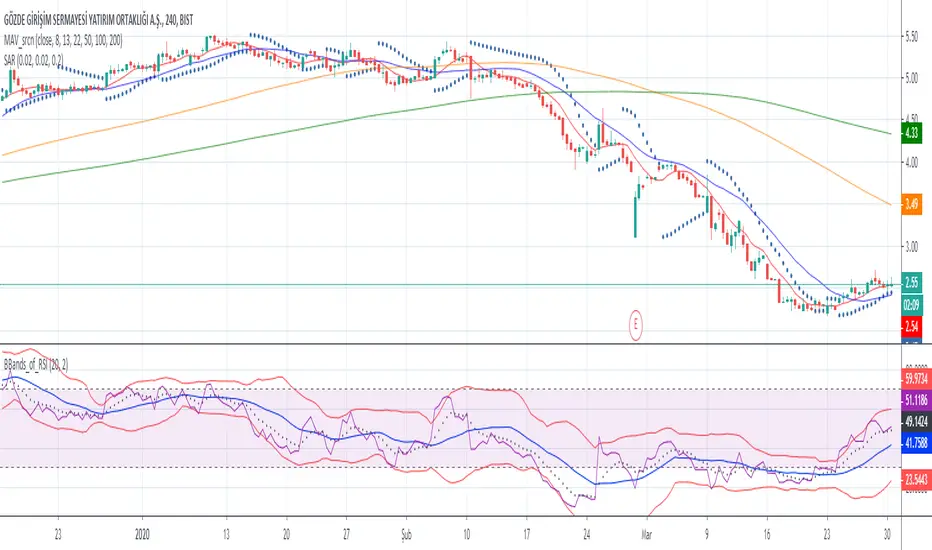
Bollinger Bands of RSIwith this script you can follow ema8 of RSI and also SMA20 of RSI with ∓ 2 standart deviation
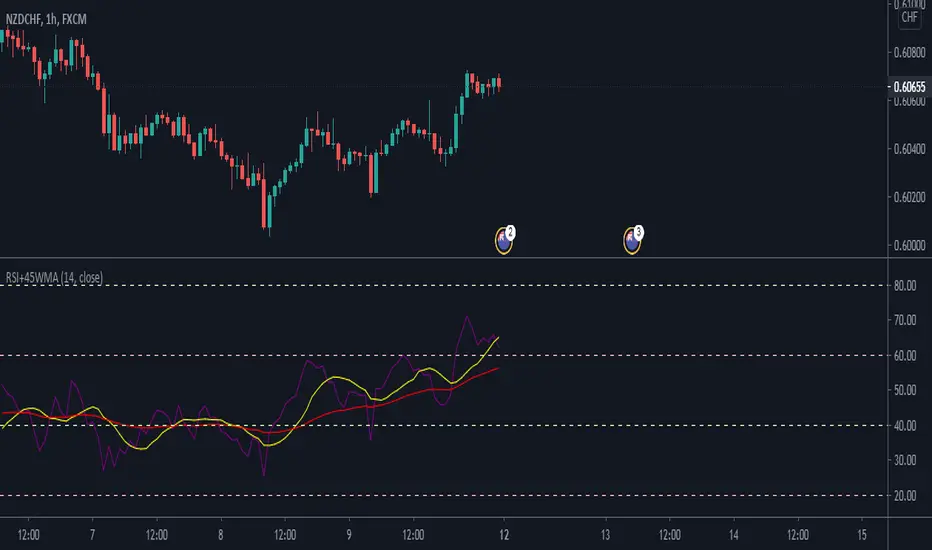
Divergence OBV RSI[mado]Divergence screener for OBV RSI
Regular Bullish: "D" navy label
Hidden Bullish: "H" navy label
Regular Bearish: "D" red label
Hidden Bearish: "H" red label

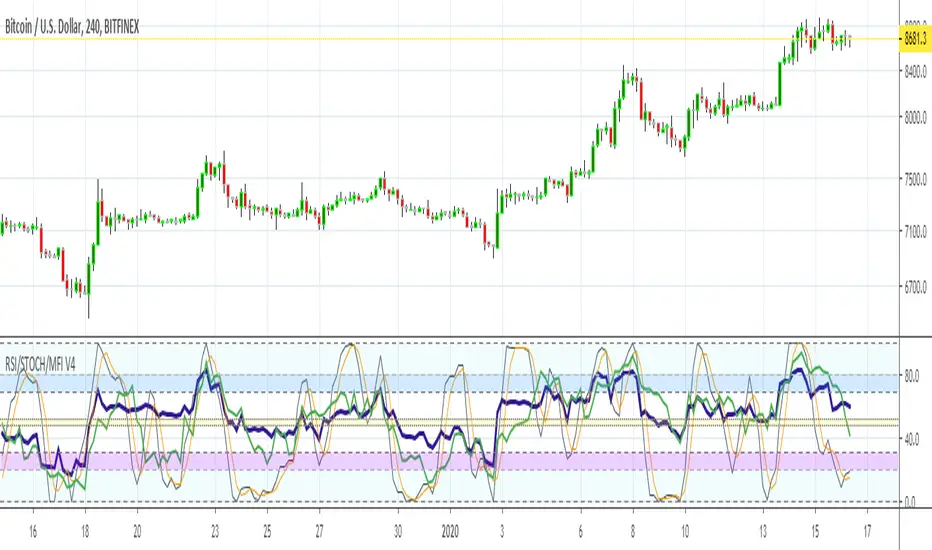
MFI RSI w STOCH OVERLAY V3Combines: Relative Strength (purple) and RSI Stoch (Orange/gray), Money Flow (green) all in one indicator window.
On screen indicator text identifier will read in this order: "RSI/STOCH/MFI V3"
// Changes from original version \\
It was important to bring forth the RSI indicator as the most visually important line and its relationship to the background.
A: Major visual changes from my first published one..as default now
1: Increased RSI line to size 3
2: Increased MFI line to size 2
3: Separated all Bar Line Fields in the background for custom editing, total of 5 now. Much easier to distinguish when the RSI enters these fields.
B: Other major changes as default now
1: Sped up the indicators from 14 to 11, for quicker response. (user can adjust back to 14 or another number)
2: Increased user friendly inputs to adjust colors, lines, data, etc.
3: (darken / lighten and change background colors, increase/decrease line strengths and colors, adjust field data inputs)
Enjoy and Good Luck Trading.
DW-RSI EMA with EMA of RSIThis is an RSI Oscillator with an EMA of the RSI for a signal line. The RSI line is Green when above the signal line and Red when below the signal line.
This does not use the traditional 30% / 70% over sold / over bought analysis. Therefore the levels are not shown.
The analysis is this:
When the RSI is above the signal line then price has a bullish bias.
When the RSI is below the signal line then price has a bearish bias.
I wrote use this for Forex Spot Currencies where I feel overbought and oversold may be less valid than it may be in other markets such as stocks.
As with all indicators, do not use as your sole reason to enter the market, but use with other indicators or price action signals to get a confluence of signals to confirm your entry.
I use it with an 8, 21 and 50 EMA to confirm entry and exit. I give it more weight for exits than I do for entries.

DELTA7 StrategyStrategy Tester Script for DELTA7. It includes all strategies in main scripts.
However, be aware that DELTA7's main purpose was designed to be an analysis tool system and not a signal bot.
DELTA7 System is a full-featured system with advanced chart-overlay and one augmented RSI oscillator that doesn't require any further indicators.
It's a complete solution focused on being simple and minimal for a traders/investors that want to make decisions based on momentum, trend, price and market structure.
Main scripts are found at
These indicators have been published for private-use and paid customers. Access cannot be granted to anyone else.
Thanks.

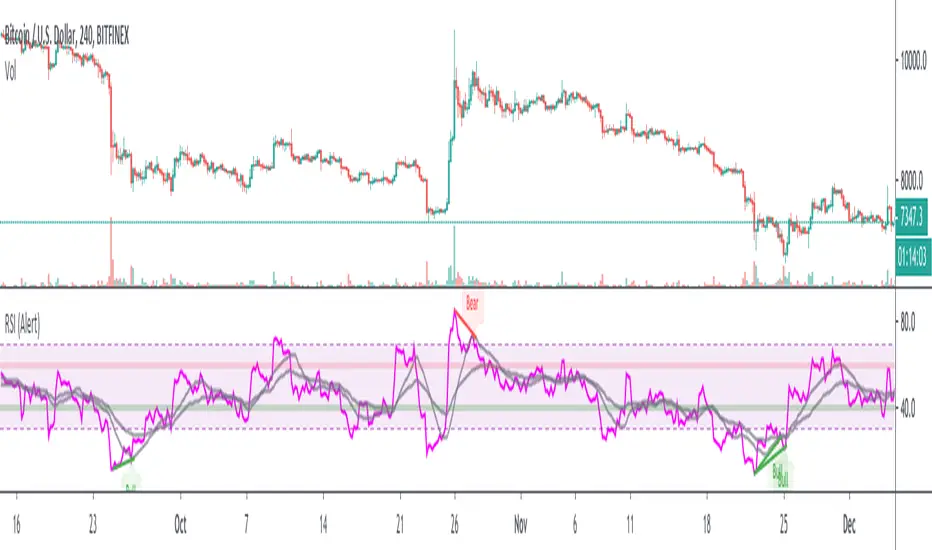
RSI w/ MAs & Divergences (Alert)This script fires off real-time RSI Divergence alerts.
To best use the RSI Divergence indicators, adjust the following settings accordingly.
• RSI Bullish Divergence Under: 20 – 45 (lower for larger volatility and more bearish markets)
• RSI Bearish Divergence Above: 55 – 80 (higher for larger volatility and more bullish markets)
Key Notes:
1. Set "Once Per Bar" instead of "Once Per Bar Close" alert.
The strategy already uses prior bar close (instead of current bar close) for calculation. This ensures that the signals will stay as they are after fired off, even when the current bar price is still changing.
2. It's OKAY to see the "alert may trigger differently than expected" warning.
Reason why you are seeing this warning is because we used a function called valuewhen() in our strategy. This function does not look at the entire history of data and has several limitations. For instance, on a 30min resolution, at the end of 2018, the function will be able to find past occurrences of BTC exceeding 16k. However, the function won't be able to find such occurrences at the end of 2019. Since our strategy is only concerned with very recent events, these limitations will not impact our results or cause repainting. You can find out more about this in the TradingView Wiki .
RSI w/ MAs & DivergencesTo best use the RSI Divergence indicators, adjust the following settings accordingly.
• RSI Bullish Divergence Under: 20 – 45 (lower for larger volatility and more bearish markets)
• RSI Bearish Divergence Above: 55 – 80 (higher for larger volatility and more bullish markets)
THIS SCRIPT DOES NOT REPAINT AND IS COMPLETELY FREE.

RSI with Moving Averages[UO]This RSI indicator is one of my favorite indicators. This powerful indicator is implemented by Phi-Deltalytics. I modified the drawing so that it is easier (at least for me) to see the signals and trends (it would not matter if you're doing algorithmic trading).
Trends and signals. For detailed instructions and tutorial see Phi-Deltalytics page

Gaussian MFI BFThe signals are based on the Gaussian Channel calculated by Donovan Wall. Thanks also to Kiasaki for Rate of Change code.
Simply going long and short based on Gaussian channel was not consistent enough so I also included an MFI filter. We only go long if Money Flow Index is greater than the last candle (more money is flowing in than out). The opposite for short. Also employed Rate of Change function (white background) to avoid sideways market.
A 2% stop loss seems to be the most balanced for this strategy but can can altered in the settngs.
Also included a take-profit function but it seems this is best not implemented for this strategy, at least in the case of XBT/USD.
A derivative of The MFI is also plotted on the chart simply to compare the current candle with the last candle visually.
Background color:
Green = Long
Red = Short
White = No Trade
