Dynamic RSI Regression Bands (Zeiierman)█ Overview
The Dynamic RSI Regression Bands (Zeiierman) is a regression channel tool that dynamically resets based on RSI overbought and oversold conditions. It adapts to trend shifts in real time, creating a highly responsive regression framework that visualizes market sentiment and directional momentum with every RSI-triggered event.
Unlike static regression models, this indicator recalibrates its slope and deviation bands only after the RSI crosses predefined thresholds, helping traders pinpoint new phases of momentum, exhaustion, or reversal.
You’re not just measuring the trend — you’re tracking when and where the trend deserves to be re-evaluated.
█ The Assumption:
"A major momentum shift (RSI crossing OB/OS) signals a potential regime change, and thus, the trend model should be recalibrated from that point."
Instead of using a fixed-length regression (which assumes trend relevance over a static window), this script resets the regression calculation every time RSI crosses into extreme territory. The underlying idea is that extreme RSI levels often represent emotional peaks in market behavior and are statistically likely to be followed by a new price structure.
█ How It Works
⚪ RSI-Based Channel Reset
RSI is monitored continuously
If RSI crosses above the Overbought level, the indicator resets and starts a new regression channel
If RSI crosses below the Oversold level, the same reset logic applies
These events act as “anchor points” for dynamic trend analysis
⚪ Regression Channel Logic
A custom linear regression is calculated from the RSI reset point forward
The lookback grows with each bar after the reset, up to a user-defined max
Regression lines are drawn from the reset point to the current bar
⚪ Standard Deviation Bands
Upper and lower bands are plotted around the regression line using the standard deviation
These serve as dynamic volatility envelopes, great for spotting breakouts or reversals
⚪ Rejection Markers
If price hits the upper/lower band and then closes back inside it, a rejection marker is plotted
Helps visualize failed breakouts and areas of absorption or reversal pressure
█ How to Use
⚪ Detect Trend Shifts
Use the RSI resets to identify when the trend might be starting fresh.
⚪ Watch the Bands for Volatility Extremes
Use the outer bands as soft areas of potential reversal or momentum breakout.
⚪ Spot Rejections for Potential Entry Signals
If price moves outside a band but then quickly returns inside, it often means the breakout failed, and price may reverse.
█ Settings Explained
RSI Length – How many bars RSI uses. Shorter = faster.
OB / OS Levels – Crossing these triggers a regression reset.
Base Regression Length – Max number of bars regression can use post-reset.
StdDev Multiplier – Controls band width from the regression line.
Min Bars After Reset – Ensures channel doesn’t form immediately; waits for structure.
Show Reset Markers – Triangles mark where RSI crossed OB/OS.
Show Rejection Markers – Circles mark where the price rejected the channel edge.
-----------------
Disclaimer
The content provided in my scripts, indicators, ideas, algorithms, and systems is for educational and informational purposes only. It does not constitute financial advice, investment recommendations, or a solicitation to buy or sell any financial instruments. I will not accept liability for any loss or damage, including without limitation any loss of profit, which may arise directly or indirectly from the use of or reliance on such information.
All investments involve risk, and the past performance of a security, industry, sector, market, financial product, trading strategy, backtest, or individual's trading does not guarantee future results or returns. Investors are fully responsible for any investment decisions they make. Such decisions should be based solely on an evaluation of their financial circumstances, investment objectives, risk tolerance, and liquidity needs.
Rsibreakout

Megabar Breakout (Range & Volume & RSI)Hey there,
This strategy is based on the idea that certain events lead to what are called Megabars. Megabars are bars that have a very large range and volume. I wanted to verify whether these bars indicate the start of a trend and whether one should follow the trend.
Summary of the Code:
The code is based on three indicators: the range of the bar, the volume of the bar, and the RSI. When certain values of these indicators are met, a Megabar is identified. The direction of the Megabar indicates the direction in which we should trade.
Why do I combine these indicators?
I want to identify special bars that have the potential to mark the beginning of a breakout. Therefore, a bar needs to exhibit high volume, have a large range (huge price movement), and we also use the Relative Strength Index (RSI) to assess potential momentum. Only if all three criteria are met within one candle, do we use this as an identifier for a megabar.
Explanation of Drawings on the Chart:
As you can see, there is a green background on my chart. The green background symbolizes the time when I'm entering a trade. Only if a Megabar happens during that time, I'm ready to enter a trade. The time is between 6 AM and 4 PM CET. It's just because I prefer that time. Also, the strategy draws an error every time a Megabar happens based on VOL and Range only (not on the RSI). That makes it pretty easy to go through your chart and check the biggest bars manually. You can activate or deactivate these settings via the input data of the strategy.
When Do We Enter a Trade?
We wait for a Megabar to happen during our trading session. If the Megabar is bullish, we open a LONG trade at the opening price of the next candle. If the Megabar is bearish, we open a SHORT trade at the opening price of the next candle.
Where Do We Put Our Take Profit & Stop Loss?
The default setting is TP = 40 Pips and SL = 30 Pips. In that case, we are always trading with a risk-reward ratio of 1.33 by default. You can easily change these settings via the input data of the strategy.
Strategy Results
The criteria for Megabars were chosen by me in a way that makes Megabars something special. They are not intended to occur too frequently, as the fundamental idea of this strategy would otherwise not hold. This results in only 37 closed trades within the last 12 months. If you change the criterias for a megabar to a milder one, you will create more Megabars and therefore more trades. It's up to you. I have adapted this strategy to the 30-minute chart of the EURUSD. In the evaluation, we consider a period of 12 months, which I believe is sufficient.
My default settings for the indicators look like this:
Avg Length Vol 20
Avg Multiplier Vol 3
Avg Length Range 20
Avg Multiplier Range 4
Value SMA RSI for Long Trades 50
Value SMA RSI for Short Trades 70
IMPORTANT: The current performance overview does not display the results of these settings. Please change the settings to my default ones so that you can see how I use this strategy.
I do not recommend trading this strategy without further testing. The script is meant to reflect a basic idea and be used as a tool to identify Megabars. I have made this strategy completely public so that it can be further developed. One can take this framework and test it on different timeframes and different markets.

The Flash-Strategy (Momentum-RSI, EMA-crossover, ATR)The Flash-Strategy (Momentum-RSI, EMA-crossover, ATR)
Are you tired of manually analyzing charts and trying to find profitable trading opportunities? Look no further! Our algorithmic trading strategy, "Flash," is here to simplify your trading process and maximize your profits.
Flash is an advanced trading algorithm that combines three powerful indicators to generate highly selective and accurate trading signals. The Momentum-RSI, Super-Trend Analysis and EMA-Strategy indicators are used to identify the strength and direction of the underlying trend.
The Momentum-RSI signals the strength of the trend and only generates trading signals in confirmed upward or downward trends. The Super-Trend Analysis confirms the trend direction and generates signals when the price breaks through the super-trend line. The EMA-Strategy is used as a qualifier for the generation of trading signals, where buy signals are generated when the EMA crosses relevant trend lines.
Flash is highly selective, as it only generates trading signals when all three indicators align. This ensures that only the highest probability trades are taken, resulting in maximum profits.
Our trading strategy also comes with two profit management options. Option 1 uses the so-called supertrend-indicator which uses the dynamic ATR as a key input, while option 2 applies pre-defined, fixed SL and TP levels.
The settings for each indicator can be customized, allowing you to adjust the length, limit value, factor, and source value to suit your preferences. You can also set the time period in which you want to run the backtest and how many dollar trades you want to open in each position for fully automated trading.
Choose your preferred trade direction and stop-loss/take-profit settings, and let Flash do the rest. Say goodbye to manual chart analysis and hello to consistent profits with Flash. Try it now!
General Comments
This Flash Strategy has been developed in cooperation between Baby_whale_to_moon and JS-TechTrading. Cudos to Baby_whale_to_moon for doing a great job in transforming sophisticated trading ideas into pine scripts.
Detailed Description
The “Flash” script considers the following indicators for the generation of trading signals:
1. Momentum-RSI
2. ‘Super-Trend’-Analysis
3. EMA-Strategy
1. Momentum-RSI
• This indicator signals the strength of the underlying upward- or downward-trend.
• The signal range of this indicator is from 0 to 100. Values > 60 indicate a confirmed upward- or downward-trend.
• The strategy will only generate trading signals in case the stock (or any other financial security) is in a confirmed upward- (long entry signals) or downward-trend (short entry signals).
• This indicator provides information with regards to the strength of the underlying trend and it does not give any insight with regard to the direction of the trend. Therefore, this strategy also considers other indicators which provide technical confirmation with regards to the direction of the underlying trend.
Graph 1 shows this concept:
• The Momentum-RSI indicator gives lower readings during consolidation phases and no trading signals are generated during these periods.
Example (graph 2):
2. Super-Trend Analysis
• The red line in the graph below represents the so-called super-trend-line. Trading signals are only generated in case the price action breaks through this super-trend-line indicating a new confirmed upward-trend (or downward-trend, respectively).
• If that happens, the super trend-line changes its color from red to green, giving confirmation that the trend changed from bearish to bullish and long-entries can be considered.
• The vice-versa approach can be considered for short entries.
Graph 3 explains this concept:
3. Exponential Moving Average / EMA-Strategy
The functionality of this EMA-element of the strategy has been programmed as follows:
• The exponential moving average and two other trend lines are being used as qualifiers for the generation of trading-signals.
• Buy-signals for long-entries are only considered in case the EMA (yellow line in the graph below) crosses the red line.
• Sell-signals for short-entries are only considered in case the EMA (yellow line in the graph below) crosses the green line.
An example is shown in graph 4 below:
We use this indicator to determine the new trend direction that may occur by using the data of the price's past movement.
4. Bringing it all together
This section describes in detail, how this strategy combines the Momentum-RSI, the super-trend analysis and the EMA-strategy.
The strategy only generates trading-signals in case all of the following conditions and qualifiers are being met:
1. Momentum-RSI is higher than the set value of this strategy. The standard and recommended value is 60 (graph 5):
2. The super-trend analysis needs to indicate a confirmed upward-trend (for long-entry signals) or a confirmed downward-trend (for short-entry signals), respectively.
3. The EMA-strategy needs to indicate that the stock or financial security is in a confirmed upward-trend (long-entries) or downward-trend (short-entries), respectively.
The strategy will only generate trading signals if all three qualifiers are being met. This makes this strategy highly selective and is the key secret for its success.
Example for Long-Entry (graph 6):
When these conditions are met, our Long position is opened.
Example for Short-Entry (graph 7):
Trade Management Options (graph 8)
Option 1
In this dynamic version, the so-called supertrend-indicator is being used for the trade exit management. This supertrend-indicator is a sophisticated and optimized methodology which uses the dynamic ATR as one of its key input parameters.
The following settings of the supertrend-indicator can be changed and optimized (graph 9):
The dynamic SL/TP-lines of the supertrend-indicator are shown in the charts. The ATR-length and the supertrend-factor result in a multiplier value which can be used to fine-tune and optimize this strategy based on the financial security, timeframe and overall market environment.
Option 2 (graph 10):
Option 2 applies pre-defined, fixed SL and TP levels which will appear as straight horizontal lines in the chart.
Settings options (graph 11):
The following settings can be changed for the three elements of this strategy:
1. (Length Mom-Rsi): Length of our Mom-RSI indicator.
2. Mom-RSI Limit Val: the higher this number, the more momentum of the underlying trend is required before the strategy will start creating trading signals.
3. The length and factor values of the super trend indicator can be adjusted:ATR Length SuperTrend and Factor Super Trend
4. You can set the source value used by the ema trend indicator to determine the ema line: Source Ema Ind
5. You can set the EMA length and the percentage value to follow the price: Length Ema Ind and Percent Ema Ind
6. The backtesting period can be adjusted: Start and End time of BackTest
7. Dollar cost per position: this is relevant for 100% fully automated trading.
8. Trade direction can be adjusted: LONG, SHORT or BOTH
9. As we explained above, we can determine our stop-loss and take-profit levels dynamically or statically. (Version 1 or Version 2 )
Display options on the charts graph 12):
1. Show horizontal lines for the Stop-Loss and Take-profit levels on the charts.
2. Display relevant Trend Lines, including color setting options for the supertrend functionality. In the example below, green lines indicate a confirmed uptrend, red lines indicate a confirmed downtrend.
Other comments
• This indicator has been optimized to be applied for 1 hour-charts. However, the underlying principles of this strategy are supply and demand in the financial markets and the strategy can be applied to all timeframes. Daytraders can use the 1min- or 5min charts, swing-traders can use the daily charts.
• This strategy has been designed to identify the most promising, highest probability entries and trades for each stock or other financial security.
• The combination of the qualifiers results in a highly selective strategy which only considers the most promising swing-trading entries. As a result, you will normally only find a low number of trades for each stock or other financial security per year in case you apply this strategy for the daily charts. Shorter timeframes will result in a higher number of trades / year.
• Consequently, traders need to apply this strategy for a full watchlist rather than just one financial security.

Rich Robin Index, The Crypto Fear & Greed Index with RSI Trend The Relative Strength Index (RSI) is a technical indicator based on price movements that is used to determine whether a particular asset is overbought or oversold. It measures the ratio of rising to falling prices over a certain period of time.
The Fear & Greed Index, on the other hand, is a composite index that tracks the sentiment of the crypto market. It is based on seven indicators, each of which measures a different aspect of market behavior. These indicators are: Safe Haven Demand, Stock Price Breadth, Market Momentum, Stock Price Strength, Put and Call Options, Junk Bond Demand, and Market Volatility.
The combination of the RSI and the Fear & Greed Index can provide valuable insights for crypto traders. The RSI can help identify overbought and oversold conditions, while the Fear & Greed Index can give an overall sense of the sentiment in the market. Together, they can provide a more complete picture of the market conditions. For example, if the RSI is indicating that an asset is overbought, but the Fear & Greed Index is showing that the market is still in a state of fear, it may be a good time to sell. On the other hand, if the RSI is indicating that an asset is oversold, but the Fear & Greed Index is showing that the market is in a state of greed, it may be a good time to buy.
Overall, the combination of the RSI and the Fear & Greed Index can provide useful information for traders to make more informed decisions, by giving a sense of the market conditions, and providing a way to identify overbought and oversold conditions.

RSI Accumulation/Distribution [M]Hello everyone,
After my long tests, I observed that the rate of change of direction of the price was high after the periods when the RSI spent a long time outside the band. As a result of my observations, I prepared this indicator.
This indicator shows you the accumulation and distribution areas that occur outside the rsi band.
There are 3 different levels available.
Level 1 = 5 Bars
Level 2 = 7 Bars
Level 3 = 9 Bars
For example, if the RSI spends more than 9 bars below the 30 level or above the 70 level, it will paint that area red. Levels can be changed from the indicator settings. The rsi is smoothed with simple moving average to reduce fake signals.
Using the RSI A/D indicator with different indicators or patterns will increase your success rate.
Examples:

RSI ProfileThis indicator shows the RSI profile from historical RSI Value and High / Low RSI Pivots.
It is inspired by the Volume Profile which is a common charting study that indicates activity at specified levels. It plots a histogram on the chart meant to identify dominant/significant levels.
This script is profiling RSI levels into a histogram, which can identify the crucial RSI values in the chart. Along with the pivot options that can help identify the dominant pivot points where RSI values had been rebounding historically.
How to use:
There are three profile types available in the settings. When selecting RSI Values, the indicator will count RSI values from history, and plot the count in a histogram at the end of the chart. If you select RSI Pivots High or RSI Pivots Low, the indicator will count only the RSI Pivot Highs and Lows and plot the count in a histogram. Users can select the Pivot Left/Right length from the settings.
Users can extend the POC line to the left, to study how the values had been reacting to POC
Please note: Since the RSi values range from 0 to 100, the indicator is rounding off the values to absolute numbers. This can cause a situation where multiple POC are identified, to find the unique POC, you can increase the width of the histogram.
The Max/Min RSI settings are for visual purposes only, it can help users shrink down the histogram's top and bottom visibility

Multi Type RSI [Misu]█ This Indicator is based on RSI ( Relative Strength Index ) & multiple type of MA (Moving Average) to show different variations of RSI.
The relative strength index (RSI) is a momentum indicator used in technical analysis to evaluate overvalued or undervalued conditions in the price of that security.
█ Usages:
The purpose of this indicator is to obtain the RSI calculated with different MAs modes instead of the classic RMA.
The red and green zones indicate the oversold and overbought zones.
Buy or sell signals are marked by the green and red circles
We have 2 different signal modes : when the different size RSIs cross and when the fast RSI crosses the extreme bands.
Alerts are setup.
█ Parameters:
Lenght RSI: The lenght of the RSI. (14 by default)
RSI MA Type: The type of MA with which the rsi will be calculated. ("SMA", "EMA", "SMMA (RMA)", "WMA", "VWMA")
Fast Lenght MA: The fast lenght smoothing MA.
Slow Lenght MA: The Slow lenght smoothing MA.
Lower Band: The lenght of the lower band. (25 by default)
Upper Band: The lenght of the upper band. (75 by default)
Signal Type: The mode with which buy and sell signals are triggered. ("Cross 2 Mas", "Cross Ma/Bands")

RSI Scalping & Swing Signals With AlertsThis RSI indicator shows a green or red ribbon when the smoothed RSI is bullish or bearish. It also includes a long moving average for overall trend confirmation. Wait until the ribbon holds above or below the long moving average and take positions in that direction.
To get an easier to read RSI indicator, I smoothed the RSI out and paired it next to a short term RMA. These two together form the ribbon that will show you early reversals and trend direction. The long moving average is used as an overall trend detector and confirmation for longer term trends.
***HOW TO USE***
Scalping: Enter longs when the ribbon turns green and enter shorts when the ribbon turns red. Exit positions when the ribbon turns the opposite color or crosses the long moving average.
Swing Trading: When the ribbon holds above the long moving average or breaks out and retests it, look for long positions and exit when the ribbon turns red or crosses the long moving average. When the ribbon holds below the long moving average or breaks down and retests it, look for short positions and exit when the ribbon turns green or crosses the long moving average.
***DETAILS***
This indicator gives early reversal signals very well and waiting for the RSI ribbon to cross the long moving average helps to get you into positions when the market is ready to really move while filtering out some of the noise.
The ribbon and background will change to green or red depending on whether it is currently bullish or bearish.
There is also a label that changes colors and tells you if RSI is bullish or bearish and also whether the RSI ribbon is above or below the long moving average.
Green or red circles will appear on the indicator when there is a bullish or bearish cross of the RSI ribbon and the long moving average.
It also has alerts that trigger when RSI is turning bullish/bearish or when the RSI ribbon is crossing the long moving average.
***CUSTOMIZATION***
Each piece of this indicator can be customized to suit your preferences including the RSI source, length, smoothing length, short moving average length and long moving average length. You can also turn off the labels, signals and long moving average. All of these settings can be managed within the indicator settings input tab.
***MARKETS***
This indicator can be used as a signal on all markets, including stocks, crypto, futures and forex.
***TIMEFRAMES***
This RSI Scalping & Swing Signals indicator can be used on all timeframes.
***TIPS***
Try using numerous indicators of ours on your chart so you can instantly see the bullish or bearish trend of multiple indicators in real time without having to analyze the data. Some of our favorites are Trend Friend Scalp & Swing Trade Signals, Volume Spike Scanner, Buy & Sell Pressure Volume Profile, and Momentum Scalper in combination with this RSI indicator. They all have real time Bullish and Bearish labels as well so you can immediately understand each indicator's trend.

BB-RSI-ADX Entry PointsThis is a combination of indicators used to find oversold and overbought entry points for possible reversion.
A Green arrow will appear when all condition are met for an ENTER LONG position.
A Red arow will appear when all condition are met for an ENTER SHORT position.
You can modify all of these condition parameters from the indicator's settings.
How does the indicator work
The signals are using Bollinger Bands , BB %B , RSI and ADX indicators to try and find points of reversal
Enter LONG Conditions
Current candle low is below BB lower band.
The BB %B is more than 0.
RSI > 30
ADX > 25
Enter SHORT Conditions
Current candle high is above BB upper band.
The BB %B is less than 1.
RSI < 70
ADX > 25
Those are the default settings that seem to work for me but you can customize all of these from the indicator settings.
I find this strategy to best work on a 3 minute timeframe
Note: The bb %B is calculated for stDev - 1. This will help you see a change happening faster.

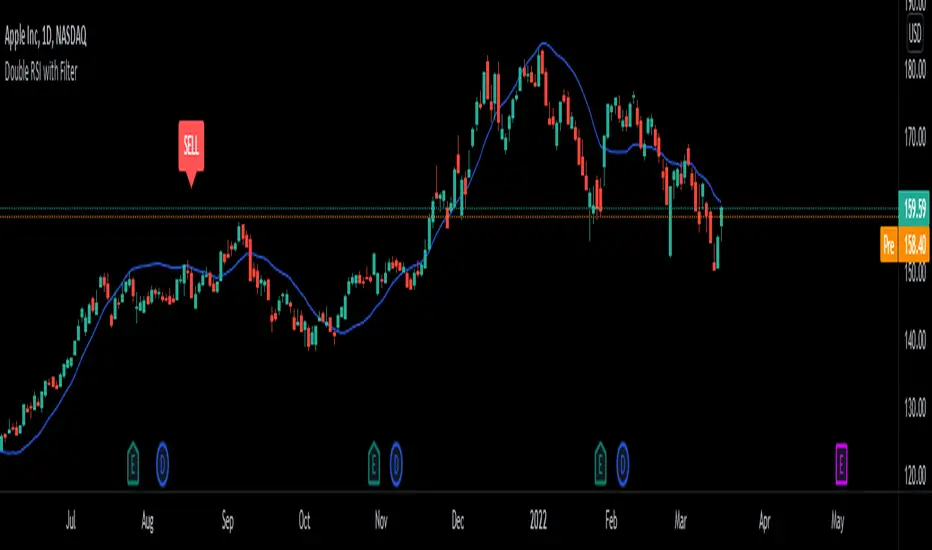
Double RSI/LSMA Double RSI uses a Slow RSI combined with a Fast RSI to generate Buy and Sell signals. Least Squares Moving Average is only here for filtering signals. It is very good on certain stocks or ETFs on longer timeframes for swing trading. If you get a Buy signal look at the LSMA trend and if the candle is above the LSMA. It works great for me on lower timeframes scalping futures and on higher timeframes swinging options. It is better than paying for Buy and Sell signals. Its my first script/indicator so play with it and see what you think. Let me know if you guys find anything that makes it better. Hopefully this helps some traders out there.
[CP]3 RSI Multi Timeframe InceptionTriple RSI indicator where you can set the timeframe for each RSI.
Take confirmation from different timeframes to make high probability trades!
Typical settings would be,
1 Day, 1 Week, 1 Month or
1 hr, 4hr, 1 Day or
3 min, 15 min, 1 hr or.........your imagination is the only limit here!

VWAP Relative Strength Index [CC]This is a custom indicator of mine that uses the volume weighted average price instead of the close price as the source for calculations of the relative strength index. Buy when the indicator line is green and sell when it is red.
This was a custom request so let me know if there are any other scripts you would like to see me do or if you want something custom done!

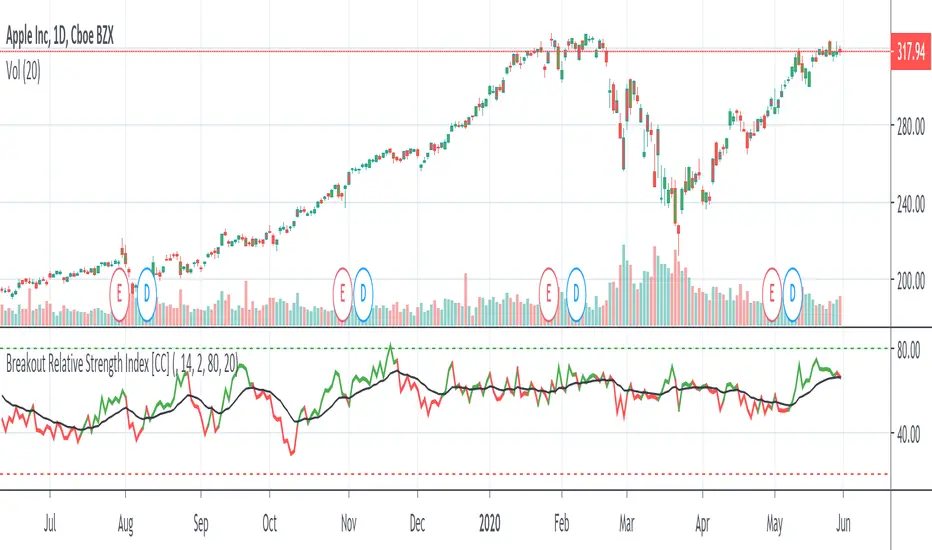
Breakout Relative Strength IndexIt isn't easy to determine if the price of a stock is about to break out. Here’s one way you can determine the relative strength of a breakout, enabling you to act early and realize higher profits.
This indicator was originally developed by Howard Wang Stocks & Commodities V. 33:09 (60–62)
QuantNomad - RSI Strategy - NKE - 5mReally good performance of Simple RSI Strategy for Nike (NKE) 5m chart.
Params: RSI Length: 30, RSI OverSold level: 45, RSI OverBought Level: 60
Performance:57% profit, 112 trades, 73% prof, 6.7% dd, 1.36 sharpe.
And remember:
Past performance does not guarantee future results.

Kozlod - RSI Strategy - 1 minuteStarted to play with very simple strategies. Trying to find ones with optimal parameters which work well for certain symbols/timeframe.
Found that basic RSI strategy without any position management with high RSI length (65 in this script) works pretty good for 1m chart for few stocks.
It's also not bad for AAPL , SPY .
It might not work very good on it's not but can give you a pretty good base for more complicated indicators.
And remember:
Past performance does not guarantee future results.

RSI simple Long ShortSimple indicator when RSI goes above 75 or below 25. It gives signal at next proper candle.

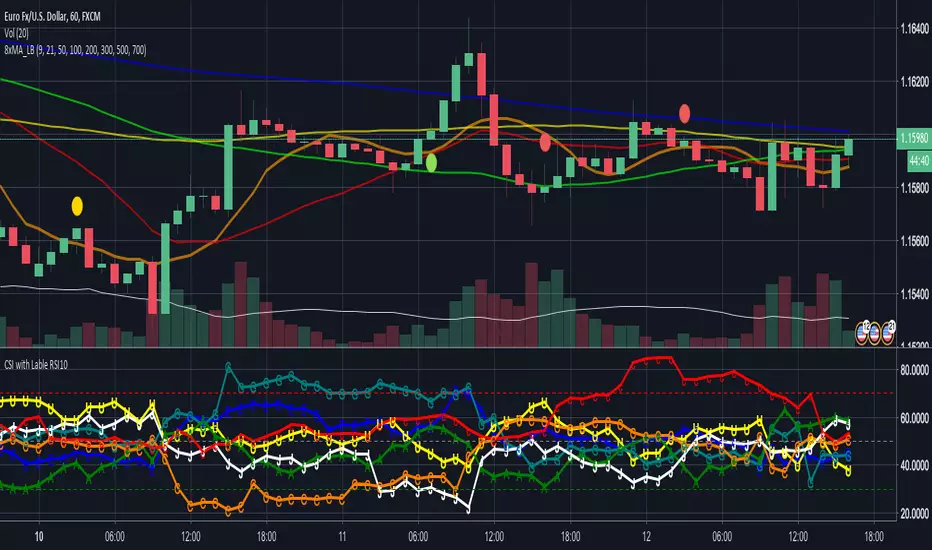
CSI - Currency strength indicator RSI 10This Indicator shows you the strength of the Currency in comparison for all other Main Currencys at the timeframe you choose.
The Currencys in this Indicator is: EUR, USD, GBP, CHF, AUD, CAD, JPY
The Base is the RSI (relative strength Indicator) with the following Currency pairs:
eurusd, eurgbp, euraud, eurjpy, eurcad, eurchf
usdeur, usdgbp, usdaud, usdjpy, usdcad, usdchf
gbpeur, gbpusd, gbpaud, gbpjpy, gbpcad, gbpchf
audeur, audusd, audgbp, audjpy, audcad, audchf
jpyeur, jpyusd, jpyaud, jpygbp, jpycad, jpychf
cadeur, cadusd, cadaud, cadgbp, cadjpy, cadchf
chfeur, chfusd, chfaud, chfgbp, chfjpy, chfcad
The letters in the LineChart:
EUR = E
USD = U
GBP = G
CHF = C
AUD = A
CAD = C
JPY = J
The CSI can help to see, if your trading pair have the potential to breakout on the support and resistance or if it more likely go back.
Some people say that the banks use this indicator.
NZD is missing there because Tradingview only support 6 variables.
If you have a solution for than, please let me know.
Thanks