Multi-Ticker Anchored CandlesMulti-Ticker Anchored Candles (MTAC) is a simple tool for overlaying up to 3 tickers onto the same chart. This is achieved by interpreting each symbol's OHLC data as percentages, then plotting their candle points relative to the main chart's open. This allows for a simple comparison of tickers to track performance or locate relationships between them.
> Background
The concept of multi-ticker analysis is not new, this type of analysis can be extremely helpful to get a gauge of the over all market, and it's sentiment. By analyzing more than one ticker at a time, relationships can often be observed between tickers as time progresses.
While seeing multiple charts on top of each other sounds like a good idea...each ticker has its own price scale, with some being only cents while others are thousands of dollars.
Directly overlaying these charts is not possible without modification to their sources.
By using a fixed point in time (Period Open) and percentage performance relative to that point for each ticker, we are able to directly overlay symbols regardless of their price scale differences.
The entire process used to make this indicator can be summed up into 2 keywords, "Scaling & Anchoring".
> Scaling
First, we start by determining a frame of reference for our analysis. The indicator uses timeframe inputs to determine sessions which are used, by default this is set to 1 day.
With this in place, we then determine our point of reference for scaling. While this could be any point in time, the most sensible for our application is the daily (or session) open.
Each symbol shares time, therefore, we can take a price point from a specified time (Opening Price) and use it to sync our analysis over each period.
Over the day, we track the percentage performance of each ticker's OHLC values relative to its daily open (% change from open).
Since each ticker's data is now tracked based on its opening price, all data is now using the same scale.
The scale is simply "% change from open".
> Anchoring
Now that we have our scaled data, we need to put it onto the chart.
Since each point of data is relative to it's daily open (anchor point), relatively speaking, all daily opens are now equal to each other.
By adding the scaled ticker data to the main chart's daily open, each of our resulting series will be properly scaled to the main chart's data based on percentages.
Congratulations, We have now accurately scaled multiple tickers onto one chart.
> Display
The indicator shows each requested ticker as different colored candlesticks plotted on top of the main chart.
Each ticker has an associated label in front of the current bar, each component of this label can be toggled on or off to allow only the desired information to be displayed.
To retain relevance, at the start of each session, a "Session Break" line is drawn, as well as the opening price for the session. These can also be toggled.
Note: The opening price is the opening price for ALL tickers, when a ticker crosses the open on the main chart, it is crossing its own opening price as well.
> Examples
In the chart below, we can see NYSE:MCD NASDAQ:WEN and NASDAQ:JACK overlaid on a NASDAQ:SBUX chart.
From this, we can see NASDAQ:JACK was the top gainer on the day. While this was the case, it also fell roughly 4% from its peak near lunchtime. Unlike the top gainer, we can see the other 3 tickers ended their day near their daily high.
In the explanations above, the daily timeframe is used since it is the default; however, the analysis is not constrained to only days. The anchoring period can be set to any timeframe period.
In the chart below, you can observe the Daily, Weekly, and Monthly anchored charts side-by-side.
This can be used on all tickers, timeframes, and markets. While a typical application may be comparing relevant assets... the script is not limited.
Below we have a chart tracking COMEX:GCV2026 , FX:EURUSD , and COINBASE:DOGEUSD on the AMEX:SPY chart.
While these tickers are not typically compared side-by-side, here it is simply a display of the capabilities of the script.
Enjoy!
Scaling

Robust Scaled Dema | OquantOverview
The Robust Scaled DEMA indicator is a tool designed for traders seeking to identify potential trend directions in financial markets. It combines the smoothing capabilities of a Double Exponential Moving Average (DEMA) with a robust scaling mechanism to normalize the data, making it more resilient to outliers and extreme price movements. This scaling helps in generating long and short signals based on predefined thresholds, visualized through color-coded plots and bars. The indicator aims to provide a balanced view of market momentum, reducing the impact of noise while highlighting significant shifts in price behavior.
Key Factors/Components
DEMA (Double Exponential Moving Average): Serves as the core smoothing component, reducing lag compared to simple averages by emphasizing recent price action more effectively.
Robust Scaling Mechanism: Utilizes statistical measures like median and interquartile range to normalize the DEMA values, ensuring the indicator is less sensitive to extreme values or price spikes.
Thresholds: User-defined upper and lower levels that trigger long or short signals when the scaled DEMA crosses them.
Visual Elements: Includes plotted lines for the scaled DEMA and thresholds, plus color-coded candlestick bars for intuitive interpretation.
Alerts: Built-in conditions for notifying users of potential entry points for long or short positions.
How It Works
The indicator starts by applying a DEMA to the chosen price source to create a smoothed representation of the market's direction. This smoothed value is then scaled using a robust statistical approach that accounts for the distribution of recent DEMA values, centering it around a median and adjusting for variability to minimize the influence of outliers. The resulting scaled metric is compared against user-set upper and lower thresholds: crossing above the upper suggests a bullish momentum (long signal), while dipping below the lower indicates bearish conditions (short signal). A state variable tracks these conditions to color the chart accordingly, helping traders visualize regime changes. Optional alerts fire on transitions.
For Who Is Best/Recommended Use Cases
This indicator is ideal for traders who employ trend-following or momentum-based strategies and need tools that perform well in non-normal market conditions, such as during high volatility or in assets prone to spikes. Use cases include identifying entry/exit points in trending environments, confirming breakouts, or integrating into multi-indicator systems for added confirmation. Quantitative traders or those backtesting strategies will appreciate its customizable parameters for optimization.
Settings and Default Settings
Source: The price data input for calculations, such as close, open, high, or low. Default: close.
DEMA Length: Controls the period for the DEMA smoothing; shorter values increase responsiveness but may add noise, longer ones provide more lag but smoother signals. Default: 25.
Robust Scaling Length: Defines the lookback period for the scaling statistics; affects how adaptive the normalization is to recent data distributions. Default: 40.
Upper Threshold: The level above which a long signal is triggered; higher values make signals rarer but potentially more reliable. Default: 0.5.
Lower Threshold: The level below which a short signal is triggered; lower values allow for more aggressive bearish detection. Default: 0.
Conclusion
The Robust Scaled DEMA offers an outlier-resistant alternative to traditional moving average indicators, empowering traders to navigate volatile markets. By blending exponential smoothing with statistical robustness, it provides actionable insights into trend shifts while minimizing false positives from extreme events..
⚠️ Disclaimer: This indicator is intended for educational and informational purposes only. Trading/investing involves risk, and past performance does not guarantee future results. Always test and evaluate indicators/strategies before applying them in live markets. Use at your own risk.

rate_of_changeLibrary "rate_of_change"
// @description: Applies ROC algorithm to any pair of values.
// This library function is used to scale change of value (price, volume) to a percentage value, just as the ROC indicator would do. It is good practice to scale arbitrary ranges to set boundaries when you try to train statistical model.
rateOfChange(value, base, hardlimit)
This function is a helper to scale a value change to its percentage value.
Parameters:
value (float)
base (float)
hardlimit (int)
Returns: per: A float comprised between 0 and 100

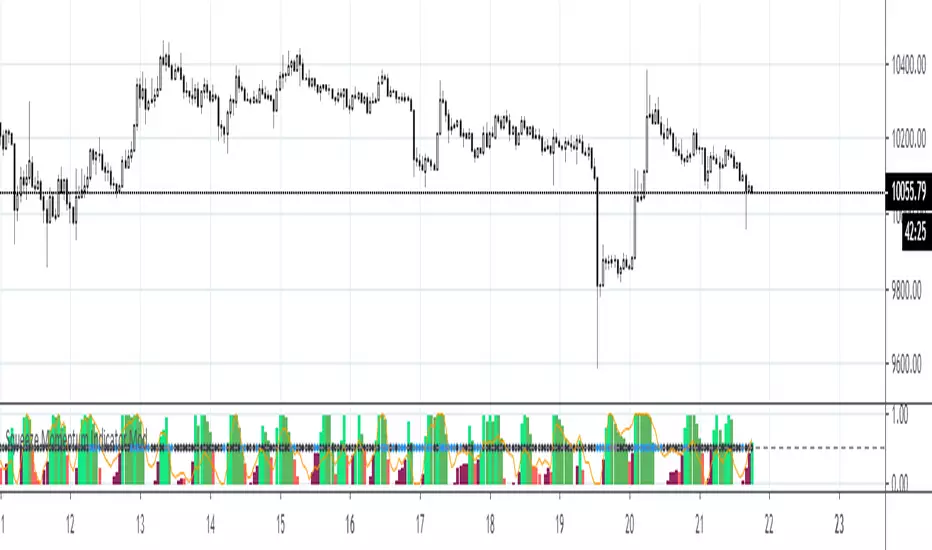
Trig-Log Scaled Momentum OscillatorTaylor Series Approximations for Trigonometry:
1. The indicator starts by calculating sine and cosine values of the close price using Taylor Series approximations. These approximations use polynomial terms to estimate the values of these trigonometric functions.
Mathematical Component Formation:
2. The calculated sine and cosine values are then multiplied together. This gives us the primary mathematical component, termed as the 'trigComponent'.
Smoothing Process:
3. To ensure that our indicator is less susceptible to market noise and more reactive to genuine price movements, this 'trigComponent' undergoes a smoothing process using a simple moving average (SMA). The length of this SMA is defined by the user.
Logarithmic Transformation:
4. With our smoothed value, we apply a natural logarithm approximation. Again, this approximation is based on the Taylor expansion. This step ensures that all resultant values are positive and offers a different scale to interpret the smoothed component.
Dynamic Scaling:
5. To make our indicator more readable and comparable over different periods, the logarithmically transformed values are scaled between a range. This range is determined by the highest and lowest values of the transformed component over the user-defined 'lookback' period.
ROC (Rate of Change) Direction:
6. The direction of change in our scaled value is determined. This offers a quick insight into whether our mathematical component is increasing or decreasing compared to the previous value.
Visualization:
7. Finally, the indicator plots the dynamically scaled and smoothed mathematical component on the chart. The color of the plotted line depends on its direction (increasing or decreasing) and its boundary values.

Feature ScalingLibrary "Feature_Scaling"
FS: This library helps you scale your data to certain ranges or standarize, normalize, unit scale or min-max scale your data in your prefered way. Mostly used for normalization purposes.
minmaxscale(source, min, max, length)
minmaxscale: Min-max normalization scales your data to set minimum and maximum range
Parameters:
source
min
max
length
Returns: res: Data scaled to the set minimum and maximum range
meanscale(source, length)
meanscale: Mean normalization of your data
Parameters:
source
length
Returns: res: Mean normalization result of the source
standarize(source, length, biased)
standarize: Standarization of your data
Parameters:
source
length
biased
Returns: res: Standarized data
unitlength(source, length)
unitlength: Scales your data into overall unit length
Parameters:
source
length
Returns: res: Your data scaled to the unit length
Feature scalerFeature scaler | Pine Utilities series, ready to be used in "study-on-study" fashion |
Includes min-max, normalization, standardization and unit length scaling.
One and only source: en.wikipedia.org
Endpoint inputs allow to set an interval of interest for min-max scaler.
Can be (and should be) applied to other studies, or to the chart itself. In this example, I applied min-max scaling to weighted linear regression's slope values.
Unfortunately, "All data" is still "experimental" and works only on charts where less than 5000 bars are available. max_bars_back() didn't help.
Sup TV

Squeeze Momentum Indicator ModThis is a scaled version of LazyBear's Squeeze Momentum Indicator. Also added are fibo-based periods for BB and KC.
Forecast Oscillator (ps4)This is a scaled version of a Forecast Oscillator, which may be used as a standalone indicator or as a filter. Scaling allows to reduce data to a standard interval, say, 0..1 or -1..1. Oftentimes, it also makes data more contrastive.

Logistic Difference (ps4)This is an PS4 update to the Logistic Difference Indicator. It uses logistic function (sigmoid), which stabilizes the variance of data. The logistic function resembles the inverse Fisher transform. This version has a repaint/non-repaint switch and a scaling feature.
