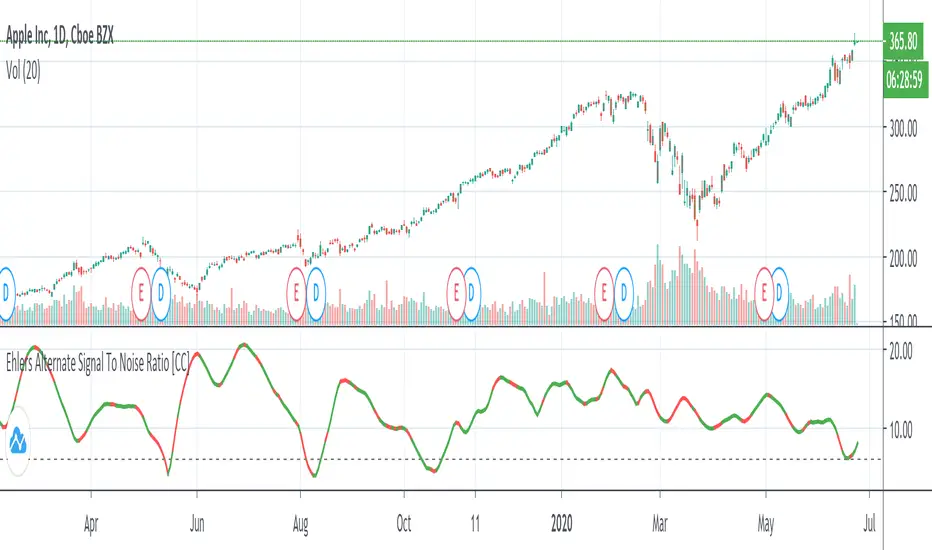
Ehlers Alternate Signal To Noise Ratio [CC]The Alternate Signal To Noise Ratio was created by John Ehlers (Rocket Science For Traders pgs 84-85) and this is a variation of his signal to noise ratio that some scalpers might find more useful than his default signal to noise ratio. You would want to buy and sell when the indicator is above the dotted line because that means the stock is volatile enough to maximize any movement of the trade in either direction. Buy when the indicator line is green and sell when it is red.
Let me know if there are other indicators you would like to see me publish or if you want something custom done!
Scalping
Bitcoin1% : High Leverage Indicator______________________________________________________________________________________________________________________
NOTE: Bitcoin1% is designed to work EXCLUSIVELY on BYBIT BTCUSD PERPETUAL CONTRACT chart on 1min TimeFrame on regular Candles
______________________________________________________________________________________________________________________
Bitcoin1% is a specialised indicator suite designed to catch 1% Bitcoin moves in either direction for High Leverage Trading.
Example: At 10x leverage catching 1% Bitcoin move will yield 10% profit
__________________________________________________________
Mechanism Of Action:
1. Identify trend: The script observers multiple parameters on higher timeframes to identify general trend & strength.
2. Take position: Once the trend is identified the script intends to take high probability positions for a 1% move in the direction of the trend. Currently there are 21 conditions that use bespoke datasets, along with conventional datasets like RSI , MA, VWAP to filter & identify high probability entries.
3. Take profits: There are total 4 conditions for exits. Partial Exit & Total Exit for both Longs & Shorts. Although we recommend you book profit at 1% change in price of BTCUSD these 4 conditions will offer high volatility exits along the way, should you choose to hold for longer.
4. Evolving: We learn from mistakes when they happen, bad trades are dissected & studied. New conditions get added & bad trades get filtered out through updates. This keeps the script in sync with the market.
__________________________________________________________
Insight: The script performs best in trending markets, so it avoids trading structureless or sideways movement & expects reasonable judgement on the user's part to avoid trading unusual & directionless market conditions.
Trading Mindset: When Bitcoin1% indicates a long trade, it basically says "BTC is more likely to move up 1% than go down 1% form here" : The script only indicates direction of the next 1% which is all you need for High Leverage Trading. You can set target & stop at 1% & try different variations with experience.
Have Questions? Feel free to PM me on TradingView

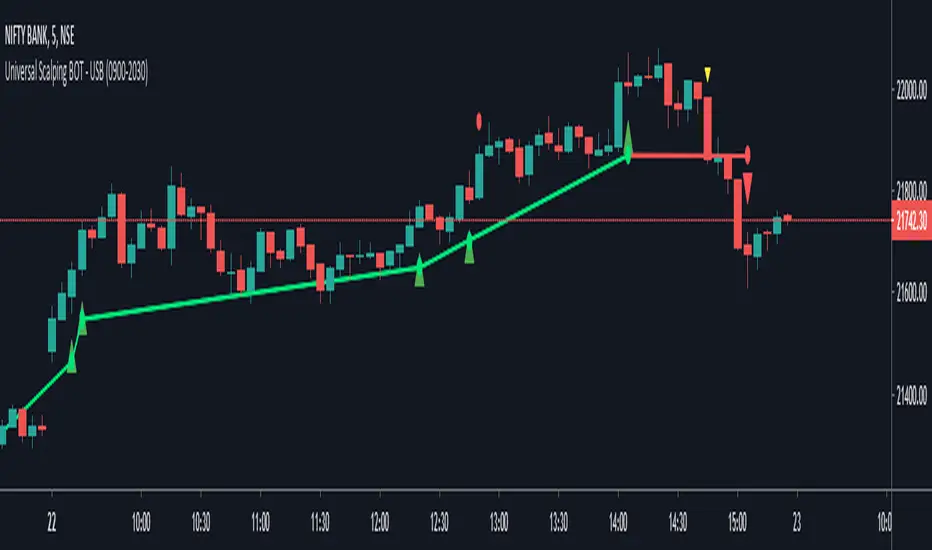
Universal Scalping BOT (USB) - With AlertsThis Study Is based on
• RSI
• Moving Average
• Candlestick price action and
• Bulls Bears calculation.
This Study is Also has alerts inbuilt.
Alerts are for:
• Buy Active
• Buy Profit Achieved
• Buy Loss Hit
• Sell Active
• Sell Profit Achieved
• Sell Loss Hit
How to trade ?
• When Green big Up triangle Comes, Buy that time and book profit at red small circle and book loss at yellow down small triangle.
• When Red big Down triangle Comes, Sell that time and book profit at green small circle and book loss at yellow up small triangle.
► Options Available In Setting:
To Show / Hide :
• Target Line
• Stop-Loss Line
• Define Trading Sessions
► Trailing SL is calculated on candle stick price action and not on Average True Range.
Test Yourself and give feedback.
PM us to obtain access.
1 Minute Scalper
How to use:
Green background: Long
With green background wait for white bars to appear, once white bars appear wait for green bars and enter long on break of high or close of green bar. The stop out of trade should be a candle that closes below the pivot: it should be apparent. (Can enter long after white bars if it has a long tail Stop below the tail).
Red background: Short
With red background wait for black bars to appear, once black bars appear wait for red bars and enter short on break of low or close of red bar. The stop out of trade should be a candle that closes above the pivot. (Can enter short after black bars if it has a long tail).
best of luck

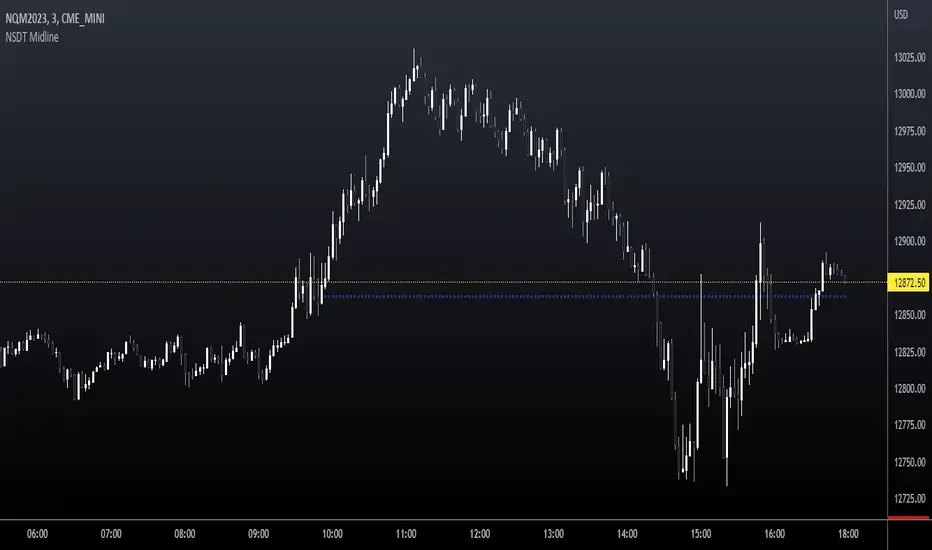
NSDT MidlineSimple script to plot the Midpoint between the High and Low of day for intraday trading. This is a key level that is respected quite often. Very easy to trade bounces or breakthroughs.
Intraday BUY/SELLBUY & SELL Scalp Signals for Crude Oil Future Contracts (Or it can be used with any scrip with good amount of Volume) based on Sma & RSI overbought/oversold alert (!) for possible reversal indication.
Take Buy position only if candle breaks the high of alert candle & for Sell positions, take position if candle breaks low of the alert candle.
Best to perform with 3 min timeframe on Crude Oil Futures

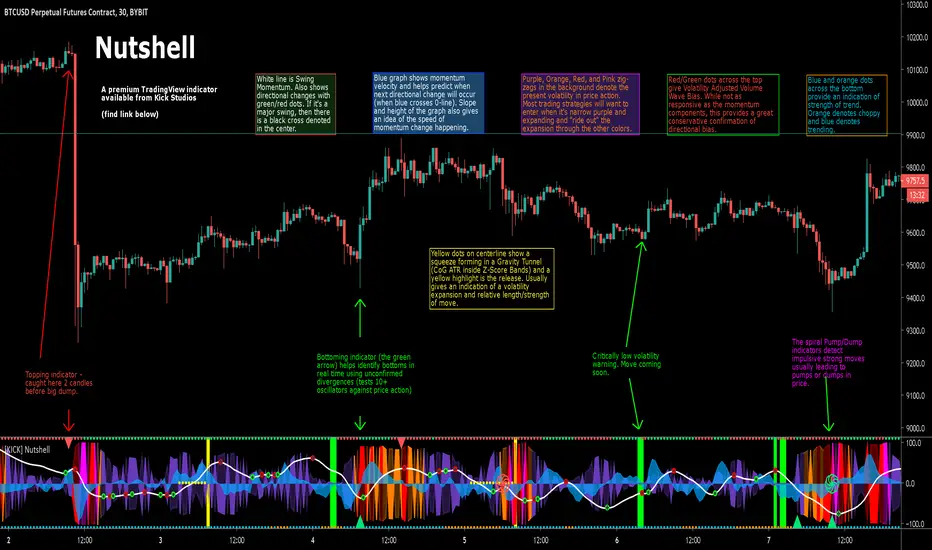
[KICK] NutshellThe Nutshell indicator gives you a true read of the market at quick glance – “in a nutshell”. The indicator contains components for volatility, momentum, trend strength, volume flow, price divergence detection, and impulsive move detection. This allows you to discern improved entry and exit points and accommodates many trading styles, systems, and strategies. It will work with most instruments and timeframes (though a few of the components do require volume, so some things like indexes won't work). The specific components of the indicator are:
Price action volatility indicator (the background zig-zags that are purple, orange, red, and pink). We are using a percentile ranking of ATR which gives a broader picture of the price volatility intra-bar than something like historical volatility percentile because it encompasses the range of price action and not simply the close of each bar. It is typically best to enter trades in the purple zone and “ride them out” through the higher volatility intervals.
Low volatility warning indicator (the bright green background highlights). When the ATR-PR is critically low, that means price volatility can only go on way (expand). These warnings are key to volatility strategies where knowing large moves are imminent is critical. While these warnings do not indicate the direction of the imminent move, there are plenty of other directional indicators present.
Gravity Tunnel Squeeze indicator (the yellow dots down the center-line, culminating in a yellow background highlight upon release). This is a slightly different take on the Momentum Squeeze indicator. In the traditional implementation a squeeze occurs when Keltner Channels move inside Bollinger Bands. In our implementation we use the Center of Gravity as a basis and measure when the Z-Score Deviation moves inside an ATR multiple. At the point of release you typically see an expansion of volatility, though often the signal presents earlier than an ATR-PR expansion. The longer the price action was under the squeeze the longer/farther the released price action is likely to go.
Swing Momentum indicator (white line with various red/green dots on it). The swing momentum indicator uses stochastic oscillators in the style of the ever-popular “Wave Trend” indicator to give a responsive read on the price action momentum. Green and Red dots indicate a change in direction of the momentum and when these occur in the extreme the center of the dot will be a black cross. Usually these extreme direction changes denote larger trend changes.
Momentum velocity indicator (blue area fill). This indicator can be used with the swing momentum line to determine how close/far the next direction change is away (every time the blue line crosses the zero-line a direction change occurs). The steeper the slope of this line also gives an indication of how fast the swing momentum is accelerating or decelerating.
Volatility Adjusted Volume Waves (the red/green dots across the top of the indicator) denote the current direction of price action based on cumulative volume weighted based on the ATR of the associated price action. While they are slower to respond than some of the other directional momentum components of this indicator, they can be treated as a pretty strong (conservative) confirmation of trend direction.
Strength of Trend (the blue/orange dots across the bottom of the indicator) is indicated with a Leaf-West variant of the ADX. Basically, if you see orange the price action is considered choppy and if it’s blue it’s trending. Depending on your time frame you can interpret these a bit differently. On smaller time frames you might consider the orange areas no-trade zones and wait until it turns blue.
Topping or Bottoming moves (Red triangles at the top or Green triangles at the bottom). We use a series of methods to detect likely reversal points (including checks for 10+ oscillator/price divergences). Since divergence is only confirmed after new local price highs/lows are established these reversal points won’t always be accurate, but we want to provide the earliest warning possible. Keep this in mind when taking action on them and wait a few bars for confirmation to be more conservative.
Pump and Dump warnings (red/green spirals that appear in the center of the indicator). Using 3rd generation moving average stochastics we get a very sensitive read on when they form patterns that typically precede large price action movements. These patterns work better for some markets than others so you will have to test with your instrument and timeframe to see how accurate they are for you. If you get one of these in conjunction with a red/green triangle and/or just after a low volatility or GT-Sqz release highlight, then buckle up.
The indicator also includes a number of custom alert conditions (all related to the above indicator components) that can be used to create alerts.
Use the link below to watch a tutorial video, request a trial, or purchase for access.
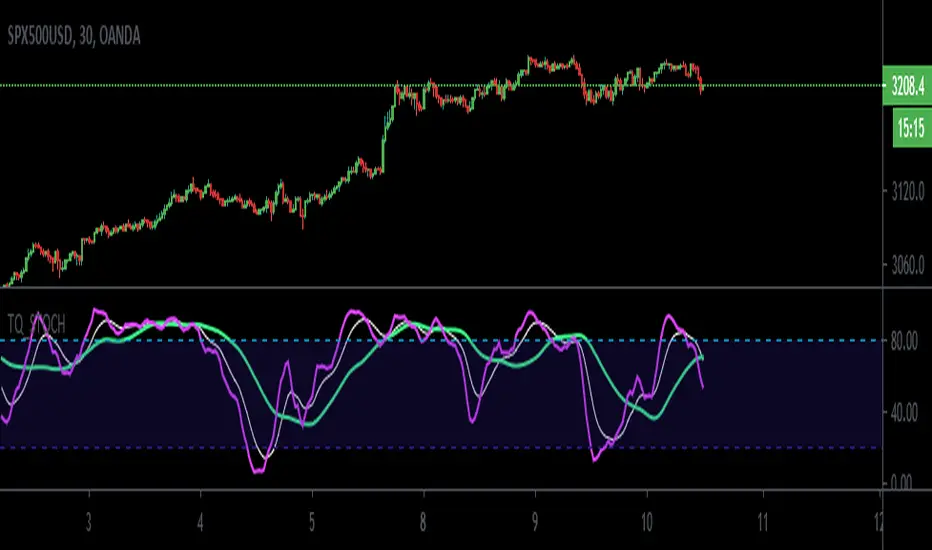
TQ_STOCHThis is a modified stochastic oscillator. It works very well with Forex pairs, traditional markets and has also proved itself profitable with BTC. The aim of this indicator is to help you predict a change in direction of the market.
When lower periods are above higher periods you are looking to buy of support and when lower periods are below higher periods you are looking to sell of resistance.
Lowest period: pink
Medium period: white
Longest period: turquoise
PERFECT LONG: pink line above the white and white above the turquoise. Turquoise should serve as support for the white line and white line should serve as support for the pink line. BUY when pink line tests the white line and bounces off.
PERFECT SHORT: pink line below the white and white below the turquoise. Turquoise should serve as resistance for the white line and white line should serve as resistance for the pink line. SELL when pink line tests the white line and bounces down.
You can also play less perfect signals where pink or white tests blue as support or where white is not above the blue line yet but you still get a test of the white from the pink. These are slightly more risky.
- SOME SIGNAL EXAMPLES:
Enjoy :)
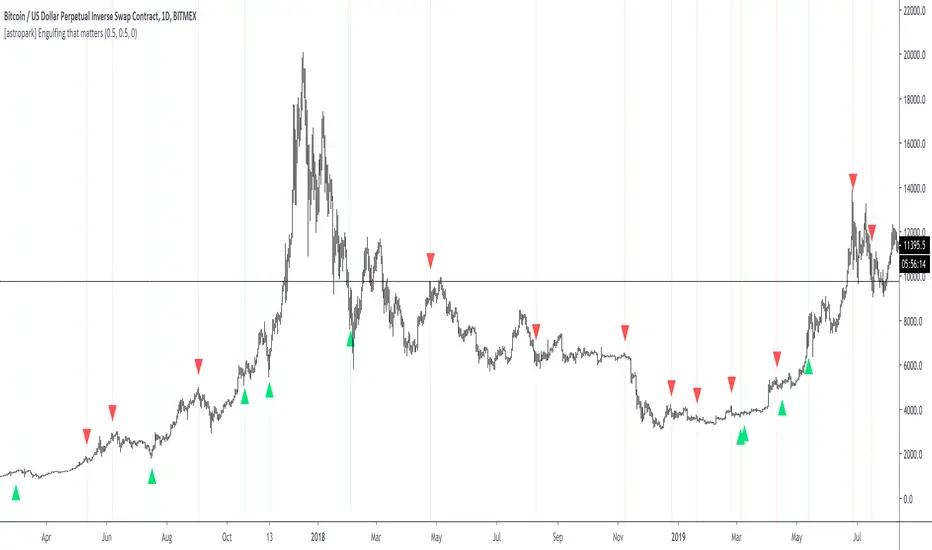
[astropark] Engulfing that mattersDear Followers,
today a new Price Action Tool , the "Engulfing that matters" .
Everybody knows the importance of engulfing to find
supply and demand zones
market makers' actions
trend switching in short-term and mid-term future
They can be both bullish or bearish , but the real problem is that not all, but only a few engulfing matters ! And this tool will filter them for you.
This indicator works
on every timeframe (eg. 5m, 15m, 30m, 1h, 2h, 4h, 6h, 1D, ...)
on cryptocurrencies (eg. XBTUSD, ETHUSD, ETHBTC, both USDT and BTC markets, ...)
on forex (eg. EURUSD, GPBUSD, JPYUSD, ...)
on stocks (eg. AMZN, FB, TSLA, GOOG, NFLX, ...)
on commodities (eg. GOLD, SILVER, OIL, ...)
This indicator has following options:
edit filter based on fixed or percentage volatility change
edit filter based on candle value size
show a suggestion of possible entries and stoploss
You can enhance your trading by using it together with my Breaker Blocks (BB) and Supply/Demand Order Blocks (OB) indicator, so you can easily spot important points where to start a short or a long trade.
Here my Breaker Blocks (BB) and Supply/Demand Order Blocks (OB) indicator
Here below some examples on how to use the indicator.
BTCUSDT 1D
ETHUSDT 1h
BNBBTC 4h
EURUSD 30m
GBPUSD 5m
TSLA 1D
FB 4h
XAUUSD 4h
XAGUSD 15m
Brent Oil 1D
Here below an example of suggested entries on stoploss
MA Pull [VK] - alert version of vkscalperThis is the alert version of vkscalper
you will need to change the settings for different TF also try changing MA types
Ability to choose MA types
Ability to plot stop loss / take profit lines
simply select buy alert or sell alert for alerts

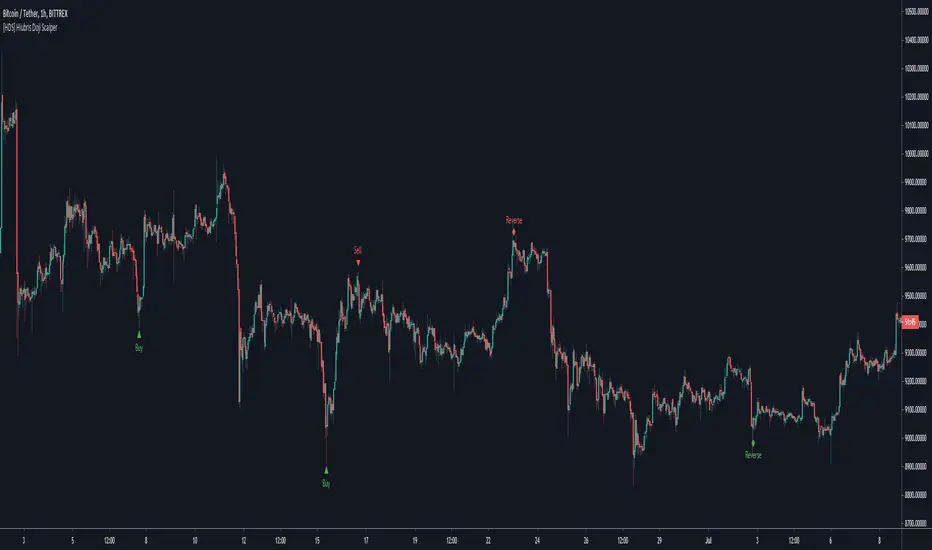
[HDS] Hiubris Doji ScalperThis is a simple Scalping Strategy based on custom Candle Patterns
The script mainly identifies reversal patterns and signals them on the chart.
All chart signals can be setup as live alerts !
It works well on literarly any Pair/Timeframe
[astropark] VWAP Crosses [alarms]Dear Followers,
today a new Swing and Scalping Strategy based on WVAP , mainly designed for Bitcoin and High-Cap Cryptocurrencies, like Ethereum. It works also on Forex and Stocks.
It works great since 15m and above till 1D. I suggest you to use it on 15m, 30m or 1h timeframes .
VWAP or "Volume Weighted Average Price" is a volume-based indicator similar to a moving average.
This trading indicator is used to identify market resistance and support levels and is represented as a weighted average price for the treaded volumes.
My strategy will help you identify main support-resistance level to be careful of and it will trigger a buy or a sell depending on how price will intereact with vwaps.
green means we are in a bullish trend, in fact it start with a "buy" signal
red means we are in a bearish trend, in fact it start with a "sell" signal
blue means we are in a moment where trend may change, so be careful and always remember that taking profits is awesome and have a stoploss is a must in trading
The user who wants to use this strategy, especially via an automated bot, must always set a stoploss (example 150$ from entry on bitcoin) or use a proper risk management strategy .
This is not the "Holy Grail", so use it with caution. It's highly suggested to use a proper money management .
This script will let you set all notifications you may need in order to be alerted on each triggered signals.
The one for backtesting purpose can be found here below:
This is a premium indicator , so send me a private message in order to get access to this script.

Market Sniper - Trading/Scalping SuiteWelcome to Market Sniper.
Market sniper is meant to be a suite for trading/scalping alongside my indicators script, RSI, Stochastic and Horizontals.
It is based on over 15 Indicators/Oscillators so there is no need for convoluted charts and constantly changing charts/indicators for a better understanding of the market.
Warnings:
I can't stress this enough! This isn't a magic pill that will transform your illiterate grandmother into an expert trader! This is a very powerful tool whose function is to complement your trading/save time (and yes, with practice be your main trading tool).
This algorithm requires setting up and training to be used correctly, please do not expect to load it up and immediately be scalping the 1s charts.
This algorithm is heavy and might require constant refreshes of the browser on slower computers.
Labels overlap at the moment, working on this part at the moment. So, always zoom in before doing a trade / change the "+- signals in settings"
Candlestick patterns need tweaking, I personally have it off and use my own judgement atm.
What it includes:
Trend reversal / continuation (Macd, Stochastics, money flow , CCI , momentum, DIOSC (automatic trendlines ), SuperTrend, Moving averages, etc, etc.)
RSI divergence drive / drive counter (base code from Libertus, check his profile as he has very helpful scripts)
Bull Market expansions for longterm take profit and increasing position
Candlestick patterns
Trend reversal / Continuation
Green = Bullish reversal
Red = Bearish trend reversal
Orange = Trend continuation / strengthening
Trend Continuation/Strengthening
A warning here, trend strengthening also means that many times the indicators are overextended or close to it
------
The numbers reflect the amount of indicators that are signaling a reversal over the specified period on the settings.
For higher timeframes this setting should be on a lower value and the opposite for lower timeframes.
This works on every market and every timeframe(according to months of my own paper and real trading). Remember that each market/asset/commodity has different soft spots so tweaking, backtesting and present accuracy review should be of maximum priority.
Bull Market expansion phase
Warning:
The indicator purposely does not show any signals during bear markets. It is my opinion bear markets complexity render this tool close to useless.
It was designed to be used in higher timeframes, tough it SEEMS to have a good track record / be useful in lower timeframes.
it will ALWAYS give a fake signal at the end of a bull market because of the very nature of the code.
It is based of EMAs, RSI and Stochastic
Candlestick Patterns
Bullish candlestick patterns:
Hammer
Inverted Hammer
Dragonfly
Gravestone
Bearish candlestick pattern:
Shooting Star
Hanging Man
Gravestone
Dragonfly
RSI divergence drive
- Credit to Libertus for the base code of this section
The green triangle means there are at least 2 drives of valid divergence, yellow for 3 and red for 4+.
The script shows triangles when confirmation candle closes.
You need to know how divergence works to use this section. investopedia can easily get you there.
For cryptos I use 2-4h+ timeframes, for traditional markets I use 15min+ for forex I use it basically in every timeframe.
For questions/suggestions and access PM me in the platform itself and don't forget -> FEEDBACK IS IMPORTANT
Thank you all

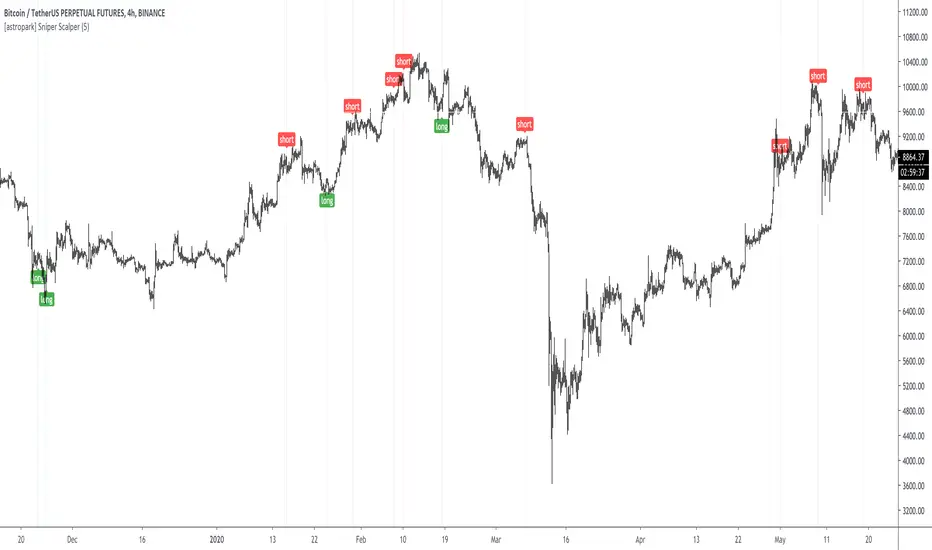
[astropark] Sniper ScalperDear Followers,
today a new Scalper Tool , which works great on all timeframes , from 1 minute to 1 month!
Keep in mind that this is a Scalper, so it's always a good idea to take or lock your profits, despite you may use it also for swing trading.
This tool has some cool features:
it works on all timeframes , from 1 minute to 1 month!
you can change a filter option from 1 (lowest) to 7 (highest)
Here some examples on how it performs on many timeframes and charts.
EURUSD 15m chart
AMZN 1h chart
Bitmex XBTUSD 4h chart
Bitfinex ETHUSD 1h chart
Binance Chainlink LINKBTC 1h chart
Binance Ethereum ETHBTC 1h chart
GOLD XAUUSD 15m chart
The user who wants to use this strategy, especially via an automated bot, must always manage to set a take profit and stoploss, as well as use a proper money and risk management strategies .
This is not the "Holy Grail", so use it with caution.
This is a premium indicator , so send me a private message in order to get access to this script.
ADD for SPX intraday (NYSE Adv-Decl) -Tom1traderThis is the NYSE Advancers - decliners which the SPX pretty much follows. You can chart it like any index (ADD -NYSE $ADV MINUS $DECL) but I find it more useful in a separate panel with colors for direction.
The level gives an idea of days move (example: plus or minus 500 is not much movement through the session) but I follow the direction as when more stocks advance (green) or decline (red) the index tends to track it pretty closely.
On SPX, SPY and correlateds - very useful for intra-day trading (Scalping or 0DTE option trades) but not for higher time frames at all. If you chart the ADD in a chart and compare 5 minute to daily you will see what I mean.
I left it at 5 minutes timeframe which displays well on any intraday chart. You can change it by changing the "5" in the security function on line 13 to what you want ("1" 1 minute, "15" 15 minutes) or change it to timeframe.period (no quotes) so that it will follow the timeframe of the current chart. I like 5 min as it displays better on higher timeframes i.e. 15 min. or hour.
A simple moving average with a length of 10 is added to help gauge momemtum.
Hope this helps with trading or scripting ideas, questions or feed back welcome. Keep Smiling.

{INDYAN} RSI + MACDModded RSI and MACD for intraday use. If rsi above 60 and macd is above zero line then go for buy and if rsi is below 40 and macd below zero line then go for sell side. use it in small timeframe i.e. 3 minute or less.
better for scalp trading
Happy Trading
Love INDYAN
#It can be used best with INDYAN Go With Trend

cATRpillerThis indicator is used to identify range breakouts using an ATR multiplier. My first script, Im sure there are indies out there like this, but this my favorite way to identify breakouts and trends.

MoneyFlow SCALP
this indicator to trade for a short time in a TF of 1-5-15 minutes.
We have created takeprofit zones for you so that you can understand where we can get to and take your profit. these points are mostly very helpful.
There are basic settings that allow you to adjust the indicator individually for each situation; because of this, this indicator can be used for any exchange and any currency pair.
For Scalp trading, we use 4 different strategies available to our clients. If you enter them correctly, you can never see the minus sign.
Use the link below to obtain access to this indicator.


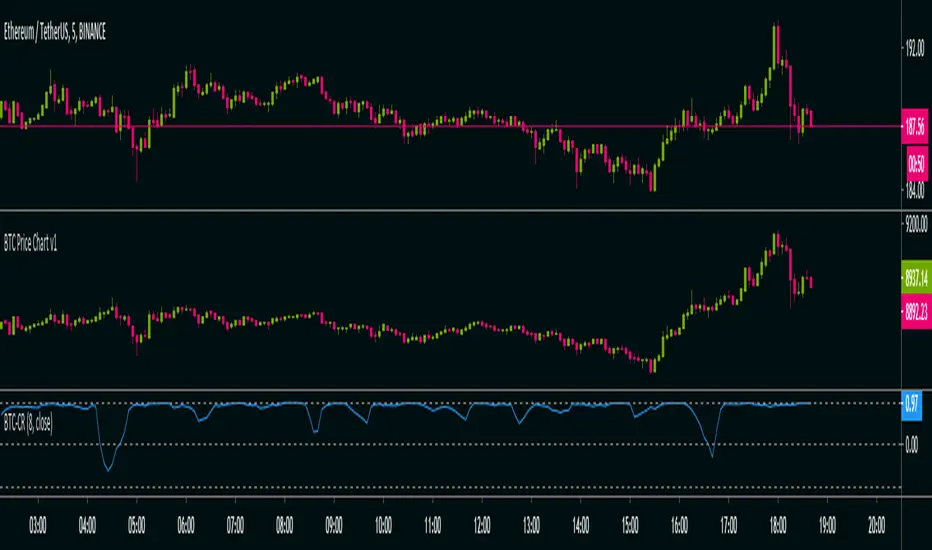
BTC Co-Relation v1Calculate Pearson-correlation-coefficient of selected cryptocurrency with Bitcoin average price of 10 different exchanges.
This is helpful in scalping(at least for me), by using this we can find co-relation between a cryptocurrency and Bitcoin .
Here we are using Bitcoin average price of 10 different exchanges.
It is an oscillator with minimum value -1 and maximum value +1.
👉-1 means current selected cryptocurrency price is completely out of relation with Bitcoin price, means Bitcoin price increasing and it's price decreasing or Bitcoin price decreasing and it's price increasing in selected time-frame.
👉+1 means current selected cryptocurrency price is completely in co-relation with Bitcoin price, means Bitcoin price increasing and it's price also increasing or Bitcoin price decreasing and it's price also decreasing in selected time-frame.
Happy trading 👍.
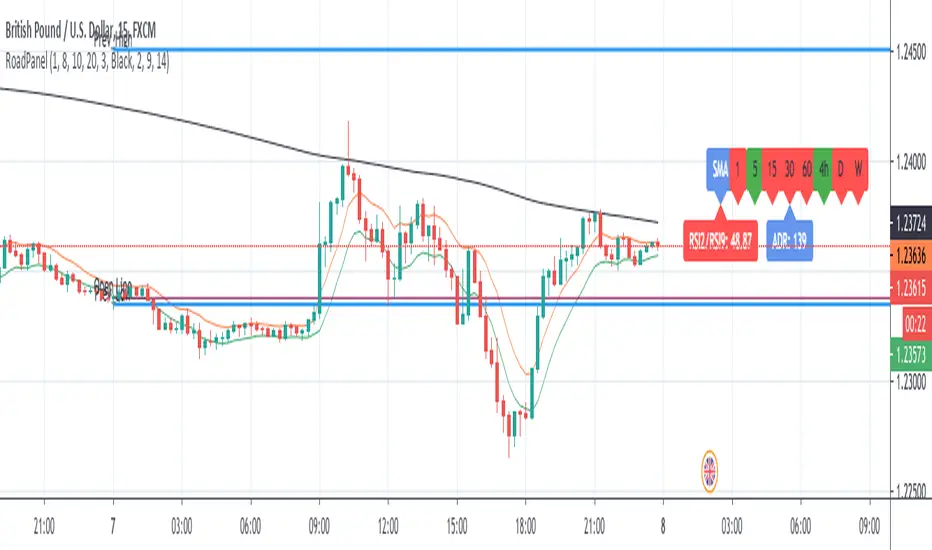
RoadMap PanelThis study is usefull for who follows the rules of "Laura's RoadMap" trading strategy.
If someone doesn't know what I'm talking about, google it because I cannot post link here.
It could be used for scaliping too.
Basically, the rules are:
- Open only in direction of Multitimeframe SMA200
- EMA high/low channel shall be above(buy) or below (Sell) SMA200
- RSI2/RSI9 shall be above(buy) or below (sell) 50
- Look at ADR, last day high/low, daily open for possible supports/resistance.
Next improvement (only to whom is interested to this script and follows me): ADR, last day high/low, daily open to be added to this study.
Next improvement (only to whom is interested to this script and follows me): Alerts to be added.
Please use comment section for any feedback.
********************************** IMPORTANT********************************************************************
I have developed an expert advisor for metatrader4 (MT4) with good results in 2019-April 2020
*********************************************************************************************************************
This study is free to use but code is private. If you like or have question please use comment section.
Check also my other scripts at www.tradingview.com
Thanks for your feedbaks.
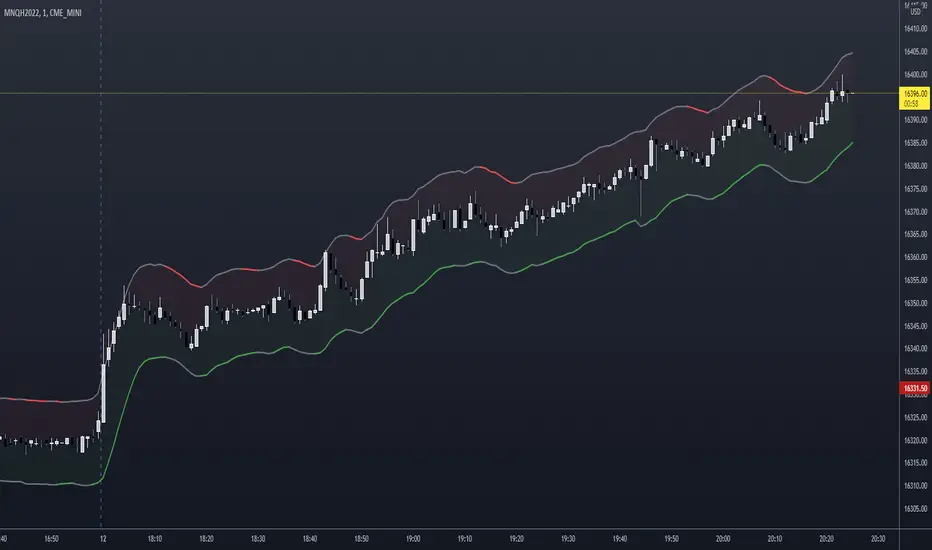
NSDT Scalping ChannelThis script uses the highs and lows of the candles (instead of the close) to make a "channel" to reference while scalping.
Use the green lower line as a guide to go long and the red upper line as a guide to go short. You may use the lines as potential entry points and direction but you may want to consider exiting before the opposite colored line prints, as that may be too late. As always, entries and exits are at the discretion of each trader.
You will need to adjust the "Line Spacing" settings as you change instruments, chart timeframes, and/or volatility increases/decreases.
eha MA CrossIn the study of time series, and specifically technical analysis of the stock market, a moving-average cross occurs when, the traces of plotting of two moving averages each based on different degrees of smoothing cross each other. Although it does not predict future direction but at least shows trends.
This indicator uses two moving averages, a slower moving average and a faster-moving average. The faster moving average is a short term moving average. A short term moving average is faster because it only considers prices over a short period of time and is thus more reactive to daily price changes.
On the other hand, a long term moving average is deemed slower as it encapsulates prices over a longer period and is more passive. However, it tends to smooth out price noises which are often reflected in short term moving averages.
There are a bunch of parameters that you can set on this indicator based on your needs.
Moving Averages Algorithm
You can choose between three types provided of Algorithms
Simple Moving Average
Exponential Moving Average
Weighted Moving Average
I will update this study with more educational materials in the near future so be informed by following the study and let me know what you think about it.
Please hit the like button if this study is useful for you.
