Strategy - Relative Volume GainersStrategy - Relative Volume Gainers
Overview:
This trading strategy, called "Relative Volume Gainers," is designed for Long Entry opportunities in the stock market. The strategy aims to identify potential trading candidates based on specific technical conditions, including volume, price movements, and indicator alignments.
Strategy Rules:
The strategy is focused solely on Long Entry positions.
The volume for the current trading day must be greater than or equal to the volume of the previous day.
The percentage change in price must be greater than or equal to 2.5%.
The Last Traded Price (LTP) must be greater than or equal to the Exponential Moving Average (EMA) 200.
The Relative Volume for the current trading day (calculated over the last 30 days) must be greater than or equal to the Simple Moving Average (SMA) of Relative Volume over the same 30 days.
The current candle on the chart should be Green or Bullish, indicating positive price movement.
The price difference between bid and ask prices should be kept to a minimum.
It's recommended to also analyze market depth for better insights.
Strategy Requirements:
Add the Exponential Moving Average (EMA) 200 to your trading chart.
This strategy can be applied on charts of any timeframe.
For intraday trading, particularly for early entry, consider using a 1-minute timeframe.
It is advisable to create a screener to identify potential trades in real-time market conditions.
Risk Warning:
Stocks that meet the strategy criteria might exhibit high volatility and a high beta, making them inherently risky to trade. Exercise caution and adhere to predetermined risk management strategies.
Determine your trading quantity based on your entry price and stop loss in order to manage risk effectively.
Quantity Calculation Formula:
Quantity calculation is crucial to manage risk and position sizing. The following formulas can be used based on your trading scenario:
Quantity with Leverage:
Quantity = (((Using Capital / 100) * Risk Percent) / (Entry Price - Stop Loss)) * Leverage
Eg: Quantity = (((10000 / 100) * 0.2) / (405.5 - 398.5)) * 5
Quantity = 14
Risk = Rs.100 (Rs.100 is 1% of Rs.10000. So the risk is 1%, means we lose only Rs.100 when the SL is hit. If SL is increased the Quantity will get reduced to maintain a fixed risk of Rs.100)
Quantity without Leverage:
Quantity = (((Using Capital / 100) * Risk Percent) / (Entry Price - Stop Loss))
Note:
Always stay informed about market conditions and be prepared for potential rapid price movements when trading stocks that meet the strategy criteria. Strictly adhere to your predefined risk management strategy to safeguard your capital.
Scanner

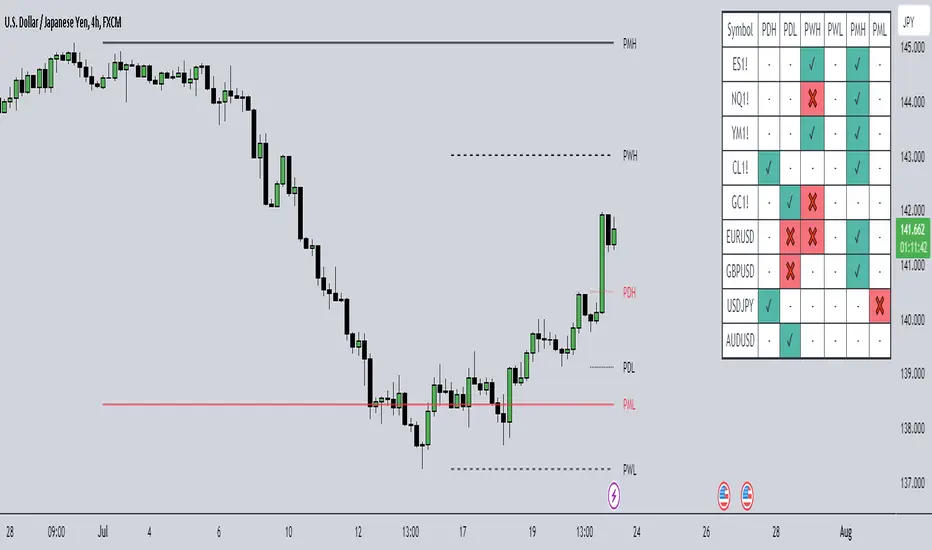
HTF Liquidity Dashboard [TFO]The purpose of this indicator is to server as a multi-symbol scanner that indicates when user-defined symbols have exceeded their previous Day/Week/Month highs and lows.
By default, the dashboard will use a compact view where the green ✔ means that price has swept and is currently exceeding the level of interest, the red ❌ implies that price swept the level but reversed back into the original range, and - indicates that the level hasn't been reached. However, the dashboard text can be toggled to show the numerical values of the highs and lows instead of these compact strings, as shown in the following image.
These levels may be shown and customized on the current chart as well via the Show Levels option. By default, levels from the selected timeframes will initially be plotted as black, and will change to red once traded through. Users can optionally increase the Session Limit parameter to show more than one previous high/low on their chart, for each selected timeframe.
Optionally, we can also plot labels to show when any of the user-defined symbols have exceeded their respective highs and lows, for any of the selected timeframes. Alerts can be created for these events as well; simply select the desired symbols and timeframes, create a new alert using this indicator, and you should be alerted when highs and lows are traded through. Note: if you encounter any issues with duplicate alerts, try deleting the alert, navigating to a lower timeframe such as the 1m, and making a new alert.
DTR/ATR Scanner v1.0This indicator allows you to view DTR vs. ATR % for multiple instruments. When colors are Red the instrument is near 90% of its daily ATR.

Nifty36ScannerThis code is written for traders to be able to automatically scan 36 stocks of their choice for MACD , EMA200 + SuperTrend and Half Trend . Traders can be on any chart, and if they keep this scanner/indicator on , it will start displaying stocks meeting scanning criteria on the same window without having to go to Screener section and running it again and again. It will save time for traders and give them real time signals.
Indicators for scanning stocks are:
MACD
EMA200
Supertrend
HalfTrend - originally developed by EVERGET
Combination of EMA200 crossover/under and MACD crossover/under has worked well for me for long time, so using this combination as one of the criteria to
Scan the stocks. Using Everget's Half Trend method confirms the signal given by MACD , EMA200 and Supertrend Crossover.
I have added 36 of my favourite stocks from Nifty 50 lot. Users of this script can use the same stocks or change it by going into the settings of this scanner.
The Code is divided into 3 Sections
Section 1: Accepting input from users as boolean so that they can scan on the basis of one of the criteria or any combination of the criteria.
Section 2: "Screener function" to calculate Buy/ Sell on the basis of scanning criteria selected y the user.
screener=>
= ta.supertrend(2.5,10)
Buy/Sell on the basis of Supertrend crossing Close of the candle
//using ta.macd function to calculate MACD and Signal
= ta.macd(close, 12, 26, 9)
using HalfTrend indicator to calculate Buy/Sell signals , removed all the plotting functions from the code of Half Trend
Bringing Stock Symbols in S series variables
s1=input.symbol('NSE:NIFTY1!', title='Symbol1', group="Nifty50List", inline='0')
Assigning Bull/Bear ( Buy/Sell) signals to each stocks selected
=request.security(s1, tf, screener())
Assign BUY to all the stocks showing Buy signals using
buy_label1:= c1?buy_label1+str.tostring(s1)+' ': buy_label1
Follow the same process for SELL Signals
Section 3: Plotting labels for the BUY/SELL result on the in terms of label for any stocks meeting the criteria with deletion of any previous signals to avoid clutter on the chart with so many signals generated in each candle
Display Buy siganaling stocks in teh form of label using Label.new function with parameters as follows:
barindex
close as series
color
textcolor
style as label_up,
yloc =price
textalign=left
Delete all the previous labels
label.delete(lab_buy )
STOCKS SELECTION
We have given range f 36 stocks from NIFTY 50 that can be selected at anytime,. User can chose their own 36 stocks using setting button.
INDICATORS SELECTION
1. MACD: It i sone of the most reliable trading strategy with 39.3% Success rate with 1.187 as profit factor for NIFTY Index on Daily time frame
2. EAM200 + Super trend : Combination of EMA200 crossover and Super trend removes any false positives and considered a very reliable way of scanning for Buy/Sell signals
3. HALF TREND: Originally developed as an indicator by Everget and modified as strategy by AlgoMojo, it generates Buy/Sell signals with 40.2% success rate with 1.469 as profit faction, on 15 minutes timeframe.

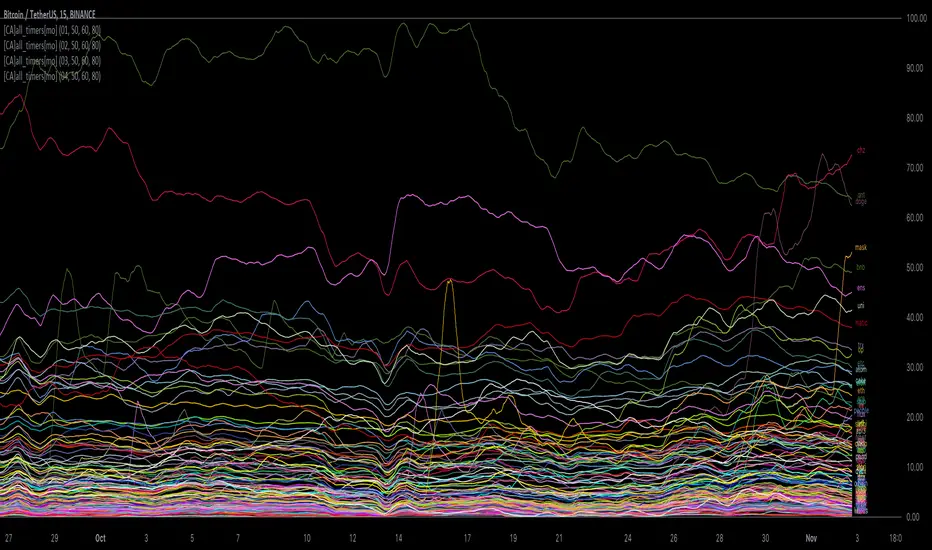
[ChasinAlts] All-Timers [MO]*** PLEASE NOTE: THIS SCRIPT WILL MAKE TV's SERVERS FLEX IT'S MUSCLES SO IT WILL SLOW DOWN OTHER PROCESSES WITHIN TV (HIDE THEM IF NECESSARY TO REGAIN THE SPEED/FUNCTION...OR DELETE THEM...WHAT DO I CARE???) ESP IF YOU HAVE 3-4 ITERATIONS AS I DO TO SHOW THE WHOLE KUCOIN MARGIN MARKET ***
G'day Tradeurs, Hope everyone is having a FAN-FRIGGIN-TASTIC DAY!!! Right now (November 2nd, 2022) is a GREAT time to look for coins that are near their ALL-Time Low
due to the incoming bull market rearing its head around the corner (I'd wait for ONE MORE big dump to be safe though). And how GREAT would it be to even have
$50 of a coin with 10X leverage (I wouldn't suggest this to others though) at the near bottom said market? That is the reason for me publishing this.
This is a quick little scanner script thats part of my "Market Overview" series. Nothing monumental or advanced regarding the ATH/ATL calculations.
Perhaps one thing slightly different here than others is both the % from ATH and % from ATL is calculated and the result is the % that the price is between it's ATH/ATL.
So, it will show the All Time High/All Time Low BUT ONLY to the extent that the TF will allow. Ie. For the Free Planned Users, they can only get data as far back as
5,000 bars would provide. Thus, the ATH/ATL will not show the ACTUAL ATH/ATL but the highest high/lowest low within the last 5,000 bars. So if you want to get more
granular then I suggest you going with a Lower TF but if you want to see the ACTUAL ATH/ATL then the Daily TF or higher is what you're looking for. Make sure to note
that when a coin's plot is staying even with the 0 or 100 line(0 being the ATL within the TF and vise versa) that means the coin is pushing the ATH/ATL further than it
previously was, Also, as with many of my other scripts, I've included a coin filter that will either allow or disallow the plot to be printed depending on if the
"Printed Bar Count" is selected and if it's % is above the threshold (set by the user). This filter will pretty much be useless on the higher TF so don't expect a change
in the data output if you're using a HTF and have that filter selected for use. Elaboration on the inner-workings of MOST inputs can be found in the tooltips provided
along side it and viewed within the settings menu by hovering your curser over the little circled "i" next to the appropriate setting (or near it if the tooltips are
referencing each other or other inputs around itself). May the force be with your trades (in my best Darth Vader voice). Toodles. -ChasinAlts
Multi-Indicator Divergence ScreenerHere is a new screener for everyone.
I have applied my Better Divergence On Any Indicator logic to scan 3 different indicators and up to 6 different assets at one time. Shoutout to LonesomeTheBlue and QuantNomad for their respective work on divergence and scanner scripts. I've implemented similar logic to put together this scanner.
So far, I have added support for RSI, OBV, MACD, MFI, Stochastic, and FSR, though I'm happy to add more by request. Please note, for simplicity, I have removed the logic to filter for only overbought/oversold divergences. Because this can scan both centered oscillators and non-centered indicators, overbought/oversold does not apply to all of them. I may try to find a way to work in back in later, as time allows.
Personally, I like to find confluences different types of indicators. For instance, agreeable divergence with a centered strength oscillator like RSI and a volume based indicator like OBV gives me more confidence that there will be follow-through.
Like in the Better Divergence script, you can opt to scan for confirmed divergences, potential divergences, or both.
You have the option to show or hide a table that will tell you exactly which assets have divergence, on which indicator they were found, and how many points of divergence were identified. By default, bull divergences will be green, bear will be red, but you can change these base colors to your liking. Confirmed divergences are shown with a solid background, while potentials (if selected) are shown with transparent background. If all 3 of your chosen indicators have divergence in the same direction, the asset name will show in the bull or bear color to highlight the confluence.
Alerts have also been set up to fire on bar close. The message will essentially tell you the same thing the table does, but in condensed format.
You can choose to have alerts fire any time there is any divergence detected across all assets, only when there are divergences on at least 2 of the chosen indicators for a given asset, or limit them to only when all 3 indicators show divergence in agreement.

OHL Screener by KiranScript is intended to scan Open = High and Open = Low (OHL) stocks for selected Opening Range in minutes.
I have added NSE NIFTY 50 stocks as default input for the script. Hopefully it will work with other stocks and exchanges.
Opening Range time is limited to the "1 min, 3 min, 5 min, 15 min, 30 min and 60 min" as OHL generally required for Intraday.
Stock qualified criteria OPEN = LOW (in selected Opening Range timeframe) will be listed in the table at TOP RIGHT corner of the chart screen in a green background.
Stock qualified criteria OPEN = HIGH (in selected Opening Range timeframe) will be listed in the table at BOTTOM LEFT corner of the chart screen in a red background.
Script scans stocks irrespective of current chart symbol and current time frame on the chart.
Limitations:
- Maximum 40 stocks can be scanned.
- request.security can't be placed under loop hence repeat call to request.security should be placed on separate line

Hammer / Shooting Star ScannerAlways missing hammer and shooting star candlestick pattern?
This script will help you to alert hammer shooting star candlestick.
Please leave your comments for improving this script.

40+ Coin Screener (workaround to 40 Security Limit Per Script) This is a far inferior method for a screener/scanner (compared to my first publication) but after looking at that script from a noobs eyes again, I could see how this form would be a lot easier to take in/understand so wanted to publish it. Everything that I could think of to mention about this is in my 1st pub so ill leave it to you to check it out...though I did include some comments in the script. It is pretty straight forward but if you have any questions don't hold them in. I'll answer them if I can. The only thing that is not in this one is setting up the alert feature so that you only have to create 1 alert per iteration of the script and it takes care of all of the coins for that iteration/set that is chosen in the settings (so please see previous script if would like to do this for your screener/scanner).
To be PERFECTLY CLEAR, the workaround is to the issue of not being able to scan but only 40 coins per script. You can scan more than 40 per script but only if you create "batches" or "sets" that the user can select within the settings which set to use for each iteration of the script on the chart. That being, you have to the script multiple times to the chart and merge them into 1 window and merge the scales (instructions in first publications). Here in this script I am scanning 72 different coins that are the Margin Coins on KUCOIN. I have split them up into 3 sets (24 coins per set). I could have made 2 sets but the script will be slower to load and to respond (like, when it comes to receiving alerts), thus I split them up the way I did. If you want to change any of this there are slightly more details in the previous script.
One great use-case that I LOVE about this particular version (and the way I use it) is right at the end of when I see a whole market dump/pump coming to an end and want to know which horse to bet on. Used to think whichever coin come out the fastest from the dump was the one to bet on but quickly learned that 1-2 (or even a few) hrs needs to go by first bc the ones that look the strongest in the beginning are NOT the ones to have performed the best when viewing the results 12 hrs later. IN FACT, many instances of using this exact script for reasons as such has taught me that the manipulators (I believe this to be the case as least) WANT everyone to bet on these that come out the gate the hardest and thus they make them move REALLY hard in the beginning then they QUICKLY become stagnant (moreso, they become WORSE than stagnant, they actually quickly retrace to put you into the negative so that you get out to get into the others now moving (to provide the market with more liquidity. They WANT you to get into a coin thats moving crazy hard so that they can then cease that movement once many fall for the trick just to then make that once strong looking coin now stagnant and make others move crazy hard. They wait for you to get out of the 1st and into the next set of movers just to do this time and time again bc hey, what are we sheep good for other than to provide the big guns with liquidity, am I right? Thats rhetorical, which you would know if you've ever had this happen to you (without a doubt MANY of you have). Let this script (above all other things) provide good evidence to back up this cynical way of viewing the markets to anyone that is questioning it.
This prolonged time between when the dump is over and when the ACTUAL movers REALLY start moving can actually be of great benefit to us sheep if used correctly, Firstly, it gives us some time to determine if when we thought was the bottom, ACTUALLY was the bottom. That bottom is easily determined if there are no (or very few) coins that went any lower than the point in time that the script began calculating on. Secondly, it allows us time to wait for the REAL movers and shakers to start moving and shaking.
One new feature that I LOVE that TV has implemented is the ability (once the script is added to the chart) to be able to click a point in time on the chart where you want the script to begin its calculations. If this point needs to be changed at any point in time then you can either go into the setting and input the time you wish or simply remove the script and add it again so that you are prompted to select another point in time. Ok, I think that everything I wanted to say. The next version that I will add will be probably my favorite and most used by yours truly...not to mention unique in a way that I have yet to see an implementation anything like it in all of TV's public library. Not to say its not there, but I have yet to come across it and I have DEFINITELY done my fair share of searching for it when I couldn't figure out how to code it for the longest time (though, I was and still am a noob so might get some great feedback on better ways to approach it, but we'll save that jabbering for the next of the publications.
I hope each and every one of ya'll (yes, Im from the South) have the GREATEST of Thanksgivings (if in the US that is...I graced my parents with the best gift anyone could have given them 35 years ago on Thanksgiving....MEEEE ;) So I will sure as hell be having a great holiday. Thanks for checking out my script...you can "like" and leave a comment if you so feel the urge to...or not. Im not doing this for me, but rather to stretch my arms out as far as possible to benefit the most people as possible and more people would see the script if it has more likes/comments/traffic pointing towards it...not to mention as other publishers have...it IS gratifying to see a few likes in my side window, which btw, I have MANY more variations and completely diff types of scanners/screeners Ill be publishing in the future and to know that they've become of use....I"VE become of use to the community is very....pleasing to me and does (as I've also seen many publishers mention as well) drive me to want to publish ones that I originally thought I would keep for myself. Peace out people.

Relative Volume Screener AlertsThis script will screen 12 different stocks and current chart (13 in total) for entry points from my relative volume indicator.
1. Enter in any ticker ID's from charts you wish to scan in the settings.
2. Go to desired timeframe.
3. Click add alert button at top toolbar.
4. Select RVOL Screener Alerts indicator, input alert notification settings and/or change alert name and click create.
The script will then scan the stocks and alert you of any entry points from the timeframe you set the alerts.
A new alert needs to be created for each timeframe you wish to screen.
You can find my relative volume indicator here:

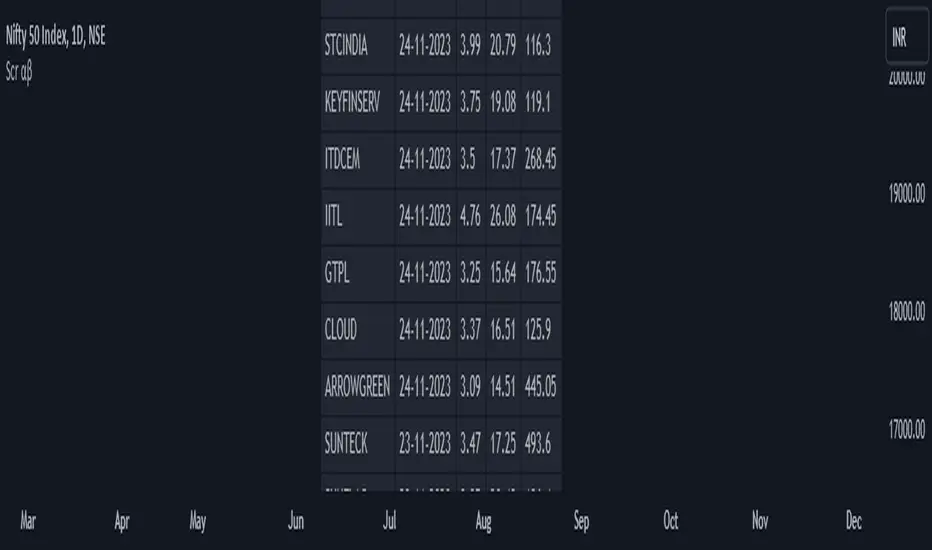
Screener: Alpha & BetaThis is a Live Screener for my previous Alpha & Beta indicator, which filters stocks lively based on the given values.
Use 5min timeframe for Live Intraday.
The default stocks in the screener is selected based on high beta value from F&O listed stocks. It may include other stocks also.
User can input stocks of your choice either through the menu or through the Pine editor.
The maximum number of stocks inputs is only 40. The indicator includes only 20 stocks by default.
More number of stocks can be added but it makes the screener slower to load.
Open the indicator in a sperate tab or window to avoided the loading lag.
It is recommended to choose only 10 to 20 stocks based on the weightage from each sectors.
Beta values are dynamic. It changes from day to day based on the trend and sector.
Update the sock list weekly or twice a week or monthly.
Use investing.com screener(preferably) or TradingView screener for shortlisting beta stocks.
Remember that majority of indicators fails in a sideways market, also every indicator is not 100% accurate.
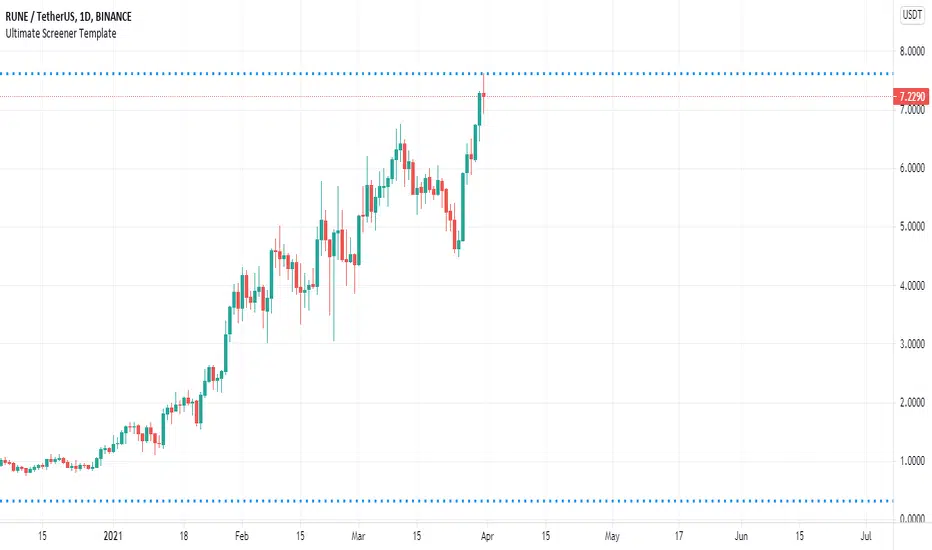
Ultimate Screener TemplateHello Traders
With the Ultimate Strategy Template , I shared a template to connect any indicator to this template and get backtesting results in less than a few minutes
Now sharing another template ... many traders ask me to develop for them a screener/scanner based on a custom indicator on TradingView.
The current TradingView screeners are great but don't allow for much customization; as we can only select pre-defined filters
I don't know when we'll be able to natively screen among hundreds of assets with a custom indicator... then.... I created this template for the time being.... which should
A whole new world
The Ultimate Screener Template screens over 38 securities.
What's very cool is that you'll only need to create 1 alert to scan over 38 securities: Explanation with this image here
I totally understand that not all TradingView accounts have a lot of alarms; with this template, you can multiply the number of custom alerts you're initially allowed to.
What if I need to set alerts on more than 38 securities?
Pretty straightforward... you can create alerts only if the indicator is added to your chart first.
So if you need let's say 100 securities, add this indicator 3 times on your chart (38*3 > 100) and then... edit the securities for your 3 indicators
How to update your Screener settings
Alert mode
As per Pinescript reference , this template allows setting the alert frequency
Possible values are:
- alert.freq_all (all function calls trigger the alert)
- alert.freq_once_per_bar (the first function call during the bar triggers the alert)
- alert.freq_once_per_bar_close (the function call triggers the alert only when it occurs during the last script iteration of the real-time bar when it closes).
All-time-high and All-time-low
This template shows how to capture ATH and ATL alerts across many securities
I used the functions from Quantnomad:
Whenever a new ATH or ATL is made, the screener will send a personalized alarm with a personalized text based on the security triggering this alarm
The code is pretty straightforward and shows you the part you'll need to update to transform your favorite custom indicator into a powerful screener.
If anything is unclear in the code, please leave a comment and I'll respond as soon as possible
All the best
Dave
Custom GAP UP scanner for NIFTY StocksThe security function can be called 40 times in a codescript. We can therefore scan about 40 stocks out of NIFTY 50 stocks with a single script.
This code can be modified to search for other scripts by changing the condition function
condition() => open > (close * 1.0025)
Only stocks which have gap up of 0.25% or more will be reported.

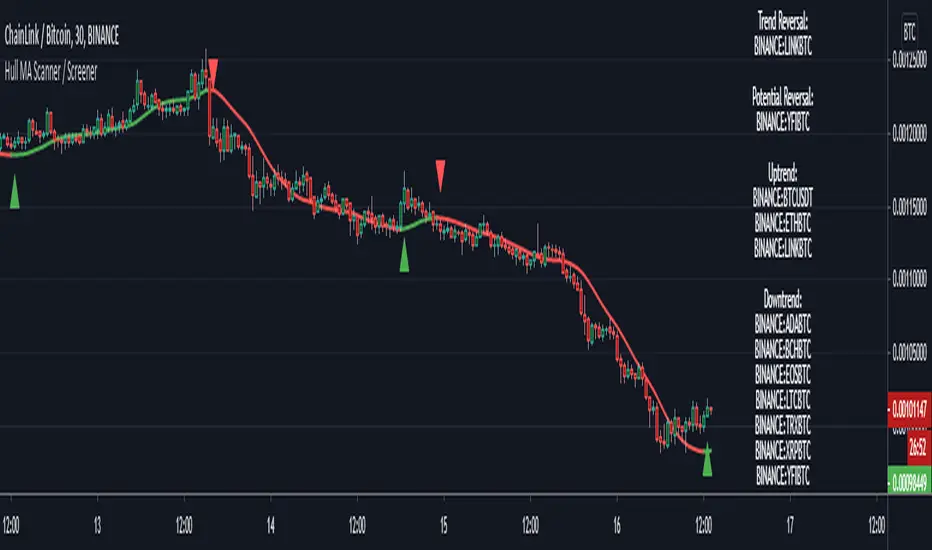
Hull MA Scanner / Screener LabelThis screens for Hull MA trend reversal's in 10 different securities. If the label color is not visible due to the text in it being white colored, then choose a different color from settings. Also added a simple HullMA to it. If want can increase it upto 40 securities in the code which is upto user to decide.
This was requested by soderstromkenan in comments and looked like a nice idea so decided to make it.
The Hull MA logic is from "Hull50" by u/RafaelZioni with his permission. Screener logic from u/Quantnomad with his permission.
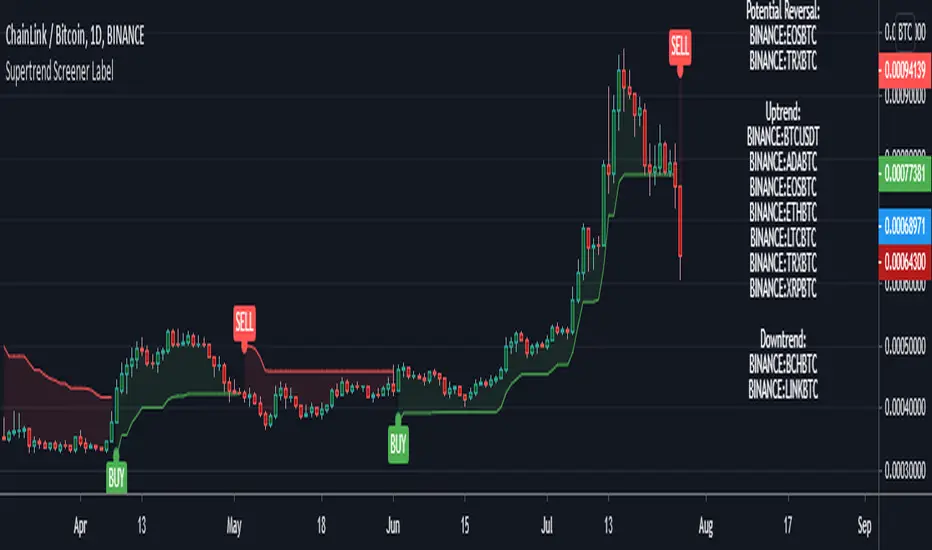
Supertrend Screener LABELThis screens for Supertrend reversal's in 10 different securities. The main logic for the screener is taken from "Simple Custom Screener in Pinescript" by QuantNomad with his permission. If the label color is not visible due to the text in it being white colored, then choose a different color from settings. Also added a simple supertrend to it.
Terminology explanation:
Confirmed Reversal: Supertrend reversal that happened in the last bar and cannot be repainted.
Potential Reversal: Supertrend reversal that might happen in the current bar but can also not happen depending upon the timeframe closing price.
Uptrend/Downtrend : Shows all the tickers that are either currently in uptrend or downtrend.
Bullish Piercing ScannerA piercing pattern is known in technical analysis to be a potential signal for a bullish reversal. The formation in its strictest form is rather rare, but tends to perform better the longer the downtrend in front of it. When technical studies such as RSI, Stochastic or MACD are showing a bullish divergence at the same time a piercing pattern appears, it strengthens the likelihood that this two-day pattern is meaningful.
This is a two-candle pattern. The previous candle must be bearish, the recent candle must open below the close of the previous candle, the recent candle must close above the middle of the previous candle. You can adjust the closing and opening gap between the two candles within this scanner's settings (price).

Kicker ScannerThe kicker pattern is deemed to be one of the most reliable reversal patterns and usually signifies a dramatic change in the fundamentals of the company in question.
It is a 2-candle pattern, whereby there is a significant gap between the body of the most recent candle and the previous candle.
A bullish kicker is one in which the most recent candle is bullish, and the previous candle is bearish.
A bearish kicker is one in which the most recent candle is bearish, and the previous candle is bullish.
I notice this works best for stocks, as there are many gaps in a stock chart. Currencies have few gaps, and thus few kickers.
From within the settings, you can set the minimum permitted gap between the two candles, specified in price, accurate to 6 decimal places; 0.000001.

Tweezer Scanner v1Some code for detecting tweezer candles, which are reversal patterns. You'll need to tweak the settings to be either less strict (more detections) or more strict (less detections). I found that if you follow the documentation for tweezers exactly, you will get very few detections. It is possible that this candlestick has become overused, so the original pattern itself has been lost to the noise of the market.
Settings:
1. Tweezer Max Body Height (Pips) - How tall can the body of the tweezer be, in pips (increase this pips to increase detections)
2. Tweezer Body Similarity (>%) - How similar should the body heights be, higher percentage is more similar (reduce this % to increase detections)
3. Tweezer Tail Similarity (>%) - How similar should the tail heights be, higher percentage is more similar (reduce this % to increase detections)
4. Tweezer Tail Proportion (<%) - How short should the opposite tail heights be, lower percentage is shorter and more similar to the documentation (increase this % to increase detections)

Marubozu Scanner v1Some code for detecting the very rare occurrences of the Marubozu candle. This candle occurs when the High = Close, and Low = Open, or vice versa. They are continuation candles, so if you see a bullish Marubozu during an uptrend its possible that the uptrend will continue.

Doji Scanner v1A scanner for detecting Doji Candles.
Adjust the maximum allowable height of a Doji Candle's body, depending on the currency pair or asset.


Detect Sequential Trading - Bot DetectorDetect Sequential Trading - Bot Detector.
This tool requires access to volume data .
There are many trading bots out there, that trade 24/7 .
The detector can be used to understand how the bots are configured - to push the market up or down .
Alerts can be set to fire whenever a bot pattern is detected .
They must be configured to run Once per Bar .
It works well with range charts (1R) .
It would work best on 1 second charts or tick charts (currently, TradingView's alert system doesn't work with second charts).
The alternative would be 1 minute charts .
It can be used on higher timeframes but may be less effective.

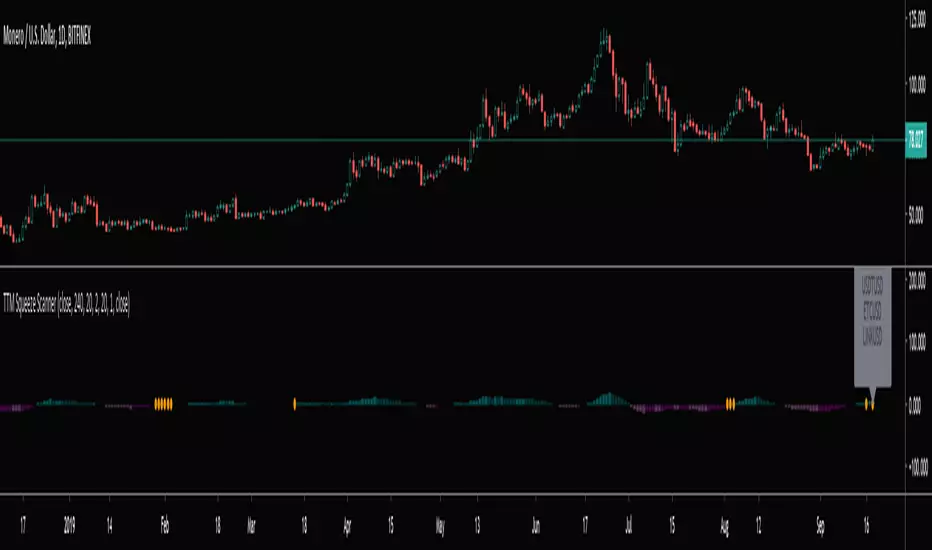
TTM Squeeze Scanner This script scans for TTM Squeezes for the crypto symbols included in the body of the script. The timeframe for the squeeze scan is controlled within the input not the chart.
This script is a merge of @Nico.Muselle's TTM Squeeze script and @QuantNomad's custom screener script. Thanks to both of them!