SIMPLE MOVING AVG 10,20,50,100,200 with RESOLUTIONThis indicator is the best than all other sma indicators.Because in just one click you can change all the resolution /time frames for all the sma .
Multitime frame analysis can be done in just one click. just change the resolution to
15 min/30 min/1hr- if you intraday trader
1D- LONG TERM INVESTORS.
Multi-timeframe analysis (MTF) is a process in which traders can view the same ticker/indicator using a higher time frame than the chart’s, for example, displaying a daily moving average on a one-hour chart in just two clicks.
How to Use this to Buy Stocks ?
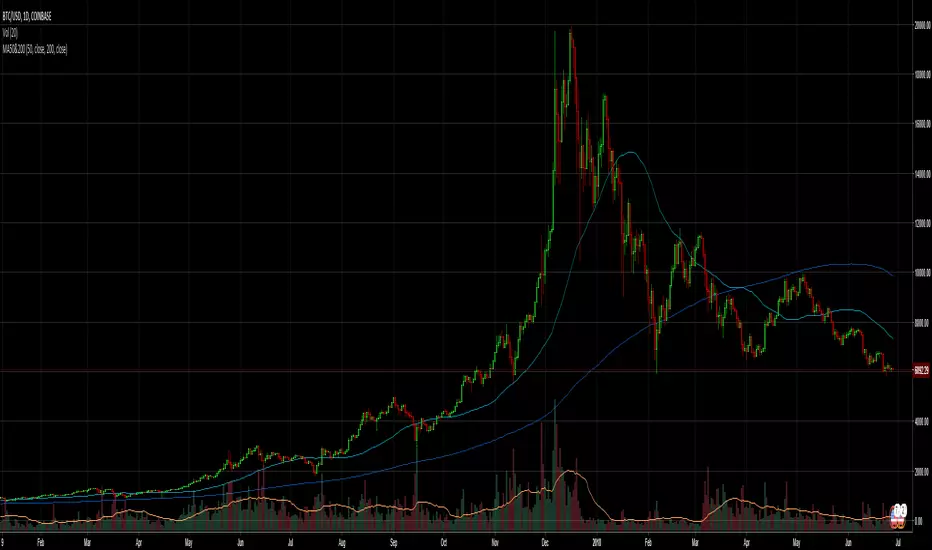
The technical indicator known as the Death cross occurs when the 50-day SMA crosses below the 200-day SMA => Bearish Signal.
An opposite indicator, known as the Golden cross, occurs when the 50-day SMA crosses above the 200-day SMA => Bullish Signal.
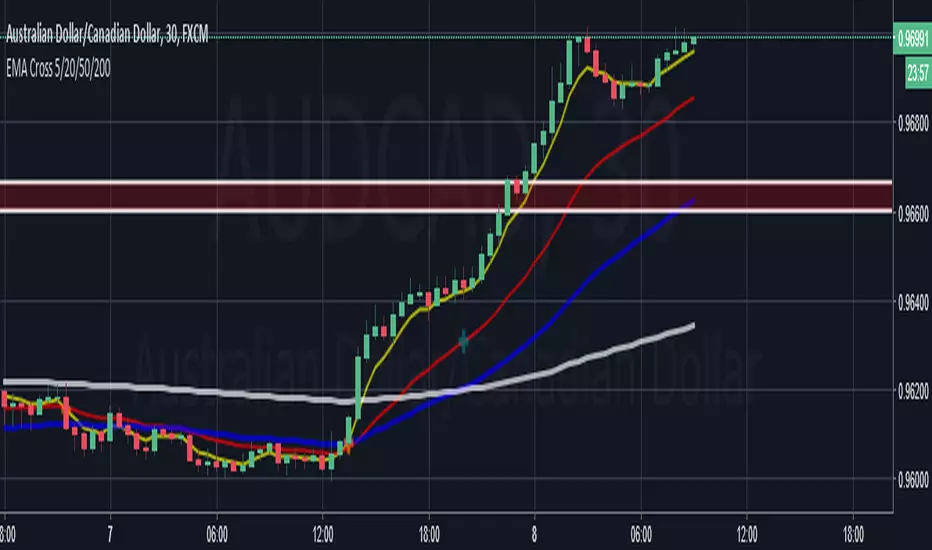
Crossovers are one of the main moving average strategies.
1st Strategy is the first type is a price crossover, which is when the price crosses above the sma => Buy signal
when the price crosses below the sma => Sell signal
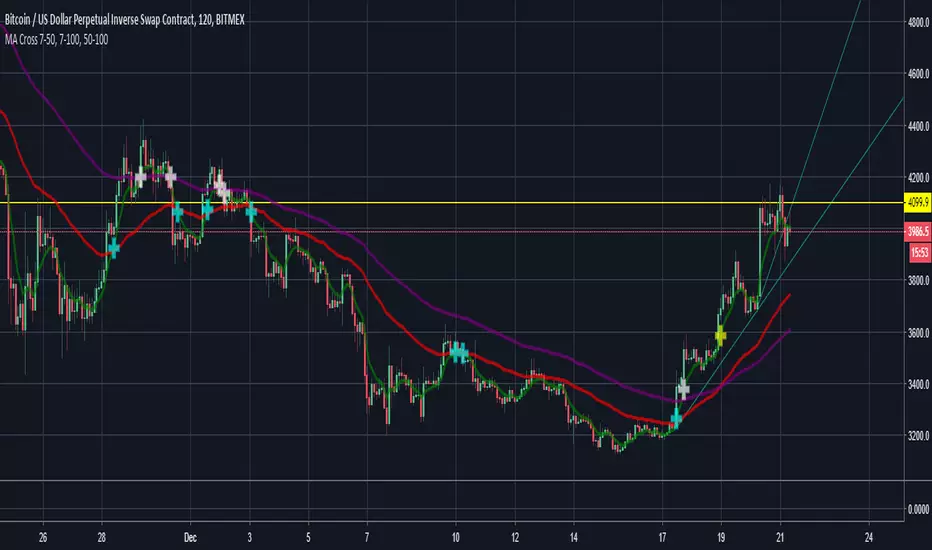
2nd Strategy is to apply two moving averages to a chart: one longer and one shorter.
When the shorter-term MA (100) crosses above the longer-term MA (200), it's a buy signal, indicates trend is shifting up.
This is known as a "Golden cross."
Meanwhile, when the shorter-term MA (100) crosses below the longer-term MA (200), it's a sell signal, indicates trend is shifting down.
This is known as a "Dead/death cross."
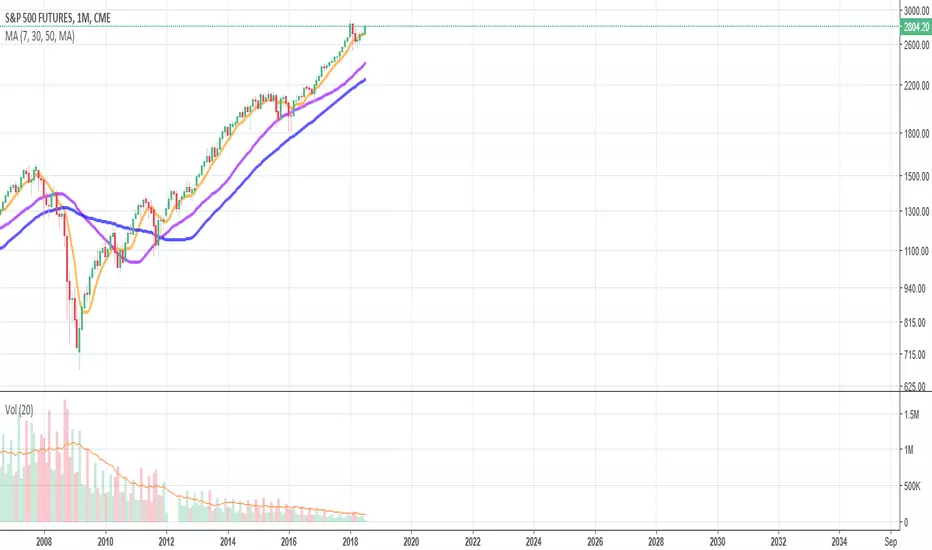
The time frame or length you choose for a moving average, also called the "look back period," can play a big role in how effective it is.
An MA with a short time frame will react much quicker to price changes than an MA with a long look back period. In the figure below, the 20-day moving average more closely tracks the actual price than the 100-day moving average does.
A 20-day MA = more beneficial to a shorter-term trader, since it follows the price more closely.
A 100-day MA = more beneficial to a longer-term trader.
Moving averages work quite well in strong trending conditions but poorly in choppy or ranging conditions.
use this indicator along with Price action theory and not alone.
Moving average crossovers are a popular strategy for both entries and exits. MAs can also highlight areas of potential support or resistance
Happy Trading
在腳本中搜尋"股价长期底部,市值50亿左右"

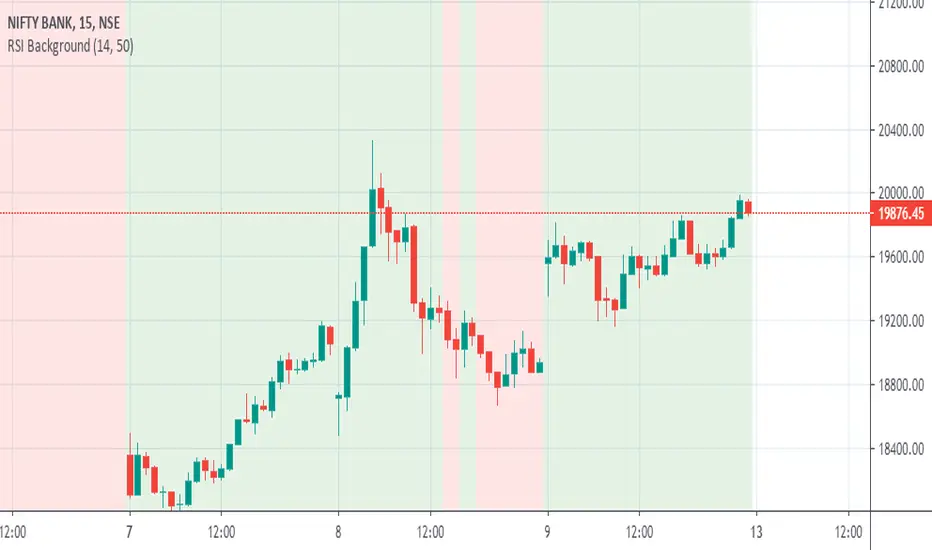
RSI 50 BackgroundThe script changes the background depending on the RSI 14 values. If RSI 14 values is above 50 the background is green and if RSI value is below 50, the background will be red.
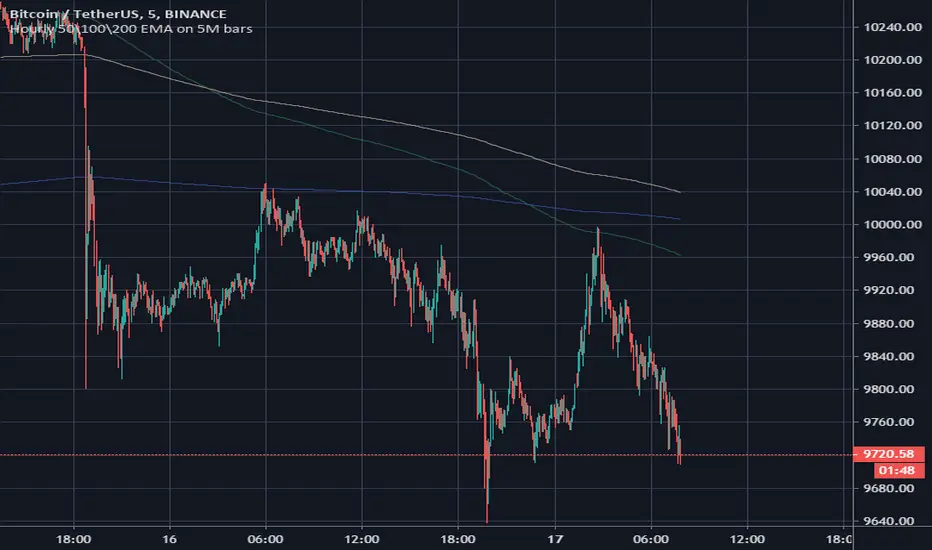
Hourly 50\100\200 EMA on 5M barsHello. This script was created for traders using a 5 minute timeframe. The script allows you to plot EMA from a higher level timeframe. Its formula includes the multiplication of the classical values of 50/100/200 EMA by 12, because in one hour it is 12 times for 5 minutes. You must use script only at 5M timeframe, because his interval is unique and not compare with other timeframes.
Often, an hourly EMA on a 5-minute timeframe becomes a strong level of support or price resistance. You can use this script on 5M timeframe with "daily 50/100/200 EMA" script on 1H timeframe for best scalping results.
Good luck in trading!
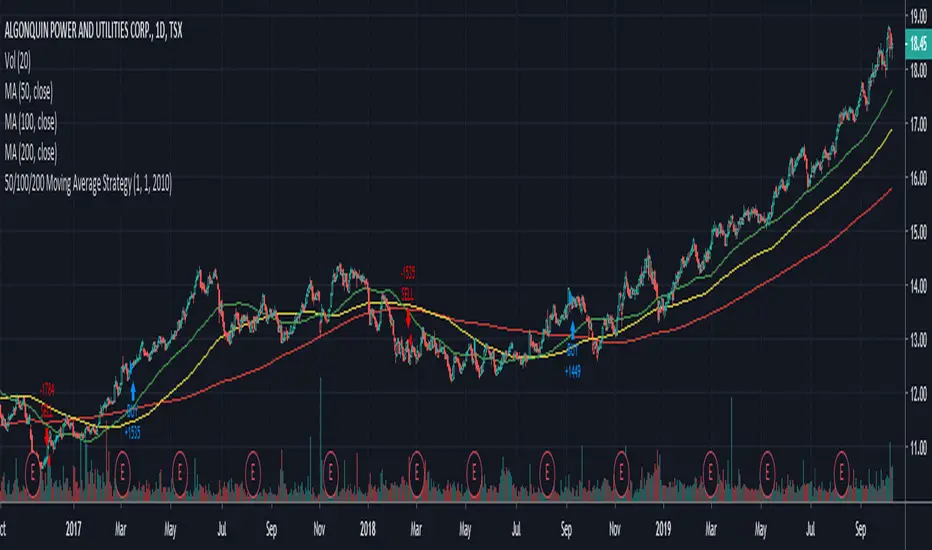
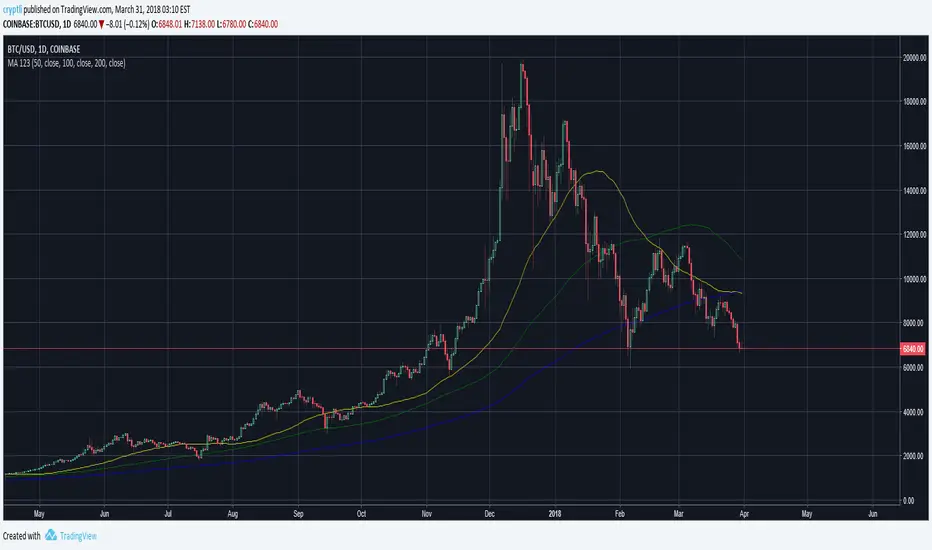
Easy to Use 50/100/200 Day Moving Average StrategyWhenever you see someone publish a chart or idea, what's the one thing you almost always see? Moving Averages!
Many investors focus on these indictors solely as entry and exit points, so here's an easy to manipulate strategy to backtest and see if this is feasible on your security.
CODE VARIABLES
LINE 2 - Here you can change your currency and amount you want to invest on each entry.
LINE 8/9/10 - Here we establish the 50 (Fast), 100 (Medium) and 200 (Slow) day variables. These can be adjusted to your choosing.
LINE 13/14/15 - Here we establish what date we want to start backtesting from. Simple change the defval on each line to change the date (In the code below we start on Jan 1st, 2010).
LINE 20/23 - Here, within the crossover and crossunder functions, we set which MA's must cross to enter and exit a trade. Below we have the 50 day moving above and under the 200 day. Simple change the variables to FastMA, MediumMA and SlowMA to your choosing.
NOTE: As a beginner you may not want to short stock, therefore LINE 5 was added to only allow long positions.
Hope this helps, from one beginner to another.
Cheers!
SMA 21/30/50/100/200 with Cross by DragonByteCombines several key simple moving averages into one slot without going overboard. Includes cross indicators between the 50/100 and the 50/200 day SMA's.

EMA 20/50 & 50/200 Cross StrategyThis is a simple script using the 20 50 & 200 EMAs
Future modifications coming. I plan to add volume and other plots to this strategy as I continue to develop it.

SMA 50 collector V2Hi everyone
The today script is an upgrade on steroids of my previous SMA 50 collector
Why this script ?
The SMA 50 is known to define a trend. If price is closing above, trend is bullish , if below, trend is bearish.
That's why I like to have all of them in all timeframes on my chart :)
Those are very relevant for all assets class : FOREX, INDEX, STOCKS, CRYPTO, ...
What's the update ?
I added new timeframes and developped a small optimization to get those labels placed on the right hand side of your screen.
"Is it really useful sir ?" Well, you certainly noticed that looking at a chart on tradingview mobile is not ideal (indicators overlapping, indicator names taking too much space and so on...)
When you'll deactivate the indicator name label display from tradingview, you can activate mine which will look way nicer on your mobile (and even Desktop).
This concept was greatly inspired by @scarf :
HOW TO USE IT ?
You can activate/deactivate the SMA50 you (don't) need in the style section of the indicator configuration UI. You'll just have to uncheck/check. Simple right :) ?
See y'all tomorrow for the next indicator or idea. The one for tomorrow should blow your mind as it certainly did when I discovered and optimized it
Enjoy
Dave

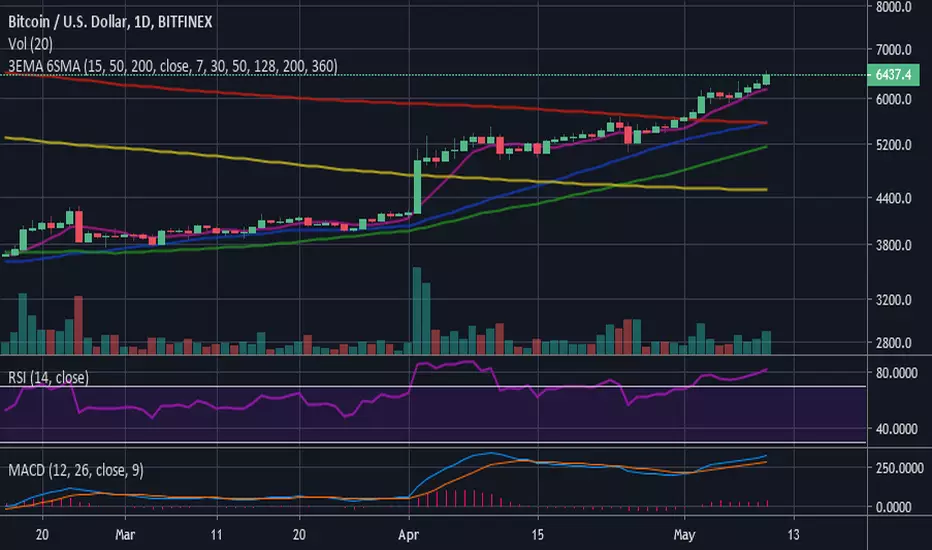
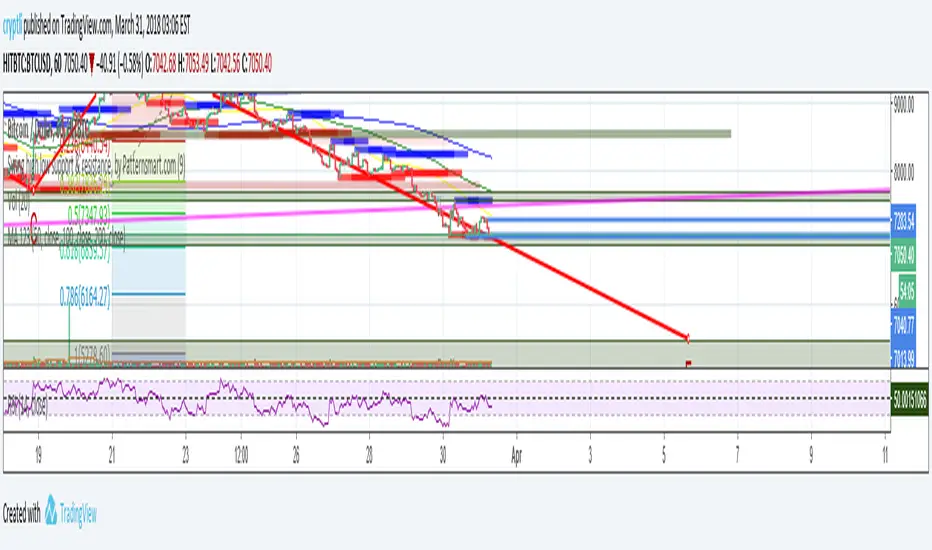
3 EMA (15-50-200) - 6 SMA (7-30-50-128-200-360)3 Moving Average Exponential - 6 Simple Moving Average . Crypto EMA - MA . 7 is a fast support or resistance, 15 confirmation support or resistance. 30 Important support and resistance . 50 institutional support or resistance. 200 institutional general trend, support and resistance , 360 general trend, support and resistance . The use of EMA or MA is according to your liking/trading plan
The Last 50 Trading System - RSIThis is an adjustment to default RSI indicator
14 time period to 8
70 and 30 lines to 80 and 20
change RSI line color on oversold and overbought area to yellow
this indicator is for the use of "RSI 80 - 20 Trading Sytem: Learn to Trade Divergence, and Find a Low Risk Way to Sell Near The Top or Buy Near The Bottom " by TradingStrategyGuides.com
You can FREE download the PDF here drive.google.com (GDrive)
you will also need "The Last 50 Overlay" Indicator to put on chart

EMA 50, 100 and 200Draw a set of 3 EMA: 50, 100 and 200. It highlight with a circle the crossing of EMA(50) with other EMAs

Delphiguy EMA Cross 5/20/50/200A simple Indicator for EMA 5, 20, 50, 200.
It shows gives potential trades on the crossover of the 5/20, and 50/200
It also shows price trend via the 200EMA
Triple Moving Average (7, 30, 50)Same as , because Trading View doesn't allow you to change the visibility settings after publishing.
Moving Averages 50 & 200Moving Average Indicator for trading 50MA and 200MA crossovers (golden cross and death cross).
A golden cross is considered a bullish sign; it occurs when the 50-day moving average rises above 200-day moving average. A death cross is considered a bearish sign; it occurs when the 50-day moving average drops below 200-day moving average.
SMA/EMA 12|26|50SMA/EMA 12|26|50
Exactly as title says
SMA is bold
EMA is light
Orange 12
Green 26
Blue 50

Moving Averages MA 50,100 and 200Just a simple collection of 3 most used Moving Averages 50,100 and 200
50=Yellow
100=Green
200=Blue
Moving Average 50,100 and 200Just a simple collection of 3 most used Moving Averages 50,100 and 200
50=Yellow
100=Green
200=Blue
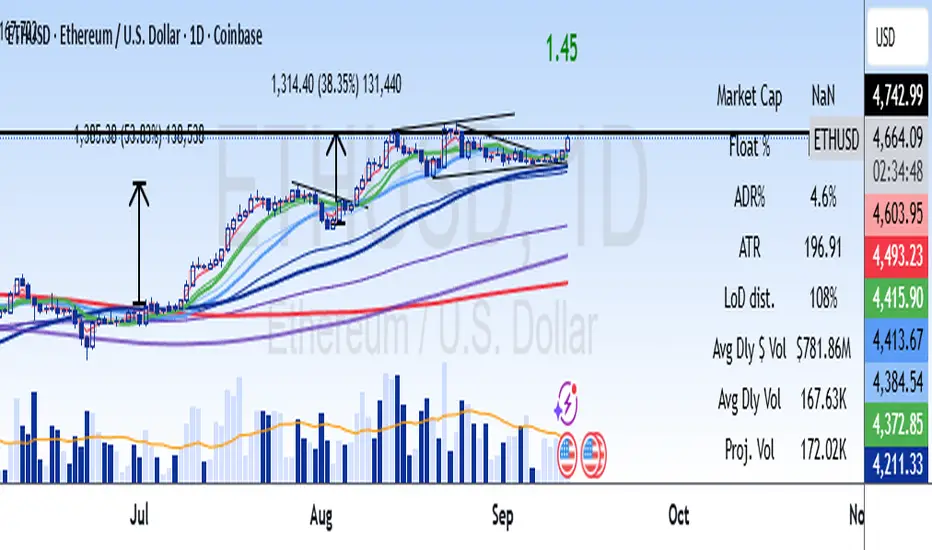
Smooth Cloud Trend Filter (20/50 EMA)The Smooth Cloud indicator visualizes market trend direction using two Exponential Moving Averages (EMAs): a Fast EMA (20-period) and a Slow EMA (50-period).
The area between these averages forms a shaded cloud that changes color according to the trend bias:
🟢 Green Cloud: Fast EMA is above the Slow EMA → Bullish trend.
🔴 Red Cloud: Fast EMA is below the Slow EMA → Bearish trend.
On this chart, the cloud remains green for most of the period, reflecting a strong and persistent uptrend.
During minor pullbacks, the transitions stay smooth, showing that the trend filter reacts steadily without excessive noise.
Price action consistently holds above the cloud from late September through early October, indicating sustained buyer control and bullish momentum.
This view focuses solely on the trend structure provided by the Smooth Cloud.
While other modules of the full system (such as the RSI Liquidity Spectrum and Zig Zag++ Volume Profile) add momentum and liquidity context, the Smooth Cloud alone highlights clear directional bias and trend strength.
When the price trades above a green cloud, traders often look for long opportunities on pullbacks or RSI confirmations.
A red cloud flip would signal a possible trend reversal or weakening momentum, suggesting short setups instead.
The thickness of the cloud also offers visual insight — thicker clouds indicate stronger trend momentum, while thinner ones suggest consolidation or indecision.

ORB + SMA 20/50 Crossover BUY/SELL by Yuvaraj Veppampattu Plots ORB High & Low lines for the first X minutes.
Adds SMA 20 & SMA 50 lines on chart.
Shows BUY arrow when SMA20 crosses ABOVE SMA50.
Shows SELL arrow when SMA20 crosses BELOW SMA50.
Adds alerts for both ORB breakouts & SMA crossovers.

Nifty 50 Scalping - Bullish Buy & Bearish Sell (5 Target / 2 SL)Nifty 50 Scalping - Bullish Buy & Bearish Sell (5 Target / 2 SL)

Distance from 50 SMA in ADR TermsIndicator produces a multiple of ADR% from the 50-day simple moving average to determine is a stock or etf is extended.
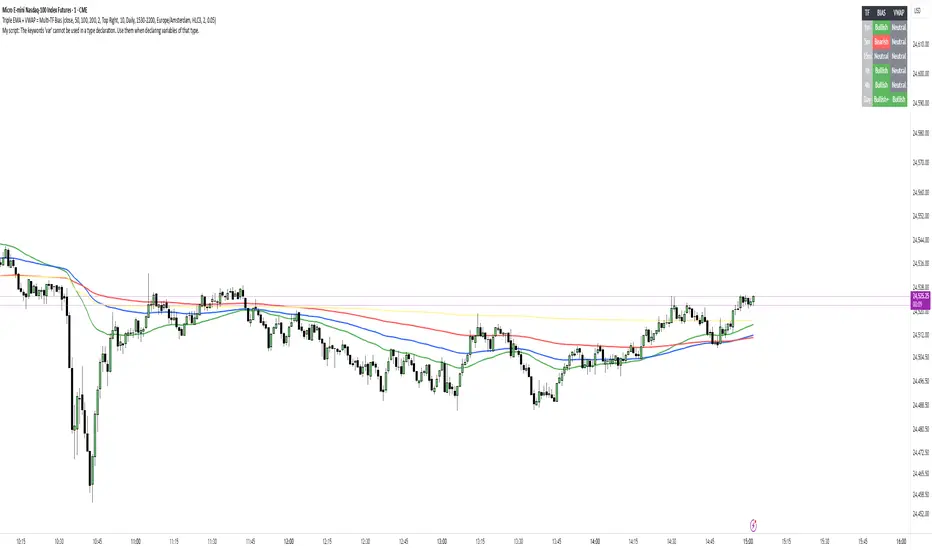
EMAs 20/50/200 with Trend ColoringIt calculates EMA 20, 50, and 200.
For each EMA, it compares the current value with the previous bar (ema > ema ).
If rising → green, if falling → red.
All three EMAs are plotted with different colors dynamically changing by slope.
