EMA bridge and dashboard with color coding.
Summary:
This is a custom moving average indicator script that calculates and plots different Exponential Moving Averages (EMAs) based on user-defined input values. The script also displays MACD and RSI, and provides a table that displays the current trend of the market in a color-coded format.
Explanation:
- The script starts by defining the name of the indicator and the different inputs that the user can customize.
- The inputs include bridge values for three different EMAs (high, close, and low), and four other EMAs (5, 50, 100, and 200).
- The script assigns values to these inputs using the `ta.ema()` function.
- Additionally, the script calculates EMAs for higher timeframes (3m, 5m, 15m, and 30m).
- The script then plots the EMAs on the chart using different colors and line widths.
- The script defines conditions for going long or short based on the crossover of two EMAs.
- It plots triangles above or below bars to indicate the crossover events.
- The script also calculates and displays the RSI and MACD of the asset.
- Finally, the script creates a table that displays the current trend of the market in a color-coded format. The table can be positioned on the top, middle, or bottom of the chart and on the left, center, or right side of the chart.
Parameters:
- i_ema_h: Bridge value for high EMA (default=34)
- i_ema_c: Bridge value for close EMA (default=34)
- i_ema_l: Bridge value for low EMA (default=34)
- i_ema_5: Value for 5-period EMA (default=5)
- i_ema_50: Value for 50-period EMA (default=50)
- i_ema_100: Value for 100-period EMA (default=100)
- i_ema_200: Value for 200-period EMA (default=200)
- i_f_ema: Value for fast EMA used in MACD calculation (default=9)
- i_s_ema: Value for slow EMA used in MACD calculation (default=21)
- fastInput: Value for fast length used in MACD calculation (default=7)
- slowInput: Value for slow length used in MACD calculation (default=14)
- tableYposInput: Vertical position of the table (options: top, middle, bottom; default=middle)
- tableXposInput: Horizontal position of the table (options: left, center, right; default=right)
- bullColorInput: Color of the table cell for a bullish trend (default=green)
- bearColorInput: Color of the table cell for a bearish trend (default=red)
- neutColorInput: Color of the table cell for a neutral trend (default=white)
- neutColorLabelInput: Color of the label for neutral trend in the table (default=fuchsia)
Usage:
To use this script, simply copy and paste it into the Pine Editor on TradingView. You can then customize the input values to your liking or leave them at their default values. Once you have added the script to your chart, you can view the EMAs, MACD, RSI, and trend table on the chart. The trend table provides a quick way to assess the current trend of the market at a glance.
在腳本中搜尋"视觉中国技术指标分析(如MACD、RSI、布林带)"

BTC Daily Strategy BFStrategy based on code by @CredibleHulk so thanks for that.
This is a strategy for the Daily Bitcoin chart which uses the MACD, RSI, Stochastic RSI and a moving average.
The conditions for long or short signals depend on the indicators above crossing user-defined thresholds.
Long signal = (Stochastic RSI k value is below Stochastic Sell Threshold) AND EITHER (MACD delta crosses above MACD Threshold OR RSI crosses above RSI Threshold)
Short signal = (MACD delta crosses below 0) AND EITHER (Close Price - an SMA of the ohlc4 values crosses below the DMA threshold OR Stochastic RSI k value is above Stochastic Sell Threshold)
INSTRUCTIONS
Green background = go long
Red background = go short
You can adjust stop loss values for long or short signals in settings as well as all parameters for the indicators.

EMA 21 + MacD + RSI + Alma
Setting
EMA 21 = Green
EMA 9 = yellow
MacD = 5 35 5
RSI = 10
Alma 20 0.8 8
RULES
Long:
1. EMA 9 below 21
2. RSI above 50 from Oversold
3. Macd Solid green
4. SL @ ALMA
5. Conditional buy limit order @ top wick
6. 1:3 RR
Short:
1. EMA 9 above 21
2. RSI below 50 from Overbought
3. Macd Solid red
4. SL @ ALMA
5. Conditional sell limit order @ bottom wick
6. 1:3 RR
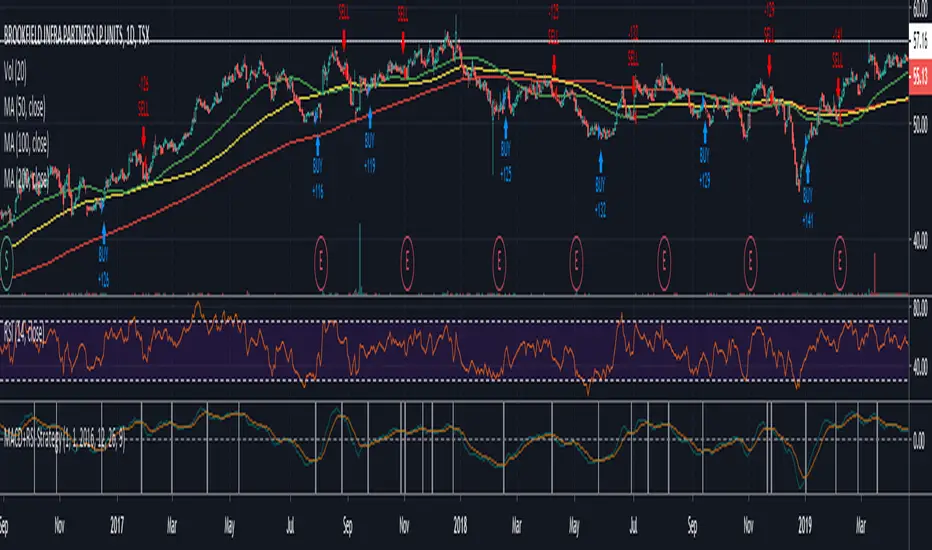
Multiple MACD RSI simple strategySimple strategy script I've had for a while but looks like I never published.
Although it is one of my most simple it seems to have the best profitability. It is pretty rough though. the Stoch RSI has only a little weight to the trade trigger. I'll refine it more over time or you can by all means. Basically the Stoch RSI current K line has to be OVER 40 to trigger a SELL. It has no effect on buy side.
The triggers are roughly as follows:
Year - since so many assets have gone 2x, 3x, 10x+ since 2013 having a strategy that earns a 500% return from 2013 to now isn't that good if buy-and-holding would have got you 800%. This eliminates some of that noise and makes it a little easier to quickly gauge success. So buy/sell trigger need a value of greater or equal to 2018 (default)
MACD 1 - First MACD (short) needs to indicate greater than 0 to buy or less than 0 to sell.
MACD 2 - Same as MACD1 but for second MACD set (long)
Uptrend - Latest close + high divided by last periods close + high needs to be grater than 1. So if latest is 34.30 close and 34.60 high and previous interval is 34.80 close and 34.82 high, that is 0.99 and will not trigger a buy trade.
Downtrend - Same thing but close + low and less than 1.
This script/strategy is pretty rough but if there is interest I'll polish it more since it is a pretty solid but simple strategy for most assets.

Becak I-series: Indicator Floating Panels v.80Becak I-series: Floating Panels v.80th (Indonesia Independence Days)
What it does:
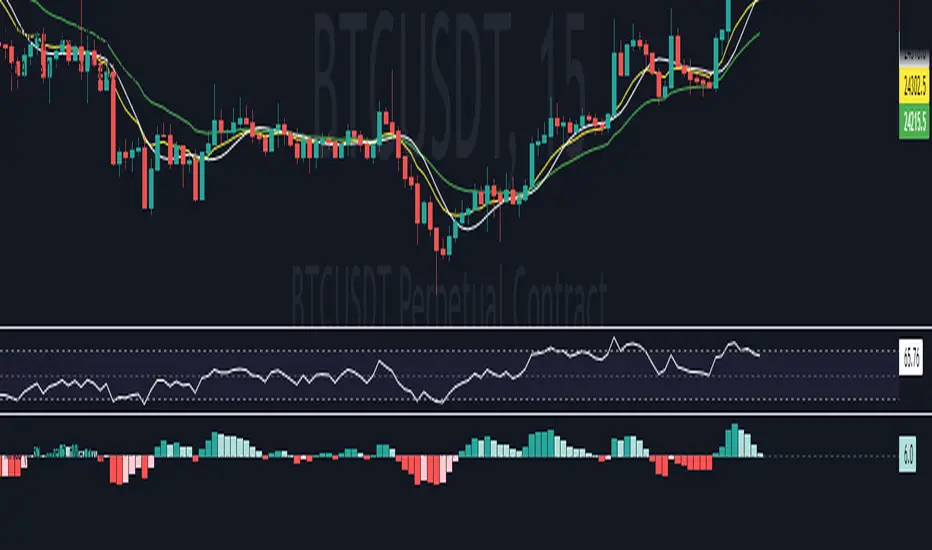
This indicator creates three floating overlay panels that display MACD, RSI, and Stochastic oscillators directly on your price chart. Unlike traditional separate panes, these panels hover over your chart with customizable positioning and transparency, providing a clean, space-efficient way to monitor multiple technical indicators simultaneously.
When to use:
When you need to monitor momentum, trend strength, and overbought/oversold conditions without cluttering your workspace
Perfect for traders who want quick visual access to multiple oscillators while maintaining focus on price action
Ideal for any timeframe and asset class (stocks, crypto, forex, commodities)
How it works:
The script calculates standard MACD (12,26,9), RSI (14), and Stochastic (14,3,3) values, then renders them as floating panels with:
MACD Panel: Shows MACD line (blue), Signal line (orange), and histogram (green/red bars)
RSI Panel: Displays RSI line (purple) with overbought (70) and oversold (30) reference levels
Stochastic Panel: Shows %K (blue) and %D (orange) lines with optional buy/sell signals and highlighted overbought/oversold zones
Customization options:
Position: Choose Top, Bottom, or Auto-Center placement
Size: Adjust panel height (15-35% of chart) and spacing between panels
Positioning: Fine-tune vertical center offset and horizontal positioning
Appearance: Toggle panel backgrounds and adjust transparency (50-95%)
Parameters: Modify all indicator lengths and overbought/oversold levels
Signals: Enable/disable Stochastic crossover signals
Display: Control lookback period (30-100 bars) and right margin spacing
Universal compatibility: Works seamlessly across all asset types with automatic range detection and scaling.
DIRGAHAYU HARI KEMERDEKAAN KE 80 - INDONESIA ... MERDEKA!!!!!

1EMA + 1MACD + 1RSI Crypto Strategy AB 092Title: EMA + MACD + RSI Crypto Strategy
Overview:
This is a trend-following and momentum-based crypto trading strategy built for 1H, 4H, and 1D timeframes, combining three proven indicators:
EMA 50 & EMA 200 Crossover – identifies long-term trend direction.
MACD Crossover (12, 26, 9) – confirms momentum shift.
RSI Filter (14) – avoids overbought/oversold traps and refines entries.
Buy Entry Conditions:
EMA 50 > EMA 200 (Golden Cross)
MACD line crosses above signal line
RSI is between 45 and 70
Sell Entry Conditions:
EMA 50 < EMA 200 (Death Cross)
MACD line crosses below signal line
RSI is between 30 and 55
Risk Management:
Configurable Take Profit and Stop Loss percentages via inputs.
Default: 3% TP, 1.5% SL (adjustable based on timeframe and asset volatility).
Best For:
Intraday trades on 1H (BTC, ETH, SOL)
Swing trades on 4H
Position entries on 1D (top 50 altcoins)
This script includes visual Buy/Sell signals, alert conditions, and customizable SL/TP logic — making it a clean, actionable, and reliable strategy for crypto traders.

Money Flow based probabilityMoney Flow based probability
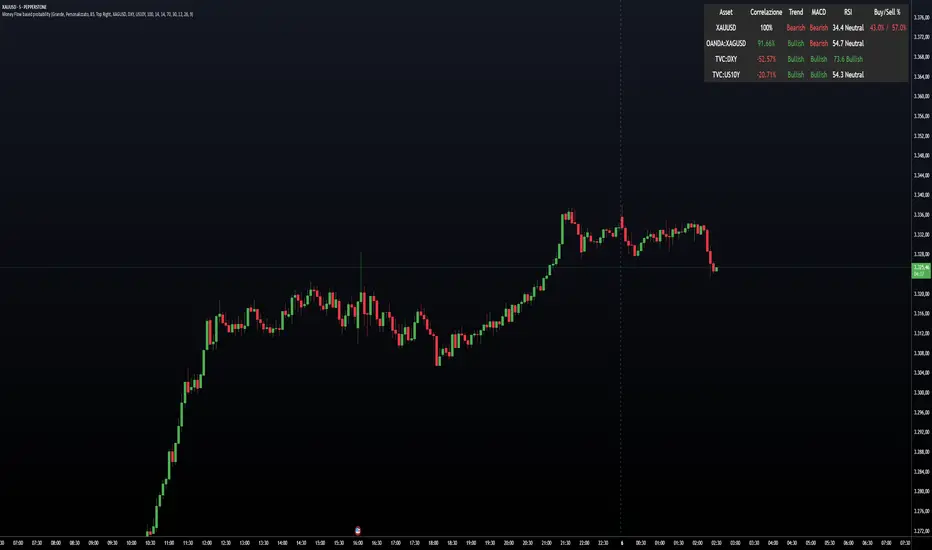
This indicator provides a comprehensive correlation and momentum analysis between your main asset and up to three selected correlated assets. It combines correlation, trend, momentum, and overbought/oversold signals into a single, easy-to-read table directly on your chart.
Correlated Asset Selection :
You can select up to three correlated assets (e.g., indices, currencies, bonds) to compare with your main chart symbol. Each asset can be toggled on or off.
Correlation Calculation :
The indicator uses the native Pine Script ta.correlation function to measure the statistical relationship between the closing prices of your asset and each selected pair over a user-defined period.
Technical Analysis Integration :
For each asset (including the main one), the indicator calculates:
Trend direction using EMA (Exponential Moving Average) – optional
Momentum using MACD – optional
Overbought/oversold status using RSI – optional
Probability Scoring :
A weighted scoring system combines correlation, trend, MACD, RSI, and trend exhaustion signals to produce buy and sell probabilities for the main asset.
Visual Table Output :
A customizable table is displayed on the chart, showing:
Asset name
Correlation (as a percentage, -100% to +100%)
Trend (Bullish/Bearish)
MACD status (Bullish/Bearish)
RSI value and status
Buy/Sell probability (with fixed-width formatting for stability)
User Customization :
You can adjust:
Table size, color, and position
Correlation period
EMA, MACD, and RSI parameters
Which assets to display
This indicator is ideal for traders who want to quickly assess the influence of major correlated markets and technical signals on their trading instrument, all in a single glance.
---
Example: Correlation Calculation
corrCurrentAsset1 = ta.correlation(close, asset1Data, correlationPeriod)
Example: Table Output (Buy/Sell %)
buyStr = f_formatPercent(buyProbability) + "%"
sellStr = f_formatPercent(sellProbability) + "%"
cellStr = buyStr + " / " + sellStr
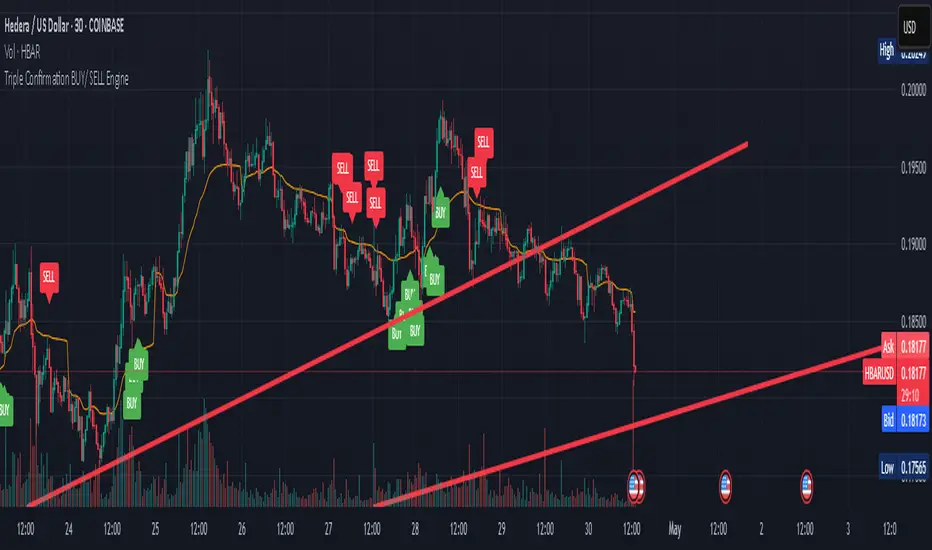
Triple Confirmation Buy/Sell Engine VWAP + MACD + RSIDescription:
This custom-built indicator generates high-confidence Buy/Sell signals using a powerful combination of MACD momentum, RSI strength, and VWAP trend confirmation — designed for cleaner entries and fewer false signals.
Unlike traditional scripts that rely on only one indicator (and produce noisy or early signals), this system requires triple confirmation, greatly increasing signal quality and reducing false trades.
✅ Buy Signal Conditions:
MACD histogram turns green (momentum shift positive)
RSI crosses above 50 (bullish strength confirmation)
Price closes above VWAP (trend confirmation)
🔻 Sell Signal Conditions:
MACD histogram turns red (momentum shift negative)
RSI crosses below 50 (weakening trend)
Price closes below VWAP (bearish confirmation)
🛠 Best For:
Trend traders seeking higher probability entries
Swing traders who want to catch bigger moves
Crypto, stocks, forex traders looking for simple, effective signals
[fikira] MACD & RSI+Stoch + DivergencesThis is a new version of my "Divergences"
Compared to my "Divergences (Pivots)", this is calculated totally different
There are 3 options:
- MACD
- RSI
- Stoch RSI
Since this script is very heavy in calculation it is limited in time (= inspired from a script of "Che_Trader")
Also it uses "max_bars_back" (=1000)
For MACD and Stoch RSI there is a "custom Divergences Period", which compares more then 7 Pivot Points,
the higher the number, the less reliable, it is not necessary to use this, but it is there,
also you can change the "leftbars" and "rightbars", again, it is not necessary to change, but you can...
Linewidth and style of the Divergences lines can be changed
Thank you!

[astropark] MACD & RSI+//******************************************************************************
// Copyright by astropark v2.0
// MACD RSI+
// 24/10/2018 Added RSI with Center line to have clear glue of current trend
// 10/12/2018 Added MACD
// 13/12/2018 Added multiplier for MACD in order to make it clearly visible over RSI graph
//******************************************************************************

TVMC - Composite Indicator with Technical RatingsDescription:
The TVMC (Trend, Volume, Momentum, Composite) indicator is a powerful multi-component tool designed to provide traders with a comprehensive understanding of market conditions. By combining four essential technical analysis components—trend, momentum, volume, and volatility—this indicator offers clear and actionable insights to assist in decision-making.
Key Features:
1. Trend Component (TC):
* Based on MACD (Moving Average Convergence Divergence), this component analyzes the relationship between two exponential moving averages (fast and slow) to determine the prevailing market trend.
* The MACD signal is normalized to a range of -1 to +1 for consistency and clarity.
2. Momentum Component (MC):
* Utilizes RSI (Relative Strength Index) to measure the strength and speed of price movements.
* This component highlights overbought or oversold conditions, which may indicate potential market reversals.
3. Volume Confirmation (VC):
* Compares the current trading volume to its moving average over a specified period.
* High volume relative to the average confirms the validity of the current trend.
4. Volatility Filter (VF):
* Uses ATR (Average True Range) to gauge market volatility.
* Adjusts and smooths signals to reduce noise during periods of high volatility.
5. Technical Ratings Integration:
* Incorporates TradingView’s Technical Ratings, allowing users to validate signals using moving averages, oscillators, or a combination of both.
* Users can choose their preferred source of ratings for enhanced signal confirmation.
How It Works:
The TVMC indicator combines the weighted contributions of the Trend, Momentum, and Volume components, further refined by the Volatility Filter. Each component plays a specific role:
* Trend: Identifies whether the market is bullish, bearish, or neutral.
* Momentum: Highlights the strength of price action.
* Volume: Confirms whether the current price action is supported by sufficient trading activity.
* Volatility: Filters out excessive noise in volatile market conditions, providing a smoother and more reliable output.
Visualization:
1. Bullish Signals:
* The indicator line turns green and remains above the zero line, indicating upward momentum.
2. Bearish Signals:
* The indicator line turns red and falls below the zero line, signaling downward momentum.
3. Neutral Signals:
* The line is orange and stays near zero, indicating a lack of strong trend or momentum.
4. Zones:
* Horizontal lines at +30 and -30 mark strong bullish and bearish zones, respectively.
* A zero line is included for clear separation between bullish and bearish signals.
Recommended Usage:
* Best Timeframes: The indicator is optimized for higher timeframes such as 4-hour (H4) and daily (D1) charts.
* Trading Style: Suitable for swing and positional trading.
* Customization: The indicator allows users to adjust all major parameters (e.g., MACD, RSI, volume, and ATR settings) to fit their trading preferences.
Customization Options:
* Adjustable weights for Trend, Momentum, and Volume components.
* Fully configurable settings for MACD, RSI, Volume SMA, and ATR periods.
* Timeframe selection for multi-timeframe analysis.
Important Notes:
1. Originality: The TVMC indicator combines multiple analysis methods into a unique framework. It does not replicate or minimally modify existing indicators.
2. Transparency: The description is detailed enough for users to understand the methodology without requiring access to the code.
3. Clarity: The indicator is explained in a way that is accessible even to users unfamiliar with complex technical analysis tools.
Compliance with TradingView Rules:
* The indicator is written in Pine Script version 5, adhering to TradingView’s language standards.
* The description is written in English to ensure accessibility to the global community, with a clear explanation of all components and functionality.
* No promotional content, links, or unrelated references are included.
* The chart accompanying the indicator is clean and demonstrates its intended use clearly, with no additional indicators unless explicitly explained.

Divergence Signal [TradingFinder] RSI & MACD Reversal On Swing🔵 Introduction
Sometimes in analyzing price charts using indicators, you may observe a discrepancy. For instance, while the price of stocks, currencies, or commodities is increasing, the indicator shows a decrease. Such a phenomenon in technical analysis is termed "divergence." Divergences are categorized into three types based on their formation and the prediction they make about the continuation of the price trend: "Regular Divergence," "Hidden Divergence," and "Time Divergence."
🟣 Important :
• This indicator exclusively identifies regular divergences since its primary function is to detect reversal points.
• This indicator identifies divergences using three indicators: "Moving Average Convergence Divergence" (MACD), "Relative Strength Index" (RSI), and "Awesome Oscillator" (AO). The user can choose each of these indicators in the settings using the "Divergence Detection Method" dropdown menu for identifying divergences. These settings are by default set to the MACD mode.
🔵Types of Divergence
Divergences, as mentioned, offer different predictions about the continuation of price trends. Hence, they have various types. We will focus on explaining regular divergences based on this indicator.
🟣 Regular Divergence(RD) :
Regular divergence is a situation arising from contradictory behavior between the indicator and the price chart at the end of a trend. By identifying regular divergences, we anticipate a change in trend direction resembling a reversal pattern.
Regular divergence has two types based on the trend and prediction:
Negative Regular Divergence (RD-) :
This type occurs between two price peaks at the end of an uptrend. Despite forming a new high, the indicator fails to recognize it, indicating a negative regular divergence. The likelihood of a subsequent downtrend is high. Negative divergence suggests strong selling pressure and weak buying power, portraying an unfavorable future for the stock.
Positive Regular Divergence (RD+) :
In contrast, positive regular divergence happens at the end of a downtrend and between two price troughs. As depicted in the chart, although the price forms a new low, the indicator doesn't acknowledge it. Positive regular divergence indicates robust buying pressure and weak selling power. Upon identifying positive divergence in the chart, we expect a price increase for the stock under review
🔵 How to Use
Information from the indicator is displayed in two ways: Table and Label.
🟣 Table : The table displays information about the latest divergence. This includes the type of divergence, existence or absence of divergence, consecutive divergences, divergence quality, and change in indicator phase.
Type Divergence : Indicates the type of divergence, which can be either "Bullish Divergence" or "Bearish Divergence."
Exist : Indicates the presence of divergence with a "+" sign and absence with a "-" sign. A green color is used for bullish divergence and red for bearish divergence.
Consecutive : Shows the number of consecutive divergences. For example, if there are 3 consecutive divergences, the number 3 is displayed.
Divergence Quality : Displays the quality of the divergence based on the number of consecutive divergences. If there is 1 divergence, the quality is "Normal"; for 2 divergences, it's "Good"; and for 3 or more divergences, it's "Strong."
Change Phase Indicator : Indicates whether a phase change in the indicator has occurred with "+" for yes and "-" for no.
🟣 Label : Unlike the table, which only shows information about the latest divergence, labels display information about each divergence at the point where it occurs. The information includes the type of divergence, detection method, divergence quality, consecutive divergences, and change in phase indicator. The selected method of detection is also displayed. For example, if the chosen method is the "AO" indicator, the label will show "Method: AO."
🔵 Settings
Fractal Period : Determines the period of swings. The minimum and default value is 2.
Divergence Detect Method : Selects the indicator (MACD, RSI, or AO) used for detecting divergences. The default indicator is MACD.
Show Fractal : Chooses whether to display fractals or not. The default is "No."
Show Table : Determines whether to display the table or not. The default is "Yes."
Show Label : Chooses whether to display labels or not. The default is "Yes."
Label Size : Adjusts the size of the labels from "Tiny" to "Large."

Stochastic MTF IICombines Stochastics, RSI and MACD Histogram to give a complete picture of the momentum.
The main two lines are stochastics from the higher time frame(current time frame* 4).
The red columns are stochastic of macd histogram.
The green histogram is the stochastic rsi of price.
The dots at 50 line is the correlation between price and macd+rsi combo.

Full strategy AllinOne with risk management MACD RSI PSAR ATR MAHey, I am glad to present you one of the strategies where I put a lot of time in it.
This strategy can be adapted to all type of timecharts like scalping, daytrading or swing.
The context is the next one :
First we have the ATR to calculate our TP/SL points. At the same time we have another rule once we enter(we enter based on % risk from total equity, in this example 1%, at the same time, lowest ammount for this example is 0.1 lots, but can be modified to 0.01), so we can exit both by tp/sl points, or by losing 1% of our equity or winning 1% of our total equity. It's dinamic.
The strategy is made from
Trend direction :
PSAR
First confirmation point :
Crossover between 10EMA and Bollinger bands middle point
Second confirmation
MACD histogram
Third confirmation
RSI overbought/oversold levels
For entries : we check trend with psar, then once ema cross bb middle point, we confirm together with rsi level for overbought/oversold and macd histogram ( > 0 or <0).
We exit, when we have opposite sign, like from buy to sell or sell to buy, or when we reach tp/sl points, or when we reach % basaed equity points.
It can be changed to be fixed lots, or fixed tp/sl , you just have to uncomment the size from entries, and tp/sl lines.
At the same time, it has the possibility if one desires, to trade only concrete forex session like european, asian and so on for intraday trading.
Hope you enjoy it.
Let me know how it goes.

Easy to Use MACD+RSI Strategy
BEGINNERS REJOICE!
Easy to use strategy test using MACD with RSI as a confirming indicator. The code is structured to make it easy to manipulate the variables to your choosing.
EASY TO CHANGE CODE VARIABLES
LINE 2 = Change the amount you invest every trade and the currency
LINE 8/9/10 = Change the defval of each of these lines to backtest from a certain date
LINE 16/17/18 = Change the MACD sensitivity by changing the defval on each line
LINE 21 = Change the value after close toadjust the sensitivity of the RSI
LINE 37/39 = Change/remove the < and > variables for macdLine and rsivalue after the crossover/crossunder to adjust your buying point further.
As a beginner you may not feel comfortable with shorting stocks, therefore LINE 5 was added to only allows long positions.
Funny how a simple indicator can return such a high profitability. Couple this with some trend/exit strategies and you'll have something really special!
MACD and RSI divergence by Rexio v2Hi everyone!
I wrote this indicator for intraday trading and it cannot be use only by itself you need to at least draw some S/R lines to make it useful. It is based at MACD histogram and gives signal when it sees divergence on MACD/RSI/MACD's Histogram (or all at once - settings) when macd's histogram switchs trend. Im using it to playing with a trend most of the time looking for hidden divergence at higher time frame and after that looking for regular divergence at lower time frame.
Im not a computer programist nor professional trader so it is only for educational purposes only.

Powerfull strategy MACD+RSI+STOCH ATR stop best on Crude OilMy strategy uses a combination of three indicators MACD Stochastic RSI .
The Idea is to buy when ( MACD > Signal and RSI > 50 and Stochastic > 50) occures at the same time the BUY STop we place on previous day HIGH
and sell (short) when the opposite condition occurs we place SELL STOP on previous day LOW
We exit on Take profit or Stop loss which is calculated by ATR (10) or on the opposite signal "Volatility breakout"
This strategy works well on stocks, commodities and cryptos especially during market breaking up after consolidation
The best results are on Daily charts , so its NOT a scalping strategy. But it can work also on 1H charts.
The strategy does not have any stops and profit targets, so we can take all the market can give us at the moment.
The exit point only when MACD goes under Signal
Its Preformance is significantly better with "buy stop on High.1 and sell stop on Low.1" idea and exit on "volatility price breakout"
So, use it, trade it.
If it will help you to imprive your trading results, please donate me
BTC: 12kd1F8buWisUBdq27BBwRkUvzW7Ey3og

Powerfull strategy MACD + RSI + Stoch buy on High exit on ATRMy strategy uses a combination of three indicators MACD Stochastic RSI .
The Idea is to buy when ( MACD > Signal and RSI > 50 and Stochastic > 50) occures at the same time the BUY STop we place on previous day HIGH
We exit on Take profit or Stop loss which is calculated by ATR (10) or on the opposite signal "Volatility breakout"
This strategy works well on stocks, commodities and cryptos especially during market breaking up after consolidation
The best results are on Daily charts , so its NOT a scalping strategy. But it can work also on 1H charts.
The strategy does not have any stops and profit targets, so we can take all the market can give us at the moment.
The exit point only when MACD goes under Signal
Its Preformance is significantly better with "buy stop on High.1" idea and exit on "volatility price breakout"
So, use it, trade it.
If it will help you to imprive your trading results, please donate me
BTC: 12kd1F8buWisUBdq27BBwRkUvzW7Ey3og5

EMA + MACD + RSI Strategy"This strategy combines EMA crossovers (20/50), MACD momentum (12/26/9), and RSI thresholds (14-period) to generate signals. It triggers a BUY when:
EMA20 crosses above EMA50,
MACD line > Signal line,
RSI > 50.
SELL signals activate on the opposite conditions. Visual alerts plot directly on the chart

RSI + MACD Combo (sajadbagheri)The "RSI+MACD Persian Combo" integrates two classic oscillators with smart normalization. It detects overbought/oversold zones, MACD/RSI convergences, and highlights high-probability reversals using Z-Score scaling. Customizable alerts provide trade-ready signals.
Created by: Sajad Bagheri

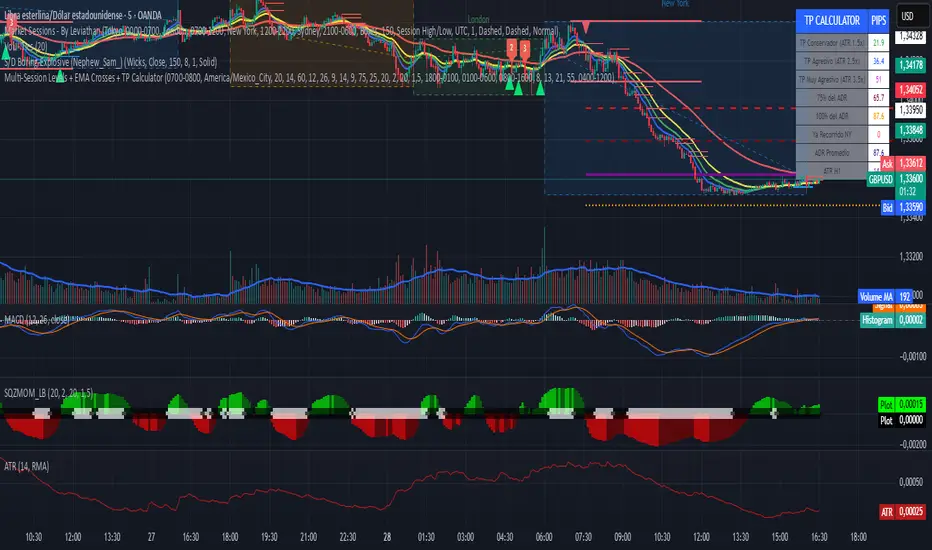
Multi-Session Levels + EMA Crosses + TP Calculator (GBP/USD)# Multi-Session Levels + EMA Crosses + TP Calculator
## 📋 Description
**Advanced trading indicator combining multi-session analysis, EMA cross validation, and automated Take Profit calculations for Forex markets.**
This comprehensive tool integrates session-based level analysis with validated EMA crossovers and intelligent TP calculations, designed specifically for serious traders who need precise entry signals with calculated exit strategies.
## 🎯 Key Features
### 📊 **Multi-Session Analysis**
- **Asian Session (6PM-1AM Mexico)**: Generates key support/resistance levels
- **London Session (1AM-6AM Mexico)**: Analyzes manipulation patterns
- **New York Session (8AM-4PM Mexico)**: Dynamic levels with trend confirmation
- **AMD Setup Detection**: Combines all sessions for high-probability setups
### 📈 **Advanced EMA System**
- **4 EMAs**: 8, 13, 21, and 55 periods with visual display
- **Validated Crossovers**: EMA 8 vs EMA 13 with multiple confirmations
- **Smart Filtering**: Only shows signals during optimal trading hours (6AM-12PM Mexico)
### ✅ **Triple Validation System**
- **MACD Confirmation**: Histogram strength + signal line position + momentum direction
- **RSI Filter**: Overbought/oversold levels with moving average confirmation
- **Squeeze Momentum**: Bollinger Bands vs Keltner Channels compression detection
### 💰 **Intelligent TP Calculator**
- **ADR-Based Targets**: Uses Average Daily Range for realistic profit expectations
- **ATR Multipliers**: Conservative (1.5x), Aggressive (2.5x), Very Aggressive (3.5x)
- **Session-Aware**: Considers already-traveled distance in NY session
- **Real-Time Table**: Live pip calculations for all TP levels
- **Visual Levels**: Automatic TP lines drawn on chart with color coding
### 🚨 **Smart Alert System**
- **Validated Signals Only**: Alerts trigger only when ALL confirmations align
- **TP Integration**: Alerts include suggested take profit levels
- **Non-Validated Tracking**: Shows basic crosses that don't meet full criteria
## 📐 **Technical Calculations**
### **ADR (Average Daily Range)**
- 20-period average of daily high-low ranges
- Converted to pips for easy interpretation
- Used for percentage-based TP targets (50%, 75%, 100% of ADR)
### **ATR (Average True Range)**
- 14-period ATR from H1 timeframe (configurable)
- Accounts for gaps and volatility
- Base for multiplier-based TP levels
### **Session Tracking**
- Real-time monitoring of NY session range
- Calculates remaining potential movement
- Optimizes TP placement based on session progress
## 🎨 **Visual Elements**
### **Chart Levels**
- **Orange Lines**: Asian and London session levels
- **White/Green/Red Lines**: NY session levels (color changes with trend direction)
- **TP Lines**: Color-coded take profit levels with different styles
### **EMA Display**
- **Blue**: EMA 8 (fastest)
- **Green**: EMA 13 (signal line)
- **Yellow**: EMA 21 (trend filter)
- **Red**: EMA 55 (major trend)
### **Signal Shapes**
- **Bright Triangles**: Fully validated signals
- **Faded Triangles**: Non-validated basic crosses
- **Size Variation**: Signal strength indication
## 📊 **Information Table**
Real-time display showing:
- **TP Levels**: All calculated take profit targets in pips
- **Session Data**: NY range already traveled vs average
- **Volatility Metrics**: Current ATR and ADR values
- **Clean Design**: Easy-to-read format with color coding
## ⚙️ **Customization Options**
### **Session Times**
- Fully configurable session times
- Mexico City timezone support
- Enable/disable individual session analysis
### **Validation Controls**
- Toggle MACD, RSI, Squeeze validation independently
- Adjust RSI overbought/oversold levels
- Customize MACD and Squeeze parameters
### **Display Options**
- Show/hide EMAs, crosses, TP levels, table
- Customize TP calculation periods (ADR, ATR)
- Choose ATR timeframe for calculations
## 🎯 **Ideal For**
- **Forex Day Traders**: Especially USD pairs during NY session
- **Session-Based Strategies**: Traders who respect market sessions
- **Risk Management Focus**: Those who need calculated exit strategies
- **Multi-Timeframe Analysis**: Traders using H1-H4 charts
## 📈 **Best Practices**
1. **Use during high-volume sessions** (London-NY overlap)
2. **Wait for full validation** before entering trades
3. **Consider session context** when setting TPs
4. **Combine with proper risk management** (1-2% per trade)
5. **Backtest thoroughly** before live trading
## ⚠️ **Important Notes**
- **Signals work best** during trending market conditions
- **AMD setups** provide highest probability entries
- **TP levels are suggestions** - adjust based on market context
- **Always use stop losses** (not included in this indicator)
- **Designed for Forex markets** - may need adjustment for other instruments
---
*This indicator combines proven technical analysis concepts with modern session-based trading approaches, providing both entry timing and exit planning in one comprehensive tool.*
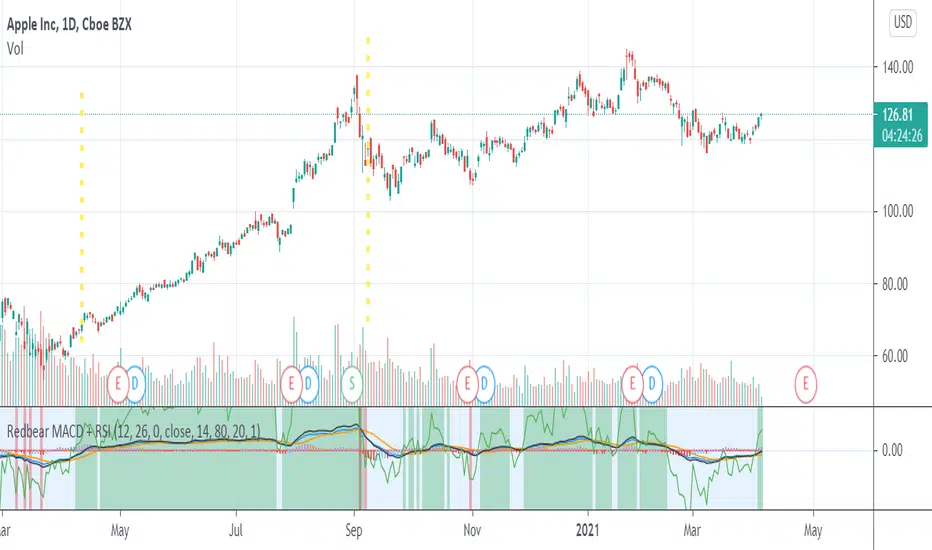
Redbear MACD + RSIHello . I make script that combine MACD and RSI
Green area is BUY SELL signal when rsi >45
you can custom parameter .
SCTI - D14SCTI - D14 Comprehensive Technical Analysis Suite
English Description
SCTI D14 is an advanced multi-component technical analysis indicator designed for professional traders and analysts. This comprehensive suite combines multiple analytical tools into a single, powerful indicator that provides deep market insights across various timeframes and methodologies.
Core Components:
1. EMA System (Exponential Moving Averages)
13 customizable EMA lines with periods ranging from 8 to 2584
Fibonacci-based periods (8, 13, 21, 34, 55, 89, 144, 233, 377, 610, 987, 1597, 2584)
Color-coded visualization for easy trend identification
Individual toggle controls for each EMA line
2. TFMA (Multi-Timeframe Moving Averages)
Cross-timeframe analysis with 3 independent EMA calculations
Real-time labels showing trend direction and price relationships
Customizable timeframes for each moving average
Percentage deviation display from current price
3. PMA (Precision Moving Average Cloud)
7-layer moving average system with customizable periods
Fill areas between moving averages for trend visualization
Support and resistance zone identification
Dynamic color-coded trend clouds
4. VWAP (Volume Weighted Average Price)
Multiple anchor points (Session, Week, Month, Quarter, Year, Earnings, Dividends, Splits)
Standard deviation bands for volatility analysis
Automatic session detection and anchoring
Statistical price level identification
5. Advanced Divergence Detector
12 technical indicators for divergence analysis (MACD, RSI, Stochastic, CCI, Williams %R, Bias, Momentum, OBV, VW-MACD, CMF, MFI, External)
Regular and hidden divergences detection
Bullish and bearish signals with visual confirmation
Customizable sensitivity and filtering options
Real-time alerts for divergence formations
6. Volume Profile & Node Analysis
Comprehensive volume distribution analysis
Point of Control (POC) identification
Value Area High/Low (VAH/VAL) calculations
Volume peaks and troughs detection
Support and resistance levels based on volume
7. Smart Money Concepts
Market structure analysis with Break of Structure (BOS) and Change of Character (CHoCH)
Internal and swing structure detection
Equal highs and lows identification
Fair Value Gaps (FVG) detection and visualization
Liquidity zones and institutional flow analysis
8. Trading Sessions
9 major trading sessions (Asia, Sydney, Tokyo, Shanghai, Hong Kong, Europe, London, New York, NYSE)
Real-time session status and countdown timers
Session volume and performance tracking
Customizable session boxes and labels
Statistical session analysis table
Key Features:
Modular Design: Enable/disable any component independently
Real-time Analysis: Live updates with market data
Multi-timeframe Support: Works across all chart timeframes
Customizable Alerts: Set alerts for any detected pattern or signal
Professional Visualization: Clean, organized display with customizable colors
Performance Optimized: Efficient code for smooth chart performance
Use Cases:
Trend Analysis: Identify market direction using multiple EMA systems
Entry/Exit Points: Use divergences and structure breaks for timing
Risk Management: Utilize volume profiles and session analysis for better positioning
Multi-timeframe Analysis: Confirm signals across different timeframes
Institutional Analysis: Track smart money flows and market structure
Perfect For:
Day traders seeking comprehensive market analysis
Swing traders needing multi-timeframe confirmation
Professional analysts requiring detailed market structure insights
Algorithmic traders looking for systematic signal generation
---
中文描述
SCTI - D14是一个先进的多组件技术分析指标,专为专业交易者和分析师设计。这个综合套件将多种分析工具整合到一个强大的指标中,在各种时间框架和方法论中提供深度市场洞察。
核心组件:
1. EMA系统(指数移动平均线)
13条可定制EMA线,周期从8到2584
基于斐波那契的周期(8, 13, 21, 34, 55, 89, 144, 233, 377, 610, 987, 1597, 2584)
颜色编码可视化,便于趋势识别
每条EMA线的独立切换控制
2. TFMA(多时间框架移动平均线)
跨时间框架分析,包含3个独立的EMA计算
实时标签显示趋势方向和价格关系
每个移动平均线的可定制时间框架
显示与当前价格的百分比偏差
3. PMA(精密移动平均云)
7层移动平均系统,周期可定制
移动平均线间填充区域用于趋势可视化
支撑阻力区域识别
动态颜色编码趋势云
4. VWAP(成交量加权平均价格)
多个锚点(交易时段、周、月、季、年、财报、分红、拆股)
标准差带用于波动性分析
自动时段检测和锚定
统计价格水平识别
5. 高级背离检测器
12个技术指标用于背离分析(MACD、RSI、随机指标、CCI、威廉姆斯%R、Bias、动量、OBV、VW-MACD、CMF、MFI、外部指标)
常规和隐藏背离检测
看涨看跌信号配视觉确认
可定制敏感度和过滤选项
背离形成的实时警报
6. 成交量分布与节点分析
全面的成交量分布分析
控制点(POC)识别
价值区域高/低点(VAH/VAL)计算
成交量峰值和低谷检测
基于成交量的支撑阻力水平
7. 聪明钱概念
市场结构分析,包括结构突破(BOS)和结构转变(CHoCH)
内部和摆动结构检测
等高等低识别
公允价值缺口(FVG)检测和可视化
流动性区域和机构资金流分析
8. 交易时区
9个主要交易时段(亚洲、悉尼、东京、上海、香港、欧洲、伦敦、纽约、纽交所)
实时时段状态和倒计时器
时段成交量和表现跟踪
可定制时段框和标签
统计时段分析表格
主要特性:
模块化设计:可独立启用/禁用任何组件
实时分析:随市场数据实时更新
多时间框架支持:适用于所有图表时间框架
可定制警报:为任何检测到的模式或信号设置警报
专业可视化:清洁、有序的显示界面,颜色可定制
性能优化:高效代码确保图表流畅运行
使用场景:
趋势分析:使用多重EMA系统识别市场方向
入场/出场点:利用背离和结构突破进行时机选择
风险管理:利用成交量分布和时段分析进行更好定位
多时间框架分析:在不同时间框架间确认信号
机构分析:跟踪聪明钱流向和市场结构
适用于:
寻求全面市场分析的日内交易者
需要多时间框架确认的摆动交易者
需要详细市场结构洞察的专业分析师
寻求系统化信号生成的算法交易者
