Price Action ZigZag (Impulses & Corrections)This indicator tracks price structure by connecting significant swing highs and lows—giving a clear, actionable “ZigZag” view of market movement. It automatically maps the underlying price action as alternating impulses (trend legs) and corrections (pullbacks), directly on your chart, for any timeframe.
How does it work?
Swing Detection:
The script uses the user-selected “pivot length” to identify confirmed swing highs and lows with Pine Script’s ta.pivothigh and ta.pivotlow.
These pivots only print after full confirmation, making all lines strictly non-repainting.
ZigZag Drawing:
After pivots are captured, the indicator connects each alternating swing with lines that trace the progression of price structure.
Each line segment is mapped according to the sequence and direction of swings:
Impulse: Moves that break further away from prior swing in the same direction (continuations/uptrends/downtrends)
Correction: Moves that pull price back, but do not extend past the previous impulse (retracements/sideways action)
Impulse vs Correction Logic:
Bullish impulse: swing from a higher low to a higher high (fast upward moves after a low)
Bearish impulse: swing from a lower high to a lower low (fast downward moves after a high)
Corrections appear as smaller lines between alternating swing points not leading to new trend extension.
Labels & Colors:
Impulse lines are drawn teal (customizable), corrections in gray.
Tiny labels ("Impulse", "Correction") are shown for clarity (optional).
Most recent pivots are highlighted with yellow dots for quick visual reference.
Key Features:
User-adjustable pivot length controls sensitivity and structure size (scalp to swing).
Distinguishes between impulses and corrections instantly on the chart.
Labels and color coding for clarity—traders can spot trend continuation vs. pullback at a glance.
Non-repainting confirmed pivots and lines; never show incomplete data.
Fully customizable appearance—all colors and label display adjustable in settings.
Zero lookahead or repainting: all signals use confirmed, historical price only.
How to use:
Add to any chart and set 'Swing Length' to fit your trading style (shorter for scalping, longer for bigger structure).
Follow the ZigZag lines to see when price makes an impulse vs. correction, and use this to identify high-probability momentum or reversal zones.
Combine this script with your own analysis/strategy or other indicators for deeper context.
Adjust colors and label options for your preferred chart clarity.
Disclaimer:
This script is a visualization and analysis tool for educational purposes—it does not predict future price movement, guarantee results, or provide trading signals. Always use sound risk management and your own judgment in live trading.
在腳本中搜尋"采列VS新圣徒"

Moving Average Ribbon (10x, per-MA timeframe)A flexible moving‑average ribbon that plots up to 10 MAs, each with its own type, length, source, color, and independent timeframe selector for true multi‑timeframe analysis without repainting on higher‑timeframe pulls.
What it does
Plots ten moving averages with selectable types: SMA, EMA, SMMA (RMA), WMA, and VWMA.
Allows per‑line timeframe inputs (e.g., 5, 15, 60, 1D, 1W) so you can overlay higher‑ or equal‑timeframe MAs on the current chart.
Uses a non‑repainting request pattern for higher‑timeframe series to keep lines stable in realtime.
How to use
Leave a TF field blank to keep that MA on the chart’s timeframe; type a timeframe (like 15 or 1D) to fetch it from another timeframe.
Typical trend‑following setup: fast MAs (10–21) on chart TF, mid/slow MAs (34–200) from higher TFs for bias and dynamic support/resistance.
Color‑code faster vs slower lines and optionally hide lines you don’t need to reduce clutter.
Best practices
Prefer pulling equal or higher timeframes for stability; mixing lower TFs into a higher‑TF chart can create choppy visuals.
Combine with price action and volume/volatility tools (e.g., RSI, Bollinger Bands) for confirmation rather than standalone signals.
Showcase example charts in your publish post and explain default settings so users know how to interpret the ribbon.
Inputs
Show/Hide per MA, Type (SMA/EMA/SMMA/WMA/VWMA), Source, Length, Color, Timeframe.
Defaults cover common lengths (10/20/50/100/200 etc.) and can be customized to fit intraday or swing styles.
Limitations
This is an analysis overlay, not a signal generator; it doesn’t place trades or alerts by default.
Effectiveness depends on instrument liquidity and user configuration; avoid overfitting to one market or regime.
Attribution and etiquette
Provide a brief explanation of your calculation choices and note that MA formulas are standard; credit any borrowed concepts or snippets if used.

ATR Channel (Bottom & Top)The ATR Channel (Bottom & Top) indicator dynamically visualizes market volatility zones based on the Average True Range (ATR). It automatically builds adaptive upper and lower boundaries around the current price, helping traders identify potential market extremes, volatility-driven reversals, and dynamic support/resistance levels.
This version is specifically optimized for Bitcoin (BTCUSDT) but works with any asset or timeframe.
⚙️ How It Works
The indicator calculates ATR over a user-defined period (default 200) and applies separate multipliers for the top and bottom bands (default ×1).
The Top Band = Close + (ATR × Multiplier)
The Bottom Band = Close - (ATR × Multiplier)
These two adaptive bands create a volatility envelope, allowing traders to visualize where the price may encounter potential exhaustion or reversal zones.
💡 Signal Logic
LONG Signal (Green Tab):
Triggered when the low of the candle touches or dips below the ATR bottom line — suggesting a possible oversold or volatility-based bottoming area.
The label displays the exact ATR line value (not the close), formatted for better readability (e.g. “LONG\n103 885”).
SELL Signal (Red Tab):
Triggered when the high of the candle touches or exceeds the ATR top line — signaling possible overbought conditions or an exhaustion zone.
Signal Filtering:
The script intelligently avoids duplicate signals — e.g., multiple consecutive LONGs or SELLs will not appear until the opposite signal is triggered.
This ensures cleaner visualization and reduces signal noise during consolidation periods.
🎯 Features
✅ Adaptive ATR-based volatility channel
✅ Automatic LONG/SELL signal labeling with real ATR-touch prices
✅ Customizable parameters:
✅ Intelligent filtering (one signal per phase)
✅ Works on any market and timeframe (crypto, forex, indices, stocks)
🧭 Trading Applications
Identify volatility extremes (ATR-based overbought/oversold zones)
Detect reversal points or exhaustion moves after extended trends
Use with trend filters (e.g. EMA200) to confirm trend continuation vs mean reversion setups
Combine with oscillators (RSI, Stoch) for confluence signals
📊 Summary
The ATR Channel (Bottom & Top) provides a clear, professional-grade visualization of volatility dynamics and price extremes.
It is especially useful for traders using mean-reversion, volatility breakout, or swing-trading strategies — helping them identify statistically significant reaction zones and improving trade timing precision.

VWAP – Pivot Pairs (SECONDS‑BASED RESET)VWAP – Pivot Pairs (SECONDS-BASED RESET) is a Pine Script v6 indicator for TradingView that combines pivot-based breakout detection with resettable VWAP (Volume Weighted Average Price) calculations over user-defined rolling time periods in seconds.It identifies high and low swing pivots via breakout logic, then calculates two VWAP lines per anchor:One using high/low as the price source,
One using close as the price source.
These form "pivot pairs" that reset automatically at the start of each custom-duration period (e.g., every 300 seconds), starting from a user-defined UTC time of day (default: 09:30 UTC).Visuals include:Colored VWAP lines (high pair: red, low pair: green),
Semi-transparent fill zones between each pair,
Optional toggles to show/hide high or low pairs.
Use CasesUse Case
Description
Intraday Scalping (1–15 min charts)
Use 60–300 second resets to capture micro-trends within larger sessions. VWAP pairs act as dynamic support/resistance after breakouts.
High-Frequency / Algo Validation
Backtest strategies on tick/second charts where traditional session resets fail. Align resets with exchange micro-sessions or volatility windows.
Opening Range Breakout (ORB) Enhancement
Set period_seconds = 1800 (30 min) and start time = 09:30 UTC → VWAP builds only on first 30 mins post-open, then floats. Pairs show deviation from ORB mean.
Range-Bound Market Analysis
In choppy markets, VWAP pairs converge near fair value. Divergence signals potential breakout. Fill color intensity shows conviction.
Multi-Timeframe Confluence
Overlay on 1-second chart with 300s reset → matches 5-minute structure. Use close-based VWAP for entries, high/low-based for stops.
Key Features SummaryFeature
Function
period_seconds
Rolling window length in seconds (e.g., 300 = 5 min)
period_start_time
UTC time-of-day anchor (default: 09:30)
new_period logic
Triggers full reset of pivots + VWAP on exact second boundary
breakingHigher / breakingLower
Detects confirmed breakouts (not just close above high)
Dual VWAP per anchor
ta.vwap(high) and ta.vwap(close) for range-aware mean
Fill zones
Visual value area between high/close VWAPs
Toggle visibility
Independently show/hide high or low pivot pairs
How It Works – Step-by-StepTime Engine Converts user inputs → milliseconds
Calculates current period start time using integer division from epoch
Detects exact bar when new period begins (new_period = true)
On New Period Resets both high/low anchors to current bar’s h and l
Forces VWAP recalculation from this bar forward
Breakout Detection Only triggers on strong candles (rising/falling, non-doji)
Requires open/close beyond prior pivot → avoids wicks-only breaks
VWAP Accumulation ta.vwap(source, reset_condition) restarts when anchor resets
Two sources per side → shows where volume clustered (at highs vs closes)
Plotting Four lines + two fills
Clean, customizable, overlay-friendly
Pro TipsUse on Heikin Ashi for smoother breakout signals.
Combine with volume profile to validate VWAP clusters.
For crypto, set period_start_time = 0 (00:00 UTC) for clean 4-hour resets.
Add alerts on new_period or breakingHigher for automation.
In short: This is a precision VWAP tool for time-boxed, pivot-driven mean reversion and breakout trading, ideal for scalpers, day traders, and algo developers needing sub-session granularity.

Aquantprice: Institutional Structure MatrixSETUP GUIDE
Open TradingView
Go to Indicators
Search: Aquantprice: Institutional Structure Matrix
Click Add to Chart
Customize:
Min Buy = 10, Min Sell = 7
Show only PP, R1, S1, TC, BC
Set Decimals = 5 (Forex) or 8 (Crypto)
USE CASES & TRADING STRATEGIES
1. CPR Confluence Trading (Most Popular)
Rule: Enter when ≥3 timeframes show Buy ≥10/15 or Sell ≥7/13
text Example:
Daily: 12/15 Buy
Weekly: 11/15 Buy
Monthly: 10/15 Buy
→ **STRONG LONG BIAS**
Enter on pullback to nearest **S1 or L3**
2. Hot Zone Scalping (Forex & Indices)
Rule: Trade only when price is in Hot Zone (closest 2 levels)
text Hot: S1-PP → Expect bounce or breakout
Action:
- Buy at S1 if Buy Count ↑
- Sell at PP if Sell Count ↑
3. Institutional Reversal Setup
Rule: Price at H3/L3 + Reversal Condition
text Scenario:
Price touches **Monthly L3**
L3 in **Hot Zone**
Buy Count = 13/15
→ **High-Probability Reversal Long**
4. CPR Width Filter (Avoid Choppy Markets)
Rule: Trade only if CPR Label = "Strong Trend"
text CPR Size < 0.25 → Trending
CPR Size > 0.75 → Sideways (Avoid)
5. Multi-Timeframe Bias Dashboard
Use "Buy" and "Sell" columns as a sentiment meter
TimeframeBuySellBiasDaily123BullishWeekly89BearishMonthly112Bullish
→ Wait for alignment before entering
HOW TO READ THE TABLE
Column Meaning Time frame D, W, M, 3M, 6M, 12MOpen Price Current session open PP, TC, BC, etc. Pivot levels (color-coded if in Hot Zone) Buy X/15 conditions met (≥10 = Strong Buy)Sell X/13 conditions met (≥7 = Strong Sell)CPR Size Histogram + Label (Trend vs Range)Zone Hot: PP-S1, Med: S2-L3, etc. + PP Distance
PRO TIPS
Best on 5M–1H charts for entries
Use with volume or order flow for confirmation
Set alerts on Buy ≥12/15 or Sell ≥10/13
Hide unused levels to reduce clutter
Combine with AQuantPrice Dashboard (Small TF) for full system
IDEAL MARKETS
Forex (EURUSD, GBPUSD, USDJPY)
Indices (NAS100, SPX500, DAX)
Crypto (BTC, ETH – use 6–8 decimals)
Commodities (Gold, Oil)
🚀 **NEW INDICATOR ALERT**
**Aquantprice: Institutional Structure Matrix**
The **ALL-IN-ONE CPR Dashboard** used by smart money traders.
✅ **6 Timeframes in 1 Table** (Daily → Yearly)
✅ **15 Buy + 13 Sell Conditions** (Institutional Logic)
✅ **Hot Zones, CPR Width, PP Distance**
✅ **Fully Customizable – Show/Hide Any Level**
✅ **Real-Time Zone Detection** (Hot, Med, Low)
✅ **Precision up to 8 Decimals**
**No more switching charts. No more confusion.**
See **where institutions are positioned** — instantly.
👉 **Add to Chart Now**: Search **"Aquantprice: Institutional Structure Matrix"**
🔥 **Free Access | Pro-Level Insights**
*By AQuant – Trusted by 10,000+ Traders*
#CPR #PivotTrading #SmartMoney #TradingView
FINAL TAGLINE
"See What Institutions See — Before They Move."
Aquantprice: Institutional Structure Matrix
Your Edge. One Dashboard.

Dual EMA Status Table (15m & 30m)It checks whether the 9 EMA is above or below the 21 EMA on:
the 15-minute chart, and
the 30-minute chart,
and then displays their alignment in a table:
Timeframe 9 vs 21 Status
15 min 9 > 21 Bullish
30 min 9 > 21 Bullish
CONFIRM ✅ Bullish
✅ “Bullish Confirm” → 9 EMA > 21 EMA on both → uptrend bias
❌ “Bearish Confirm” → 9 EMA < 21 EMA on both → downtrend bias
⚠️ “Mixed” → 15 m and 30 m disagree → stay neutral or wait
💡 How to Use It as a Trading Signal
You can treat it as a buy/sell framework with confirmation rules:
🔹 Buy (Long) bias
Table shows ✅ Bullish confirmation
9 EMA > 21 EMA on both timeframes
Ideally, price pulls back near one of the EMAs and then bounces
You could enter after a bullish candle close above the EMAs
📍 Example entry rule:
Enter long when “✅ Bullish” appears and price closes above both EMAs on the 15 min chart.
Stop-loss below the 21 EMA or recent swing low.
🔹 Sell (Short) bias
Table shows ❌ Bearish confirmation
9 EMA < 21 EMA on both timeframes
Price retraces upward and rejects near EMAs
📍 Example entry rule:
Enter short when “❌ Bearish” appears and price closes below both EMAs on the 15 min chart.
Stop-loss above 21 EMA or recent swing high.

Put Option Profits inspired by Travis Wilkerson; SPX BacktesterPut Option Profits — Travis Wilkerson inspired. This tester evaluates a simple monthly SPX at-the-money credit-spread timing idea: enter on a fixed calendar rule (e.g., 1st Friday or 8th day with business-day shifting) at Open or Close, then exit exactly N calendar days later (first tradable day >= target, at Close). A trade is marked WIN if price at exit is above the entry price (1:1 risk proxy).
The book suggests forward testing 60-day and 180-day expirations to prove the concept. This tool lets you backtest both (and more) to see what actually works best. In the book, profits are taken when the spread reaches ~80% of max credit; losers are left to expire and cash-settle. This backtester does not model early profit-taking—every trade is held to the configured hold period and evaluated on price vs entry at the exit close. Think of it as a pure “set it and forget it” stress test. In live trading, you can still follow Travis’s 80% take-profit rule; TradingView just doesn’t simulate that here. Happy trading!
Features:
Schedule: Day-of-Month (with Prev/Next business-day shift, optional “stay in month”) or Nth Weekday (e.g., 1st Friday).
Entry timing: Open or Close.
Exit: N calendar days later at Close (holiday/weekend aware).
Filters: Optional EMA-200 “risk-on” filter.
Scope: Date range limiter.
Visuals: Entry/exit bubbles (paired colors) or simple win/loss dots.
Table: Overall Win% and N (within range).
Alerts: Entry alert (static condition + dynamic alert() message).
How to use:
[* ]Choose Start Mode (NthWeekday or DayOfMonth) and parameters (e.g., 1st Friday or DOM=8, PrevBizDay).
Pick Entry Timing (Open or Close).
Set Days In Trade (e.g., 150).
(Optional) Enable EMA filter and set Date Range.
Turn Bubbles on/off and/or Dots on/off.
Create alert:
Simple ping: Condition = this indicator -> Monthly Entry Signal -> “Once per bar” (Open) or “Once per bar close” (Close).
Rich message: Condition = this indicator -> Any alert() function call.
Notes:
Keep DOM shift in same month: when a DOM falls on a weekend/holiday, PrevBizDay/NextBizDay shift will stay inside the month if enabled; otherwise it can spill into the prior/next month. (Ignored for NthWeekday.)
Credits: Concept sparked by “Put Option Profits – How to turn ten minutes of free time into consistent cash flow each month” by Travis Wilkerson; this script is a neutral research tool (not financial advice).

Momentum Squeeze Candle [Darwinian]# Momentum Squeeze Candle
Professional squeeze detection indicator with Wyckoff accumulation/distribution analysis and multi-method momentum signals.
## Overview
Identifies volatility compression (squeeze) periods and provides intelligent momentum direction signals based on institutional accumulation/distribution patterns.
## Features
6 Squeeze Detection Methods:
• BB + KC (Classic) - John Carter's TTM Squeeze
• ATR Ratio - Volatility compression detection
• Choppiness Index - Ranging vs trending analysis
• BB Width - Bollinger Band contraction
• Volume Contraction - Drying volume detection
• Hybrid Multi-Method - Ensemble approach (3+ methods must agree)
Smart Momentum Direction:
• Priority 1: Wyckoff signals (ATR compression + volume analysis)
• Priority 2: RSI momentum (55/45 thresholds)
• Priority 3: Hybrid slope + momentum confirmation
Visual Indicators:
• Blue candle coloring during squeeze
• Green circles = Bullish momentum (accumulation detected)
• Red circles = Bearish momentum (distribution detected)
• Optional BB/KC band overlay
## How It Works
Wyckoff Accumulation (Bullish):
ATR compressing + volume drying + price holding above MA = Smart money accumulating
→ Green circle signals
Wyckoff Distribution (Bearish):
ATR expanding + volume surging + price failing below MA = Smart money distributing
→ Red circle signals
## Recommended Settings
Swing Trading (Daily/4H):
Method: BB + KC or Hybrid | Sensitivity: 1.2-1.5
Day Trading (15m-1H):
Method: ATR Ratio or BB Width | Sensitivity: 0.8-1.0
Scalping (1m-5m):
Method: Volume Contraction | Sensitivity: 0.7-0.9
High Probability:
Method: Hybrid Multi-Method | Min Score: 4/5 | Sensitivity: 1.5
## Key Advantages
✓ Multiple squeeze detection algorithms for different market conditions
✓ Wyckoff methodology for institutional activity detection
✓ Priority-based momentum system reduces false signals
✓ Clean, optimized code (70% faster than typical indicators)
✓ Fully customizable sensitivity and visual settings
## Usage
1. Choose squeeze detection method based on your trading style
2. Watch for blue candles (squeeze active)
3. Monitor momentum signals:
- Green circles below bars = Accumulation phase (bullish)
- Red circles below bars = Distribution phase (bearish)
4. Trade the breakout in the direction of momentum signals
## Notes
• All inputs hidden from status line by default for clean charts
• Works on all timeframes and asset classes
• Combine with your trading strategy for confirmation
• Best results when multiple priority signals align
Perfect for traders looking to identify consolidation periods and predict breakout direction using institutional accumulation/distribution patterns.

Force DashboardScalping Dashboard - Complete User Guide
Overview
This scalping system consists of two complementary TradingView indicators designed for intraday trading with no overnight holds:
Force Dashboard - Single-row table showing real-time market bias and entry signals
Large Order Detection - Visual diamonds showing institutional order flow
Together, they provide a complete at-a-glance view of market conditions optimized for quick entries and exits.
Recommended Timeframes
Primary Scalping Timeframes
1-minute chart: Ultra-fast scalps (30 seconds - 3 minutes hold time)
2-minute chart: Quick scalps (2-5 minutes hold time)
5-minute chart: Standard scalps (5-15 minutes hold time)
Best Practices
Use 1-2 minute for highly liquid instruments (ES, NQ, major forex pairs)
Use 5-minute for less liquid markets or if you prefer fewer signals
Never hold past the last hour of trading to avoid overnight risk
Set hard stop times (e.g., exit all positions by 3:45 PM EST)
Dashboard Components Explained
Core Indicators (Circles ●)
MACD (5/13/5)
Green ● = Bullish momentum (MACD histogram positive)
Red ● = Bearish momentum (MACD histogram negative)
Gray ● = No clear momentum
Use: Confirms trend direction and momentum shifts
EMA (9/20/50)
Green ● = Price > EMA9 > EMA20 (uptrend)
Red ● = Price < EMA9 < EMA20 (downtrend)
Gray ● = Choppy/sideways
Use: Identifies the immediate micro-trend
Stoch (5-period Stochastic)
Green ● = Oversold (<20) - potential reversal up
Red ● = Overbought (>80) - potential reversal down
Gray ● = Neutral zone (20-80)
Use: Spots reversal opportunities at extremes
RSI (7-period)
Green ● = Oversold (<30)
Red ● = Overbought (>70)
Gray ● = Neutral
Use: Confirms overbought/oversold conditions
CVD (Cumulative Volume Delta)
Green ● = CVD above its moving average (buying pressure)
Red ● = CVD below its moving average (selling pressure)
Gray ● = Neutral
Use: Shows overall buying vs selling pressure
ΔCVD (Delta CVD - Rate of Change)
Green ● = CVD accelerating upward (buying acceleration)
Red ● = CVD accelerating downward (selling acceleration)
Gray ● = No acceleration
Use: Detects momentum shifts in order flow
Imbal (Order Flow Imbalance)
Green ● = Buy pressure >2x sell pressure
Red ● = Sell pressure >2x buy pressure
Gray ● = Balanced
Use: Identifies extreme one-sided order flow
Vol (Volume Strength)
Green ● = Volume >1.5x average (strong interest)
Red ● = Volume <0.7x average (low interest)
Gray ● = Normal volume
Yellow background = Volume surge (>2x average) - BIG MOVE ALERT
Use: Confirms conviction behind price moves
Tape (Tape Speed)
Green ● = Fast order flow (>1.3x normal)
Red ● = Slow order flow (<0.7x normal)
Gray ● = Normal speed
Yellow background = Very fast tape (>1.5x) - RAPID EXECUTION ALERT
Use: Measures urgency and speed of orders
Key Levels
Support (Supp)
Shows the nearest high-volume support level below current price
Bright Green background = Price is AT support (within 0.3%) - BOUNCE ZONE
Green background = Price above support (healthy)
Red background = Price below support (broken support, now resistance)
Resistance (Res)
Shows the nearest high-volume resistance level above current price
Bright Orange background = Price is AT resistance (within 0.3%) - REJECTION ZONE
Red background = Price below resistance (facing overhead supply)
Green background = Price above resistance (breakout)
These levels update automatically every 3 bars based on volume profile
Entry Signal Components
Score
Displays format: "6L" (6 long indicators) or "4S" (4 short indicators)
Bright Green = 6-7 indicators aligned for long
Light Green = 5 indicators aligned for long
Yellow = 4 indicators aligned (weaker setup)
Gray = No alignment
Red/Orange colors = Same scale for short setups
Score of 5+ indicates high-probability setup
SCALP (Main Entry Signal)
BRIGHT GREEN "LONG" = High-quality long scalp (Score 5+)
Green "LONG" = Decent long scalp (Score 4)
BRIGHT ORANGE "SHORT" = High-quality short scalp (Score 5+)
Red "SHORT" = Decent short scalp (Score 4)
Gray "WAIT" = No clear setup - STAY OUT
Entry Strategies
Strategy 1: High-Probability Scalps (Conservative)
When to Enter:
SCALP column shows BRIGHT GREEN "LONG" or BRIGHT ORANGE "SHORT"
Score is 5 or higher
Vol or Tape has yellow background (volume surge)
Example Long Setup:
SCALP = BRIGHT GREEN "LONG"
Score = 6L
Vol = Yellow background
Price AT Support (bright green Supp cell)
EMA, MACD, CVD, ΔCVD, Imbal all green
Entry: Enter immediately on next candle
Target: 0.5-1% move or resistance level
Stop: Below support or -0.3%
Hold Time: 2-10 minutes
Strategy 2: Momentum Scalps (Aggressive)
When to Enter:
Tape has yellow background (fast tape)
Vol has yellow background (volume surge)
ΔCVD is green (for longs) or red (for shorts)
Imbal shows strong imbalance in your direction
Score is 4+
Example Short Setup:
Tape & Vol = Yellow backgrounds
ΔCVD = Red, Imbal = Red
Price AT Resistance (bright orange)
Score = 5S
Entry: Enter immediately
Target: Quick 0.3-0.7% move
Stop: Tight -0.2%
Hold Time: 1-5 minutes
Strategy 3: Reversal Scalps (Mean Reversion)
When to Enter:
Stoch shows oversold (green) or overbought (red)
RSI confirms the extreme
Price is AT Support (for longs) or AT Resistance (for shorts)
ΔCVD and Imbal start reversing direction
Score is 4+
Example Long Setup:
Stoch = Green (oversold)
RSI = Green (oversold)
Supp = Bright green (at support)
ΔCVD turns green
Imbal turns green
Score = 4L or 5L
Entry: Wait for confirmation candle
Target: Move back to EMA9 or mid-range
Stop: Below the low
Hold Time: 3-8 minutes
Large Order Detection Usage
Diamond Signals
Green diamonds below bar = Large buy orders (institutional buying)
Red diamonds above bar = Large sell orders (institutional selling)
Size matters: Larger diamonds = larger order flow
How to Use with Dashboard
Confirmation Entries
Dashboard shows "LONG" signal
Green diamond appears
Enter immediately - institutions are buying
Divergence Alerts (CAUTION)
Dashboard shows "LONG" signal
RED diamond appears (institutions selling)
DO NOT ENTER - conflicting order flow
Cluster Patterns
Multiple green diamonds in row = Strong accumulation, stay long
Multiple red diamonds in row = Strong distribution, stay short
Alternating colors = Chop, avoid trading
Risk Management Rules
Position Sizing
Risk 0.5-1% of account per scalp
Maximum 3 concurrent positions
Reduce size after 2 consecutive losses
Stop Loss Guidelines
Tight stops: 0.2-0.3% for 1-2 min charts
Standard stops: 0.3-0.5% for 5 min charts
Always use stop loss - no exceptions
Place stops below support (longs) or above resistance (shorts)
Take Profit Targets
Target 1: 0.3-0.5% (take 50% off)
Target 2: 0.7-1% (take remaining 50%)
Move stop to breakeven after Target 1 hit
Trail stop if Score remains high
Time-Based Exits
Exit immediately if:
SCALP changes from LONG/SHORT to WAIT
Score drops below 3
Large diamond appears in opposite direction
Maximum hold time: 15 minutes (even if profitable)
Hard exit time: 30 minutes before market close
Trading Sessions
Best Times to Scalp
High-Liquidity Sessions
9:30-11:00 AM EST (Market open, highest volume)
2:00-3:30 PM EST (Afternoon session, good moves)
Avoid
11:30 AM-1:30 PM EST (Lunch, low volume)
Last 30 minutes (unpredictable, don't initiate new trades)
News releases (wait 5 minutes for volatility to settle)
Common Patterns & Setups
The Perfect Storm (Highest Probability)
Score = 6L or 7L
SCALP = BRIGHT GREEN
Vol + Tape = Yellow backgrounds
Green diamond appears
Price AT Support
Win rate: ~70-80%
The Fade Setup (Counter-Trend)
Price hits resistance (bright orange)
Stoch + RSI overbought (red)
Red diamond appears
CVD starts turning red
SCALP shows "SHORT"
Win rate: ~60-70%
The Breakout Continuation
Price breaks resistance (Res turns green)
EMA, MACD green
Vol surge (yellow)
Multiple green diamonds
SCALP = "LONG"
Win rate: ~65-75%
Warning Signs - DO NOT TRADE
Red Flags
❌ SCALP shows "WAIT"
❌ Score below 3
❌ Vol and Tape both gray (no volume)
❌ Conflicting signals (dashboard says LONG but red diamonds appearing)
❌ Alternating green/red circles (choppy market)
❌ Support and Resistance very close together (tight range)
Market Conditions to Avoid
Low volume periods
Major news releases (first 5 minutes after)
First 2 minutes after market open
Wide spreads
Consecutive losing trades (take a break after 2 losses)
Quick Reference Checklist
Before Taking ANY Trade:
☑ SCALP shows LONG or SHORT (not WAIT)
☑ Score is 4 or higher
☑ Vol or Tape shows activity
☑ No conflicting diamond signals
☑ Stop loss level identified
☑ Target profit level identified
☑ Not in restricted time periods
After Entering:
☑ Set stop loss immediately
☑ Set profit targets
☑ Watch SCALP column - exit if changes to WAIT
☑ Watch for opposite-colored diamonds
☑ Move stop to breakeven after first target
☑ Exit all by market close
Advanced Tips
Scalping Psychology
Be patient: Wait for Score 5+ setups
Be decisive: When signal appears, act immediately
Be disciplined: Follow your stop loss always
Be flexible: Exit quickly if dashboard reverses
Optimization
Backtest on your specific instrument
Adjust RSI/Stoch levels for your market
Fine-tune volume thresholds
Keep a trade journal to track which setups work best
Multi-Timeframe Confirmation
Use 5-min dashboard as "trend filter"
Take 1-min trades only in direction of 5-min SCALP signal
Increases win rate by ~10-15%
Troubleshooting
Q: Dashboard shows WAIT most of the time
Normal - scalping is about patience. Quality > Quantity
3-8 good setups per day is excellent
Q: Too many false signals
Increase minimum Score requirement to 5 or 6
Only trade with volume surge (yellow backgrounds)
Add large order detection confirmation
Q: Signals too slow
You may be on too high a timeframe
Try 1-minute chart for faster signals
Ensure real-time data feed is active
Q: Support/Resistance not updating
Normal - updates every 3 bars
If completely stuck, remove and re-add indicator
Summary
This scalping system works best when:
✅ Multiple indicators align (Score 5+)
✅ Volume and tape speed confirm the move
✅ Order flow (diamonds) confirms direction
✅ Price is at key levels (support/resistance)
✅ You manage risk strictly
✅ You exit before market close
The golden rule: When SCALP says WAIT, you WAIT. Discipline beats frequency.

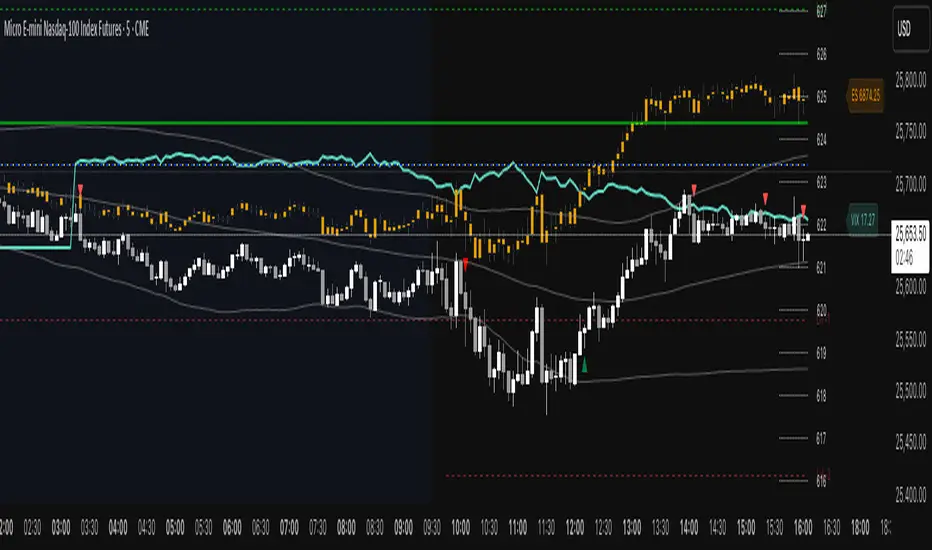
ES VIX on MNQ🧭 ES + VIX Overlay on MNQ
This indicator overlays the ES (S&P 500 futures) and VIX (Volatility Index) directly on the MNQ (Micro Nasdaq Futures) chart, allowing traders to visualize in real time the correlation, divergence, and volatility influence between the three instruments.
⸻
⚙️ How It Works
• The VIX is dynamically rescaled to the MNQ’s daily open, so its moves appear on the same price scale.
• The ES line is projected based on its percentage move relative to the session open (18:00 NY).
• Both are plotted in sync with MNQ to expose relative strength and divergence zones that often precede strong directional moves.
⸻
🧩 Inputs
• VIX Symbol: choose between VIX, CBOE:VIX, TVC:VIX
• Invert VIX Correlation: flips the VIX line for inverse-correlation setups
• VIX Step: controls how sensitively the VIX moves on the MNQ scale
• ES Symbol: defines the ES contract (e.g. ES1!)
• Show Signals: toggles on/off buy & sell markers
• Step (points): minimum distance between MNQ and VIX for a valid signal
• Block Signals: disables signals between 16:15 – 03:15 (illiquid hours)
⸻
💡 Signal Logic
The system tracks crossings between MNQ and the projected VIX line:
• Buy signal → when MNQ crosses above the VIX and expands upward by ≥ X points.
• Sell signal → when MNQ crosses below the VIX and expands downward by ≥ X points.
A time filter avoids noise during low-volume sessions.
⸻
📊 Visual Guide
• Cyan line = VIX on MNQ scale
• Orange line = ES on MNQ scale
• Labels on the right = current VIX / ES values
• BUY/SELL markers = potential volatility-based reversals
⸻
🚀 Practical Use
Perfect for traders who monitor:
• VIX–price divergence
• ES vs MNQ momentum confirmation
• Early volatility expansions before trend moves
⸻
💬 Core Idea:
“Volatility leads — price confirms.”
RSI ExtremesRSI Extremes — Educational Indicator (Pine v5)
Per-Tick Dual-RSI Extremes · Real-Time Visualization · Cooldown Logic
Overview
RSI Extremes is a real-time educational indicator built to show where the Relative Strength Index (RSI) reaches its most extreme levels during every tick of live price action.
Instead of using only the candle close, it continuously tracks both RSI(low) and RSI(high) to reveal how deeply each bar stretches into demand or supply extremes.
This tool is meant solely for study and visualization, helping you understand how RSI behaves intrabar when price wicks expand. It produces no signals, no alerts, and no trade suggestions — it’s a microscope for momentum pressure.
Core Idea
Standard RSI hides a lot of the wick-based stress in price because it calculates from close values only.
RSI Extremes solves this by splitting the measurement into two perspectives:
RSI of LOW (green) → shows how far momentum falls into potential demand exhaustion.
RSI of HIGH (red) → shows how far momentum extends into potential supply exhaustion.
Seeing both together exposes the full oscillation envelope — what RSI looks like between candle opens and closes, not just after the fact.
What Gets Plotted
RSI (Low) — green line representing intrabar downside pressure.
RSI (High) — red line representing intrabar upside pressure.
RSI Ghost (Smoothed) — gray line for soft context only.
Bands: 30 / 50 / 70 visual guides with a shaded 30–70 region.
Markers:
Enter marker when RSI(low) ≤ levelEnter (default 15).
Exit marker when RSI(high) ≥ levelExit (default 85).
Markers appear in real time as soon as a touch occurs and are locked per bar to avoid duplicates.
Inputs & Educational Purpose
Input Description Learning Focus
Source (for ghost smoother) Data used for the ghost RSI. Observe RSI smoothing lag.
RSI Length Period for both RSI(high) and RSI(low). Shorter = faster reaction; longer = smoother.
RSI-based MA Length (ghost) Smoothing for the ghost line. Compare sharp vs smoothed RSI rhythm.
levelEnter (touch or below) Default 15. Study how deep RSI(low) falls during market stress.
levelExit (touch or above) Default 85. Study how high RSI(high) rises during momentum bursts.
Rest period (bars) Cooldown after any event. Encourages post-event observation and prevents overlap.
Real-Time Behavior
Evaluates conditions per tick, not only at bar close.
Uses both real-time detection and bar-close backup for reliability.
Employs per-bar locks to prevent duplicate markers.
Integrates a cooldown so new markers only appear after the rest period.
The result is a clean, stable display of RSI stress points in live price motion — no flicker, no repaint.
How to Study with RSI Extremes
Watch how Enter markers form during sharp sell wicks — these highlight where intrabar RSI(low) dives into extreme territory.
Watch how Exit markers appear during aggressive tops — these show when RSI(high) surges beyond its upper boundary.
Compare both lines to the gray ghost: if the ghost is rising while Enter markers print, you’re seeing a temporary overshoot within strengthening momentum; if it’s falling while Exit markers print, you’re seeing supply exhaustion in weakening momentum.
Use cooldown spacing to examine how long markets take to recover or consolidate after an extreme tick.
Educational Value
Learn how RSI behaves inside a candle rather than only at its close.
Visualize how volatility affects the amplitude of RSI swings.
Understand that extremes don’t mean reversal — they measure intensity, not direction.
Build intuition for momentum saturation and liquidity hunts.
This indicator turns RSI into a real-time stress monitor rather than a delayed oscillator.
Category & Tags
Category: Indicator → Momentum (or Indicator → Educational / Research)
Tags: indicator, rsi, momentum, extremes, enter-exit, levelenter, levelexit, realtime, educational, research, visualization, pine-v5
Disclaimer
This indicator is intended exclusively for educational and research purposes.
It does not issue trade signals or financial advice.
All market activity carries risk; use this tool to learn, not to predict or execute trades.

VIX on MNQVIX on MNQ — VIX percent-move overlay on the MNQ price scale (daily-open anchor, optional inversion)
Overview
This indicator projects the VIX’s intraday percent change from the daily open onto the MNQ price scale. It takes today’s open for both VIX and MNQ, measures the VIX’s percentage move since that open, optionally inverts it (given the typical inverse relationship), and applies a scale factor to fit that move onto MNQ’s price axis. The result is a single line that reflects VIX dynamics but is plotted in MNQ points—great for reading risk-on/risk-off tone, spotting divergences, and timing mean-reversion around volatility spikes.
How it works
• Fetches VIX close on your chart timeframe and today’s open for VIX and MNQ.
• Computes pct = (VIX_close − VIX_open) / VIX_open.
• Optionally multiplies by −1 (invert) and then by a Scale Factor to compress amplitude.
• Plots MNQ_open * (1 + pct * (invert? −1 : 1) * scaleFactor) as the VIX-on-MNQ line.
• Adds a last-bar label with the current VIX value and a small info panel (VIX, % change, scaled level).
Inputs
• VIX Symbol: VIX, CBOE:VIX, or TVC:VIX (pick the one that matches your data feed).
• VIX Line Color: color of the overlay line.
• Invert VIX: flip the sign to reflect inverse correlation with MNQ.
• Scale Factor (default 0.05): tune how much of the VIX move is mapped onto MNQ points.
Why it’s useful
• Surfaces volatility-led divergences: when MNQ’s path disagrees with VIX’s risk signal.
• Helps confirm/fade breakouts and pullbacks during volatility expansions/compressions.
• Provides a quick, visual “volatility baseline” directly on the MNQ chart without juggling two panes.
Notes & limitations
• This is a percent-rebased overlay, not a hedge ratio, fair value, or spread model.
• It anchors to the current day’s open; session/timezone settings and your VIX symbol choice (CBOE:VIX vs TVC:VIX) can affect exact prints.
• The scale factor is intentionally manual—adjust until the overlay’s swings are visually informative for your setup.
Disclaimer
For educational use only. Not financial advice. Always manage risk.

PE Fair ValueIn short, it’s an automated fair value estimator based on the price-to-earnings model, with full manual control if TradingView’s fundamental data is missing.
Summary:
1. Lets the user choose the EPS source – either automatically from TradingView fundamentals (EPS TTM) or a manual value.
2. Attempts to fetch the stock’s P/E ratio (TTM) automatically; if unavailable, it uses a manual fallback P/E.
3. Calculates:
Actual P/E = current price ÷ EPS
Fair Value = EPS × chosen (auto/manual) P/E
Percentage difference between market price and fair value
4. Plots the fair-value line on the chart for visual comparison.
5. Displays a table in the top-right corner showing:
EPS used
Target P/E
Actual P/E
Fair value
Current price
Difference vs fair value (colored green or red)
6. Creates alerts when the stock is trading above or below the calculated fair value.
7. Also plots the current closing price for reference.

ICMR — Chrono Maker Range (v12.7.1)✅ ICMR — Chrono Maker Range (v12.7) — Description (Balanced Technical + Friendly)
ICMR — Chrono Maker Range is a hybrid market-structure tool designed to help traders clearly identify directional bias and high-quality breakouts using either Higher-Timeframe (HTF) ranges or Initial Balance (IB) ranges. The indicator automatically builds the range, colors candles by market state, and highlights breakout signals using smart filters to reduce noise.
The concept is simple:
Price is either above the range (Bullish), inside the range (Neutral), or below the range (Bearish)—and ICMR keeps this state stable and easy to follow.
🔷 How It Works
ICMR constructs a tradable range using one of two modes:
1) HTF Range Mode
Pulls the High / Low from a higher timeframe (e.g., Daily, 4H).
You can choose:
Previous HTF candle → stable, non-moving range
Current HTF candle → dynamic, expands until HTF close
Perfect for tracking market bias across smaller timeframes.
2) Initial Balance (IB) Mode
Builds the range from the first N minutes of the session (e.g., first 60 minutes).
After the IB period ends, the range locks and becomes the day’s framework.
🔷 Market State Logic
The indicator evaluates where price is relative to the range and classifies the market into:
✅ Bullish → price breaks above the range
⚪ Neutral → price stays inside
❌ Bearish → price breaks below
You can optionally enable an EMA Trend Filter (fast vs slow EMA) to ensure breakouts align with trend direction.
🔷 Smart Signal System
ICMR includes compact signal shapes (triangles/circles), but only when conditions are strong:
✔️ Minimum breakout distance beyond the range
✔️ Candle body must exceed a % of ATR
✔️ Optional volume expansion filter
✔️ Cooldown between signals to avoid over-trading
✔️ Option to trigger signals only on state flips
These filters help keep signals actionable and reduce noise.
🔷 Visual Tools
HTF/IB Range High, Range Low, Midline
Optional shaded box
Segmented extend-right lines that reset when HTF/IB changes
Bar coloring (Bull/Neutral/Bear)
Soft background tint (optional)
Built-in info panel with range & filter stats
Alerts on state flips
Everything is designed to keep the chart clean and readable.
🔷 Presets
The indicator includes two ready-to-use profiles:
Conservative
Stable HTF ranges, confirmed breaks, trend-filtered signals, and fewer alerts.
Aggressive
Dynamic HTF ranges, more flexible break rules, and more frequent signals.
Each preset can be fully customized.
🔷 How Traders Use It
Intraday traders use HTF ranges (D, 4H) for bias on 1m–15m charts.
Day traders use IB to track the opening range and breakout opportunities.
Swing traders use conservative settings to filter false moves.
Scalpers enable aggressive mode with ATR/volume filters.

Top Finder & Dip Hunter [BackQuant]Top Finder & Dip Hunter
A practical tool to map where price is statistically most likely to exhaust or mean-revert. It builds objective support for dips and resistance for tops from multiple methodologies, then filters raw touches with volume, momentum, trend, and price-action context to surface higher-quality reversal opportunities.
What this does
Draws a Dip Support line and a Top Resistance line using the method you select, or a blended hybrid.
Evaluates each touch/penetration against Quality Filters and assigns a 0–100 composite score.
Prints clean DIP and TOP signals only when depth/extension and quality pass your thresholds.
Optionally annotates the chart with the computed quality score at signal time.
Why it’s useful
Objectivity: Converts vague “looks extended” into rules, reduces discretion creep.
Signal hygiene: Filters raw touches using trend, volume, momentum, and candle structure to avoid obvious traps.
Adaptable regimes: Switch methods, sensitivity, and lookbacks to match choppy vs trending conditions.
How support and resistance are built
Pick one per side, or use “Hybrid.”
Dynamic: Anchors to the extreme of a lookback window, padded by recent ATR, so buffers expand in volatile periods and contract when calm.
Fibonacci: Uses the 0.618/0.786 retracement pair inside the current swing window to target common reaction zones.
Volatility: Uses a moving-average basis with standard-deviation bands to capture statistically stretched moves.
Volume-Weighted: Centers off VWAP and penalizes deviations using dispersion of price around VWAP, helpful on intraday instruments.
Hybrid: A weighted average of the above to smooth out single-method biases.
When a touch becomes a signal
Depth/extension test:
Dips must penetrate their support by at least Min Dip Depth % .
Tops must extend above resistance by at least Min Top Rise % .
Quality Score gate: The composite must clear Min Quality Score . Components:
Trend alignment: Favor dips in bullish regimes and tops in bearish regimes using EMAs and RSI.
Volume confirmation: Reward expansion or spikes versus a 20-period baseline.
RSI context: Prefer oversold for dips, overbought for tops.
Momentum shift: Look for short-term momentum turning in the expected direction.
Candle structure: Reward hammer/shooting-star style responses at the level.
How to use it
Pick your regime:
Range/chop, small caps, mean-revert intraday → Volatility or Volume Weighted .
Cleaner swings/trends → Dynamic or Fibonacci .
Unsure or mixed conditions → Hybrid .
Set windows: Start with Lookback = 50 for both sides. Increase in higher timeframes or slow assets, decrease for fast scalps.
Tune sensitivity: Raise Dip/Top Sensitivity to widen buffers and reduce noise. Lower to be more aggressive.
Gate with quality: Begin with Min Quality Score = 60 . Push to 70–80 for cleaner swing entries, relax to 50–60 for scalps.
Act on first prints: The script only fires on new qualified events. Use the score label to prioritize A-setups.
Typical workflows
Intraday futures/crypto: Volume-Weighted or Volatility methods for both sides, higher Sensitivity , require Volume Filter and Momentum Filter on. Look for DIP during opening drive exhaustion and TOP near late-session fatigue.
Swing equities/FX: Dynamic or Fibonacci with moderate sensitivity. Keep Trend Filter on to only take dips above the 200-EMA and tops below it.
Countertrend scouts: Lower Min Dip Depth % / Min Top Rise % slightly, but raise Min Quality Score to compensate.
Reading the chart
Lines: “Dip Support” and “Top Resistance” are the current actionable rails, lightly smoothed to reduce flicker.
Signals: “DIP” prints below bars when a qualified dip appears, “TOP” prints above for qualified tops.
Scores: Optional labels show the composite at signal time. Favor higher numbers, especially when aligned with higher-timeframe trend.
Background hints: Light highlights mark raw touches meeting depth/extension, even if they fail quality. Treat these as early warnings.
Tuning tips
If you get too many false DIP signals in downtrends, raise Min Dip Depth % and keep Trend Filter on.
If tops appear late in squeezes, lower Top Sensitivity slightly or switch top side to Fibonacci .
On assets with erratic volume, prefer Volatility or Dynamic methods and down-weight the Volume Filter .
For strict systems, increase Min Quality Score and require both Volume and Momentum filters.
What this is not
It is not a blind reversal signal. It’s a structured context tool. Combine with your risk plan and higher-timeframe map.
It is not a guarantee of mean reversion. In strong trends, expect fewer, higher-score opportunities and respect invalidation quickly.
Suggested presets
Scalp preset: Lookback 30–40, Sensitivity 1.2–1.5, Quality ≥ 55, Volume & Momentum filters ON.
Swing preset: Lookback 75–100, Sensitivity 1.0–1.2, Quality ≥ 70, Trend & Volume filters ON.
Chop preset: Volatility/Volume-Weighted methods, Quality ≥ 60, Momentum filter ON, RSI emphasis.
Input quick reference
Dip/Top Method: Choose the model for each side or “Hybrid” to blend.
Lookback: Swing window the levels are built from.
Sensitivity: Scales volatility padding around levels.
Min Dip Depth % / Min Top Rise %: Minimum breach/extension to qualify.
Quality Filters: Trend, Volume, Momentum toggles, plus Min Quality Score gate.
Visuals: Colors and whether to print score labels.
Best practices
Map higher-timeframe trend first, then act on lower-timeframe DIP/TOP in the trend’s favor.
Use the score as triage. Skip mediocre prints into news or at session open unless score is exceptional.
Pre-define stop placement relative to the level you used. If a DIP fails, exit on loss of structure rather than waiting for the next print.
Bottom line: Top Finder & Dip Hunter codifies where reversals are most defensible and only flags the ones with supportive context. Tune the method and filters to your market, then let the score keep your playbook disciplined.

A+ Trade Checklist (Bullish + Bearish Mode + Alerts) – Fixed v61. Trend direction (EMA alignment)
2. Relative Strength vs SPY (is your stock stronger than the market?)
3. Volume confirmation
4. RSI strength
5. Candle momentum

Power Balance ForecasterHey trader buddy! Remember the old IBM 5150 on Wall Street back in the 80s? :) Well, I wanted to pay tribute to it with this retro-style code when MS DOS and CRT screens were the cutting edge of technology...
Analysis of the balance of power between buyers and sellers with price predictions
What This Indicator Does
The Power Balance Forecaster indicator analyzes the relationship between buyer and seller strength to predict future price movements. Here's what it does in detail:
Main Features:
Power Balance Analysis: Calculates real-time percentage of buyer power vs seller power
Price Predictions: Estimates next closing level based on current momentum
Market State Detection: Identifies 5 different market conditions
Visual Signals: Shows directional arrows and price targets
How the Trading Logic Works
Power Balance Calculation:
Analyzes Consecutive Bars - Counts consecutive bullish and bearish bars
Calculates Momentum - Uses ATR-normalized momentum to measure trend strength
Determines Market State - Assigns one of 5 market states based on conditions
Market States:
Bull Control: Strong uptrend (75% buyer power)
Bear Control: Strong downtrend (75% seller power)
Buying Pressure: Bullish pressure (65% buyer power)
Selling Pressure: Bearish pressure (65% seller power)
Balance Area: Market in equilibrium (50/50)
Prediction System:
Bullish Condition: Buyer power > 55% + Positive momentum = Bullish prediction
Bearish Condition: Seller power > 55% + Negative momentum = Bearish prediction
Price Target: Based on ATR multiplied by timeframe factor
Configurable Parameters:
Analysis Sensitivity (5-50): Controls how responsive the indicator is
Low values (5-15): More sensitive, ideal for scalping
High values (30-50): More stable, ideal for swing trading
Table Position: Choose from 9 positions to display the data table
Trading Signals:
Green Triangle ▲: Bullish signal, price expected to increase
Green Triangle ▼: Bearish signal, price expected to decrease
Dashed Line: Shows the price target projection
Label: Displays the exact target value
Recommended Timeframes:
Lower Timeframes (1-15 minutes):
Sensitivity: 10-20
Automatic Low TF mode
Higher Timeframes (1 hour - 1 day):
Sensitivity: 25-40
Automatic High TF mode
Important Notes:
Always use this indicator in combination with:
Market context analysis
Proper risk management
Confirmation from other indicators
Mandatory stop losses
The indicator works best in trending markets and may be less effective during extreme consolidation periods.

[Asian Range + Sweeps]Main Features
Asian Range (S2) — fully configurable session band (start/end, hour:minute) with automatic detection and visual high/low markers.
HOD/LOD (S1) — adaptive cutoff logic for Forex vs Indices, with optional manual override.
Gap Correction — optional true HOD/LOD detection using a 1-minute base with overnight gap adjustment.
Sweep Detection — real-time alerts for S1 and S2 sweeps, with independent cooldown control to avoid duplicate signals.
Visual Controls — customizable colors, line thickness, and transparency.
KeepDays Setting — allows you to manage how many past session drawings are preserved on the chart

SMC ORB vs Pre-Market SPY/IWMStacks institutional confluences such as Smart Money Concepts, Inner Circle Trading, volatility, and structure.
Plots Premarket high/low and 15 minute Opening range
Plots the first sweep of Premarket high/low and any subsequent orb breaks

SMC ORB vs PM ALPHADesigned to stack institutional confluences such as Smart Money Concepts, Inner Circle Trading, volatility, and market structure.
Plots pre-market high/low and 15 Opening Range.
Plots first sweep of Pre-market high/low as well as orb break/holds.
TP of Previous high/low & SL optional

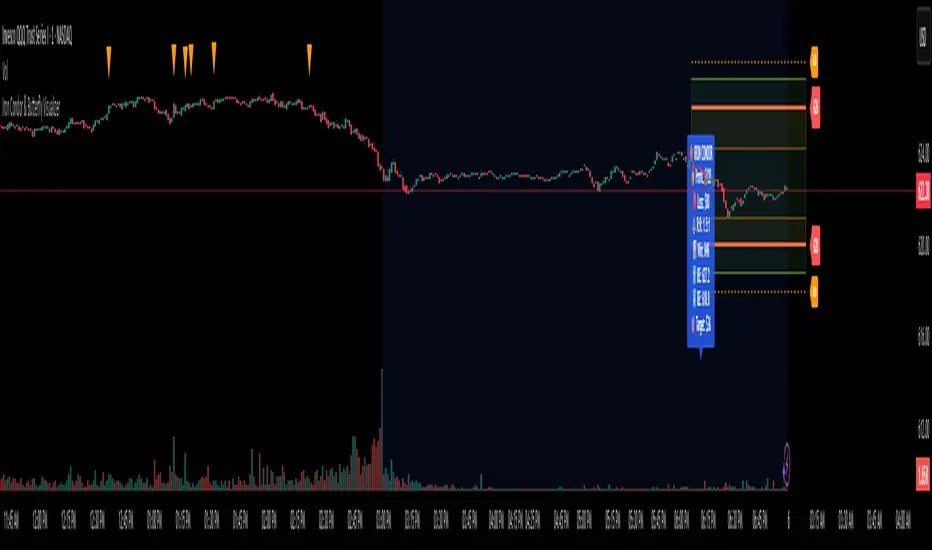
Iron Condor & Butterfly VisualizerIt helps you visualize and manage your option spread by:
Plotting strike prices and breakeven lines directly on the chart.
Showing profit/loss zones, adjustment zones, and alerts when price nears critical levels.
Calculating risk/reward, probability of profit, theta decay, IV condition, and trade score.
🎯 2. Inputs & Configuration
You input your trade details as a comma-separated string:
For an Iron Condor
ShortCall, LongCall, ShortPut, LongPut, Credit, Contracts, Target%
Example: 626,628,620,618,1.20,1,30
For a Butterfly Spread
LowerWing, Body, UpperWing, Debit, Contracts, Target%
Example: 600,620,640,2.50,2,50
The indicator automatically parses this and knows which strategy type you selected.
You can also control:
Visuals (profit zones, breakevens, labels)
Risk (stop loss %, adjustment zones)
Account/risk sizing
Market conditions (IV Rank, current IV, DTE)
⚙️ 3. Data Parsing & Strategy Recognition
The code reads your pasted string, splits it by commas, and determines:
Which strikes are short vs long (or wings/body for Butterfly)
Whether the strategy is credit (Iron Condor) or debit (Butterfly)
Calculates net credit/debit, contract size, and profit target
📈 4. Profit/Loss Calculations
It dynamically calculates:
Max Profit
Iron Condor: net credit × 100 × contracts
Butterfly: (wing width − debit) × 100 × contracts
Max Loss
Iron Condor: difference between strikes minus credit
Butterfly: debit × 100 × contracts
Breakeven points
Iron Condor: short strikes ± net credit
Butterfly: body ± debit
Current P&L relative to the live price (close).
⚖️ 5. Risk & Position Sizing
It checks:
Stop-loss trigger (% of max loss)
Adjustment alert if price nears short strikes
Recommended contract size based on account size and % risk per trade
Actual % of account at risk
⏱️ 6. Time Decay & IV Analysis
If you input days to expiration, it shows:
Theta (approx daily time decay)
Decay progress bar (% of 30-day cycle)
IV condition:
Green: favorable (>50 IV Rank)
Yellow: neutral (30–50)
Red: poor (<30)
🧮 7. Trade Scoring
It gives a Trade Score (0–100) based on:
IV Rank (favorable market)
Risk/Reward ratio
Probability of profit
Default 20 baseline points
This helps gauge whether the setup is statistically attractive.
🧠 8. Visualizations
When the indicator runs, it draws on your chart:
Lines
Red = short strikes
Orange dashed = long strikes
Yellow dotted = breakeven levels
Boxes
Green = profit zone
Orange shaded = adjustment zones (approaching danger)
Labels (optional)
Strike labels (call/put prices)
Info box summarizing:
Profit, loss, risk/reward
Breakevens, theta, target, gamma risk flag
🚨 9. Alerts
The script triggers TradingView alerts when:
Price nears call or put adjustment zones
Profit target is hit
Stop loss is hit
These help you manage the trade without constant monitoring.
🧭 10. In Practice
You’d:
Copy the option strikes and trade details from your broker or analyzer.
Paste them into 📋 PASTE YOUR TRADE DATA HERE.
The indicator plots:
Profit/loss region
Adjustment warnings
Key metrics
Alerts if your trade is in danger or near target.
Local Hurst Slope [Dynamic Regime]1. HOW THE INDICATOR WORKS (Math → Market Edge)Step
Math
Market Intuition
1. Log-Returns
r_t = log(P_t / P_{t-1})
Removes scale, makes series stationary
2. R/S per τ
R = max(cum_dev) - min(cum_dev)
S = stdev(segment)
Measures memory strength over window τ
3. H(τ) = log(R/S) / log(τ)
Di Matteo (2007)
H > 0.5 → Trend memory
H < 0.5 → Mean-reversion
4. Slope = dH/d(log τ)
Linear regression of H vs log(τ)
Slope > 0.12 → Trend accelerating
Slope < -0.08 → Reversion emerging
LEADING EDGE: The slope changes 3–20 bars BEFORE price confirms
→ You enter before the crowd, exit before the trap
Slope > +0.12 + Strong Trend = Bullish = Long
Slope +0.05 to +0.12 = Weak Trend = Cautious = Hold/Trail
Slope -0.05 to +0.05 = Random = No Edge
Slope-0.08 to -0.05 = Weak Reversion = Bearish setup = Prepare Short
Slope < -0.08 = Strong Reversion = Bearish= Short
PRO TIPS
Only trade in direction of 200-day SMA
Filters false signals
Avoid trading 3 days before/after earnings
Volatility kills edge
Use on ETFs (SPY, QQQ)
Cleaner than single stocks
Combine with RSI(14)
RSI < 30 + Hurst short = nuclear reversal

TICK OscillatorOscillator that makes it easy to see when TICK is hitting extreme readings or establishing a bullish/bearish divergence vs the indices.
- Green coloration means a reading of >+400
- Red coloration means a reading of <-400
- Orange means a reading in between -400 and +400
This was inspired by John F Carter's book "Mastering The Trade", where I first learned about utilizing TICK in my trading.
