HH HL LH LL + BOS / CHoCHHH HL LH LL + BOS / CHoCH Structure Indicator (ATR Adaptive)
This indicator provides a complete market structure framework using swing-based pivots, real-time trend detection, BOS (Break of Structure), CHoCH (Change of Character), and optional ATR-adaptive swing sensitivity.
🔹 Core Features
1. Market Structure Labels
The script detects and labels:
HH – Higher High
LH – Lower High
HL – Higher Low
LL – Lower Low
These labels help visualize trend continuation or weakness in structure.
Each label type can be individually toggled ON/OFF in settings.
2. ATR-Based Adaptive Swing Length (Optional)
Swing pivots can be calculated using:
A fixed manual swing length, or
A dynamic ATR-based swing length that adjusts automatically to volatility.
Increasing volatility → longer swings
Decreasing volatility → tighter swings
This makes structure detection more stable and timeframe-adaptive.
3. Close-Based Break of Structure (BOS)
The indicator identifies a BOS when:
Price closes above the previous swing high (Bullish BOS↑)
Price closes below the previous swing low (Bearish BOS↓)
BOS labels can be turned ON/OFF without affecting internal calculations.
4. CHoCH (Change of Character)
CHoCH is triggered when a BOS occurs against the current trend, indicating a potential trend reversal:
CHoCH↑ – Bearish → Bullish reversal
CHoCH↓ – Bullish → Bearish reversal
CHoCH remains active even when BOS labels are turned off.
5. Alerts
The indicator provides alert conditions for:
CHoCH↑ (Bullish Trend Shift)
CHoCH↓ (Bearish Trend Shift)
This allows traders to automate notifications for significant trend changes.
6. Trend State Tracking
The script internally tracks the current structure-based trend:
Uptrend
Downtrend
Undefined
The trend updates dynamically based on real BOS events.
7. Fully Backwards Compatible
The indicator generates structure, BOS, and CHoCH even when scrolling back deep in chart history, thanks to extended max_bars_back handling.
Summary
This tool provides a complete, flexible, and non-repainting framework for market structure analysis, suitable for:
SMC/ICT traders
Swing & intraday traders
Trend traders
Price action analysts
With adaptive swing detection, clean structure labeling, BOS/CHoCH logic, and alert integration, the indicator helps traders understand market transitions with clarity and precision.
在腳本中搜尋"BOS"

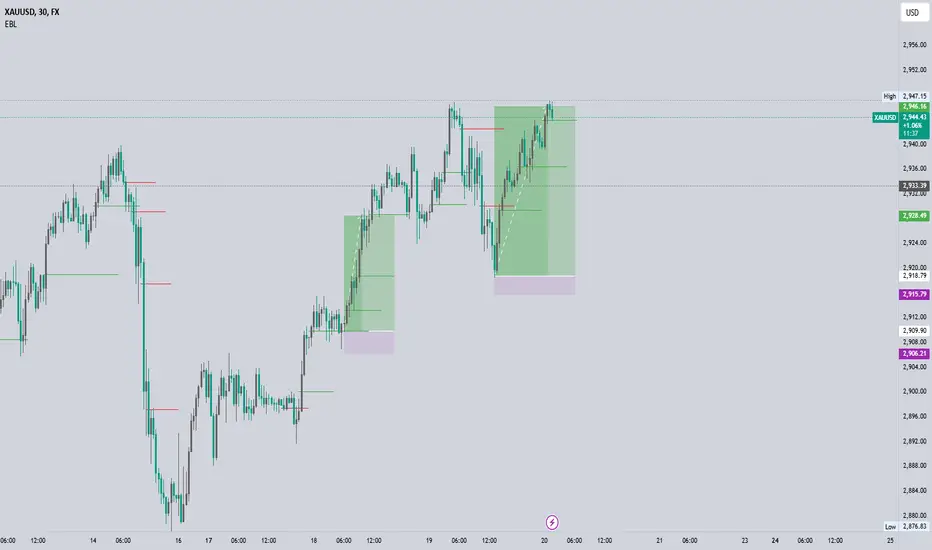
EBL - Enhanced BOS LogicEBL - Enhanced BOS Logic
The EBL (Enhanced Break of Structure Logic) script is a powerful tool for traders who want to identify and act on key structural shifts in the market. By combining visual cues, such as horizontal lines and dynamic arrows, the script highlights critical points of interest where market behavior may indicate significant bullish or bearish momentum.
What Makes EBL Unique?
Break of Structure (BOS) Identification:
The script dynamically detects when price breaks above or below significant highs and lows, marking these levels as key BOS points.
Once a BOS level is confirmed, it is displayed on the chart as a horizontal line, allowing traders to easily identify areas of potential support and resistance.
Real-Time Validation and Invalidations:
Bullish BOS levels remain active until a bearish candle closes below the initiating bullish candle.
Similarly, bearish BOS levels remain active until a bullish candle closes above the initiating bearish candle.
If a BOS level is invalidated, both the corresponding line and its arrow are automatically removed to maintain chart clarity.
Visual Clarity with Arrows and Lines:
Customizable triangle arrows (green for bullish and red for bearish) appear alongside lines to signal entry opportunities.
Traders can adjust line length, colors, and visibility of arrows to fit their charting style.
Alerts for Confirmation:
Receive alerts when bullish or bearish structures are confirmed, ensuring you never miss a signal even when away from your chart.
How the Script Works
Detection of Bullish and Bearish Structures:
The script identifies a "Bullish Break" when the price closes above the high of a bullish candle followed by a bearish one.
A "Bearish Break" is detected when the price closes below the low of a bearish candle followed by a bullish one.
Line and Arrow Placement:
Horizontal lines are drawn at the high or low of the respective BOS level.
Triangular arrows are plotted just below or above the respective levels to indicate potential trade opportunities.
Automatic Cleanup:
When a line is invalidated by opposing market movement, both the line and its connected arrow are automatically removed from the chart.
How to Use EBL
Settings:
Adjust line colors (green for bullish, red for bearish) to suit your charting theme.
Customize arrow visibility or hide lines if you prefer a less cluttered chart.
Set the horizontal line length to match your desired timeframe and analysis depth.
Trading Concepts:
Trend Reversal Zones: Use invalidated BOS levels as signals for possible trend reversals.
Momentum Trading: Follow confirmed BOS levels to identify areas where price momentum is likely to continue.
Dynamic Support and Resistance: Leverage the lines to identify evolving support and resistance zones.
Alerts:
Enable alerts to receive notifications when bullish or bearish trends are confirmed, allowing you to stay informed without constant monitoring.
Conceptual Basis
This script is based on the widely used market structure concept, which is fundamental to price action trading. By tracking the highs and lows created by bullish and bearish movements, the EBL script provides an objective and systematic approach to identifying and trading key structural points in the market.
With the EBL - Enhanced BOS Logic, traders can visually and systematically track market structure, identify potential trade setups, and maintain a cleaner chart with automated line and arrow management. This script is ideal for trend-following, scalping, and swing trading strategies across all markets and timeframes.
ICT SMC Custom — BOS/MSS + OB + FVGWant me to fill that box? Here’s a ready‑to‑paste description for your publish screen:
⸻
ICT SMC Custom — BOS/MSS + OB + FVG (Crypto‑friendly)
A clean Smart Money Concepts tool that marks Break of Structure (BOS), Market Structure Shift (MSS), Order Blocks (OB), and Fair Value Gaps (FVG) with bold, easy‑to‑see visuals. Built for crypto but works on any market and timeframe.
What it does
• BOS & MSS detection with optional body/wick logic
• Order Blocks: auto‑draws the last opposite candle before a BOS, keeps only the most recent N, and fades when mitigated
• FVGs: 3‑candle gaps with a minimum size filter and a cap on how many to keep
• HTF Swings (optional): plots higher‑timeframe pivot highs/lows for top‑down context
• Alerts for BOS/MSS and FVG formation
Inputs
• Swing pivot length (default 3): sensitivity for structure pivots
• Use candle bodies for breaks: close vs level (on) or wicks (off)
• Show BOS/MSS labels, Show FVG, Show Order Blocks
• Min FVG size (ticks) and Max boxes to keep for FVG/OB
• OB uses candle body: body range vs full wick range
• Show higher timeframe swings + HTF timeframe
• Bullish/Bearish colors
How it works
• BOS triggers when price breaks the last opposite swing.
• MSS flags when the break flips the prior bias.
• OB is the most recent opposite candle prior to BOS; it’s marked and later greyed out once price closes through it (mitigation).
• FVG is detected when candle 1’s high < candle 3’s low (bear) or candle 1’s low > candle 3’s high (bull).
Alerts included
• BOS Up / BOS Down
• MSS Up / MSS Down
• FVG Up / FVG Down
Tips
• Start on 15m/1h for crypto, pivot length 3–5.
• Turn Use candle bodies ON for stricter confirmations, OFF for more signals.
• If boxes look cluttered, lower “Max boxes to keep.”
Note: This is a visual/educational tool, not financial advice. Always confirm with your own plan and risk management.

Support & Resistance External/Internal & BoS [sgbpulse]Market Structure Support & Resistance External/Internal & BoS
Overview: Smart & Fast Market Structure Analysis
The Market Structure "Support & Resistance External/Internal & BoS " indicator is designed to empower your technical analysis by automatically and precisely identifying significant support and resistance levels. It achieves this by pinpointing high and low Pivot Points, plus key Pre-Market High/Low levels.
Its unique strength lies in its dynamic adaptability to any timeframe and any asset you choose. This tool analyzes the relevant market structure for the current timeframe and asset, providing you with accurate and relevant levels in real-time. The indicator maintains a clean chart and swiftly displays all support, resistance, and Pre-Market levels for any asset, saving valuable analysis time and enabling you to get a clear and quick snapshot of the market.
How the Indicator Works
The indicator identifies and displays three critical types of key levels:
External Pivots: These are more significant pivot points, indicating important reversal points across a broader range of price movement, considering the current timeframe. The indicator draws dark green support lines (for low pivots) and dark red resistance lines (for high pivots) from these points.
Internal Pivots: These are shorter-term pivot points, signifying smaller corrections or reversals within the overall structure of the current timeframe. These lines provide additional areas of interest within the ranges of the External Pivots.
Pre-Market High/Low Levels: The indicator displays the High and Low reached during pre-market hours as distinct lines on the chart. Please note: These levels will only appear when the selected timeframe is lower than one day (e.g., 1-hour, 15-minute) and provided that the "Session extended trading hours" option is enabled in your TradingView chart settings. These levels are crucial for identifying potential opening ranges and critical support/resistance areas upon regular market open, especially for intraday trading.
Break of Structure (BoS) Identification
A key feature of this indicator is its ability to identify Break of Structure (BoS). When a support or resistance line is breached, the indicator changes the line's color to gray and displays a "Break of Structure" label, indicating a potential trend change or continuation:
External BoS: When an external support/resistance line is broken, a "BoS" label in red will appear. This is a strong signal for a potential shift in the primary market structure or a strong trend continuation.
Internal BoS: When an internal support/resistance line is broken, an "iBoS" label in green will appear. This indicates a break within the existing market structure, which can be used to confirm direction or identify shorter-term entry/exit opportunities.
Full Indicator Customization
The indicator provides maximum flexibility to suit any trading style and timeframe:
Number of Lines Displayed: You can choose how many support and resistance lines you want to see on your chart. The default is 15 lines, but you can increase or decrease this number according to your needs and desired level of detail.
External Pivot Settings: Define the number of bars before and after a pivot point required for External Pivot identification.
Internal Pivot Settings: Define the number of bars before and after a pivot point required for Internal Pivot identification.
Color Customization: Full control over colors! You can change the colors of the support and resistance lines, the colors of the Pre-Market levels, and also the colors of the BoS and iBoS labels to create a visual appearance that perfectly matches your personal preferences.
This flexibility allows you to adapt the indicator to your trading style and any timeframe you operate in, without needing to manually change settings each time.
Recommended Uses
Clean Chart & Quick Analysis: The indicator displays important levels clearly, enabling quick identification of areas of interest without visual clutter on the chart. This significantly saves analysis time and allows you to make faster decisions.
Critical Levels for Any Timeframe & Asset: Get precise and adaptive support and resistance, plus essential Pre-Market levels (in relevant timeframes), for any timeframe and on any asset you choose.
Trend Direction Identification: Clear support and resistance lines help understand market structure.
Breakout Confirmation: The BoS label provides visual confirmation of key level breaches, helping to confirm potential trend changes.
Locating Entry & Exit Points: Use these levels as potential areas of interest for trades, after confirming a breakout or reversal.
Finding Stop-Loss & Take-Profit Points: Strategically place protective stops and profit targets around these support and resistance levels.
Important Note
Like any technical indicator, Market Structure "Support & Resistance External/Internal & BoS " is a supplementary tool. It's highly recommended to use it in conjunction with additional analysis methods (such as price action analysis, other indicators, and fundamental analysis) for informed trading decisions. Financial markets are dynamic, and trading always carries inherent risk.

Enhanced BOS Strategy with SL/TP and EMA TableDescription:
The Enhanced BOS (Break of Structure) Strategy is an advanced open-source trading indicator designed to identify key market structure changes, integrated with dynamic Stop Loss (SL) and Take Profit (TP) levels, along with an informative EMA (Exponential Moving Average) table for added trend analysis.
Key Features:
Break of Structure (BOS) Detection:
The script detects bullish and bearish BOS by identifying pivot points using a custom pivot period. When the price crosses above or below these points, it signals a potential market trend reversal or continuation.
Dynamic SL/TP Levels:
Users can toggle static SL/TP settings, which automatically calculate levels based on user-defined points. These levels are visualized on the chart with dotted lines and labeled for clarity.
Volume Filters:
The strategy includes a volume condition filter to ensure that only trades within a specified volume range are considered. This helps in avoiding low-volume trades that might lead to false signals.
EMA Table Display:
An on-chart table displaying the current values of the 13-period, 50-period, and 200-period EMAs. This provides a quick reference for trend identification and confirmation, helping traders to stay aligned with the broader market trend.
How It Works:
The script utilizes a combination of moving averages and pivot points to identify potential breakouts or breakdowns in market structure. When a bullish BOS is detected, and the volume conditions are met, the strategy suggests a long position, marking potential SL/TP levels. Similarly, it suggests short positions for bearish BOS.
The EMA table serves as a visual aid, providing real-time updates of the EMA values, allowing traders to gauge the market’s directional bias quickly.
How to Use:
Setting Parameters:
Adjust the pivot period to fine-tune BOS detection according to your trading style and the asset’s volatility.
Configure the SL/TP settings based on your risk tolerance and target profit levels.
Interpreting Signals:
A “Buy” label on the chart indicates a bullish BOS with volume confirmation, signaling a potential long entry.
A “Sell” label indicates a bearish BOS with volume confirmation, signaling a potential short entry.
The EMA table aids in confirming these signals, where the position of the fast, mid, and slow EMAs can provide additional context to the trend’s strength and direction.
Volume Filtering:
Ensure your trades are filtered through the script’s volume condition, which allows for the exclusion of low-volume periods that might generate unreliable signals.
Unique Value:
Unlike many other BOS strategies, this script integrates volume conditions and a visual EMA table, providing a comprehensive toolkit for traders looking to capture market structure shifts while maintaining an eye on trend direction and trade execution precision.
Additional Information:
This script is designed for use on standard bar or candlestick charts for best results.
It is open-source and free to use, encouraging collaboration and improvement by the TradingView community.
By combining powerful trend-following EMAs with the precision of BOS detection and the safety of volume filtering, the Enhanced BOS Strategy offers a balanced approach to trading market structure changes.

Golden BOS Strategy - ChecklistA clean, mechanical on-chart checklist designed for multi-timeframe traders using the Golden BOS / Institutional Retracement Framework.
This tool helps you stay disciplined by tracking each requirement of the strategy in real time:
Included Criteria
4H Bias: Bullish or bearish macro structure
1H Structure: Push/pull phase + golden zone retracement
5M Entry Model:
Break of Structure (BOS)
5M golden zone retracement
POI validation (OB/FVG/Breaker)
Final micro BOS or rejection confirmation
Risk Filters:
Session validity (London / NY)
Red news avoidance
Stop-loss placement check
Liquidity-based target confirmation
Purpose
This overlay ensures every trade meets strict criteria before execution, removing emotion and improvisation. Ideal for backtesting, forward testing, and staying consistent during live market conditions.
Golden BOS Strategy — Description
The Golden BOS Strategy is a structured, multi-timeframe trading system designed to capture high-probability continuation moves during London and New York sessions. The strategy combines institutional concepts with Fibonacci-based retracements to identify discounted entry zones aligned with higher-timeframe direction.
Using the 4H timeframe, traders establish the daily macro bias and identify the dominant trend. The 1H chart is then used to confirm the current phase of market structure, distinguishing between impulsive “push” moves and corrective “pullback” phases. A Fibonacci retracement is applied to the most recent 1H impulse leg to define a high-value discount or premium zone where entries become valid.
Execution takes place on the 5-minute chart. Once price reaches the 1H golden zone (61.8–78.6%), a Break of Structure (BOS) is required to confirm a shift in short-term momentum. A second Fibonacci retracement is then drawn on the 5M impulse leg that caused the BOS, and price must retrace back into the 5M golden zone. Traders refine their entry using a confluence point of interest (POI) such as a Fair Value Gap (FVG), Order Block, Breaker Block, or Inverse FVG, ideally accompanied by a final micro BOS or rejection candle.
Risk management is strict and rule-driven. Stop loss is placed beyond the extreme wick of the POI, while take-profit targets are set at logical liquidity pools in the direction of the higher-timeframe trend. The strategy avoids red-folder news and only allows trades during active sessions to ensure optimal volatility and reliability.
The Golden BOS Strategy is designed to impose discipline, reduce discretionary errors, and give traders a repeatable, mechanical framework for navigating trending markets with precision.

EBL - Enigma BOS Logic Select Higher Time FrameThe "EBL – Enigma BOS Logic" is a unique multi-timeframe trading indicator designed for traders who rely on structured price action and key level retests to find high-probability trade opportunities. This indicator automates the identification of significant price levels on a higher timeframe, plots them across all lower timeframes, and provides actionable signals (buy/sell) when price retests those levels. It is ideal for traders who focus on lower timeframes for precise entries while using higher timeframe structure for trend confirmation.
How the Indicator Works
Key Level Detection:
The indicator allows the user to select a key level timeframe (e.g., 1H, 4H, Daily, Weekly). It then identifies Break of Structure (BOS) levels on the selected timeframe.
When a bullish-to-bearish or bearish-to-bullish reversal is detected on the selected timeframe, the corresponding high or low of the reversal candle is stored as a key level.
These key levels are plotted as horizontal lines on all lower timeframes, helping the trader visualize critical support and resistance zones across multiple timeframes.
Retest Confirmation:
Once a key level is established, the indicator continuously monitors the price action on lower timeframes.
If the price touches or crosses a key level, it is considered a retest, and an alert is generated.
The indicator plots a retest marker (customizable as a circle or diamond) at the exact price level where the retest occurred, providing a clear visual cue for the trader.
Trading Signals:
When a retest is detected, a table is displayed on the chart with the following information:
The trading pair.
The signal direction (Buy/Sell).
The price at which the retest occurred.
This table gives traders instant insight into actionable opportunities, making it easier to focus on live market conditions without missing critical retests.
Key Features
Multi-Timeframe Analysis: The indicator focuses on a higher timeframe selected by the user, ensuring that only the most relevant key levels are plotted for lower timeframe trading.
Dynamic Retest Signals: It dynamically identifies when price retests a key level and provides both visual markers and real-time alerts.
Customizable Retest Markers: Users can customize the retest marker's shape (circle/diamond) and color to suit their preferences.
Signal Table: A built-in table displays clear buy or sell signals when retests occur, ensuring that traders have all the necessary information at a glance.
Alerts: The indicator supports real-time alerts for retests, helping traders stay informed even when they are not actively monitoring the chart.
How to Use the Indicator
Select a Key Level Timeframe:
In the input settings, choose a higher timeframe (e.g., 4H or Daily) to define key levels.
The indicator will calculate Break of Structure (BOS) levels on the selected timeframe and plot them as horizontal lines across all lower timeframes.
Monitor Lower Timeframes for Retests:
Switch to a lower timeframe (e.g., 15m, 5m) to wait for price to approach the key levels plotted by the indicator.
When a retest occurs, observe the signal table and retest marker for actionable trade signals.
Act on Buy/Sell Signals:
Use the information provided by the signal table to make trading decisions.
For a buy signal, wait for bullish confirmation (e.g., price holding above the retested level).
For a sell signal, wait for bearish confirmation (e.g., price holding below the retested level).
Trading Concepts and Underlying Logic
The indicator is based on the Break of Structure (BOS) concept, a core principle in price action trading. BOS levels represent points where the market shifts its trend direction, making them critical zones for potential reversals or continuations.
By focusing on higher timeframe BOS levels, the indicator helps traders align their lower timeframe entries with the overall market trend.
The concept of retests is used to confirm the validity of a key level. A retest occurs when the price returns to a previously identified BOS level, offering a high-probability entry point.
Use Cases
Scalping: Traders who prefer lower timeframe scalping can use the indicator to align their trades with higher timeframe key levels, increasing the likelihood of successful trades.
Swing Trading: Swing traders can use the indicator to identify key reversal zones on higher timeframes and plan their trades accordingly.
Intraday Trading: Intraday traders can benefit from the real-time alerts and signals generated by the indicator, ensuring they never miss critical retests during active trading hours.
Conclusion
The "EBL – Enigma BOS Logic" is a powerful tool for traders who want to enhance their price action trading by focusing on key levels and retests across multiple timeframes. By automating the identification of BOS levels and providing clear retest signals, it helps traders make more informed and confident trading decisions. Whether you are a scalper, intraday trader, or swing trader, this indicator offers valuable insights to improve your trading performance.

FTR Rules BoS/ChoCh MarkupThis indicator marks Break of Structure (BoS) and Change of Character (ChoCh) in the price structure on your charts. It runs on any timeframe. This indicator is useful for determining if you are seeing a trend change in the market or if you are only seeing a pullback with the market continuing in the direction of the trend. The indicator will look for price to break the previous BoS line or ChoCh line to mark a new BoS. When a BoS line is broken, it will then look for the lowest or highest pullback (depending on which way the market is trending) between to 2 BoS lines to mark the ChoCh line. When the ChoCh line is broken, it will mark that line as BoS and the previous BoS line will become ChoCh.
What makes this indicator unique from other BoS and ChoCh indicators is that it follows specific rules used by the FTR Trading group. The main difference is that the ChoCh line isn't changed to a BoS line from only a candle wick break. You will need a candle body break to move your BoS line to ChoCh. If a candle wick breaks your ChoCh line, you simply extend the ChoCh line to the new high or low of the wick. There are smaller differences that are proprietary to the FTR strategy.

Minor Break of Structure (Minor BoS)This indicator extracts and isolates the Minor Break of Structure (BoS) logic from a full SMC framework and presents it as a clean, lightweight tool for structure-based price action traders.
Unlike traditional BOS indicators that rely on swing calculations with heavy filtering, this script uses original SMC-style minor structure logic to detect meaningful shifts in internal order flow.
A Minor BoS appears when price breaks above a minor swing high (bullish) or below a minor swing low (bearish), confirming a short-term continuation in trend direction.
Features:
Bullish Minor BoS detection
Bearish Minor BoS detection
Automatic line plotting with extend-right
Clear “Minor BoS” label with tiny footprint
Customizable line styles and colors
Lightweight & optimized for fast execution
Zero repainting on BoS confirmations
This tool is ideal for traders who want a simple, clean, and reliable structure-based signal without the noise of major structure, order blocks, liquidity sweeps, or external SMC modules.

Market Structure (BOS on Break, HH/HL/LH/LL)Market Structure (BOS on Break, HH/HL/LH/LL) is a clean and reactive market structure tool designed for traders who want clear visual feedback of trend direction and structure changes.
It automatically identifies:
Higher Highs (HH)
Higher Lows (HL)
Lower Highs (LH)
Lower Lows (LL)
Breaks of Structure (BOS) when price breaches previous swing levels.
✳️ Features
Automatic Structure Detection: Detects swing highs/lows based on your left/right pivot settings.
Break of Structure Alerts: Instantly updates bias when price breaks a previous swing level (no delay).
Real-Time BOS Response: Structure flips as soon as price takes out the previous high or low.
Color-Coded Bars: Bars can auto-paint white for bullish and black for bearish conditions.
Optional Fading Dots: Visual fading dots track trend duration and strength for quick bias reading.
Customizable Pivots: Choose how many bars to use for left/right swing confirmation.
Alerts: Fully configured for HH, HL, LH, LL, BOS Up, and BOS Down events.
⚙️ Inputs
Left Pivot Bars / Right Pivot Bars: Control how many candles define a valid swing point.
Paint Bars by Trend: Toggle bar coloring to match bullish or bearish bias.
Show Fading Trend Dots: Add fading dots that shrink and fade as a trend matures.
🔔 Alerts
Break of Structure Up / Down
Higher High (HH) confirmed
Higher Low (HL) confirmed
Lower High (LH) confirmed
Lower Low (LL) confirmed
🎯 Use Case
Perfect for:
Price action traders
Smart money concept (SMC) practitioners
Trend structure analysts
Scalpers and swing traders looking for quick structure flips.
🧠 Notes
Works on any timeframe and any instrument.
BOS signals update immediately when price breaks structure (no lag).
For additional BOS markers, you can uncomment the last few lines in the script to show arrows when structure breaks.

Order Block with BoSHere’s a professional and concise description you can use for publishing your **TradingView script** titled **"Order Block with BoS"**:
---
### 📌 **Description for TradingView Publication:**
**"Order Block with Break of Structure (BoS)"** is a powerful price action-based indicator designed to identify potential reversal zones and momentum shifts using **Order Block** detection combined with **Break of Structure (BoS)** confirmation.
### 🔍 **Key Features:**
* **Order Block Detection**: Highlights bullish and bearish order blocks using precise candle structure logic.
* **Break of Structure (BoS)**: Confirms structural breaks above swing highs or below swing lows to validate potential trend continuation or reversal.
* **Dynamic ATR Filter**: Uses a 14-period ATR with dynamic thresholds to confirm significant moves, filtering out weak breakouts.
* **Visual Aids**:
* Color-coded **boxes** to mark detected Order Blocks.
* **Arrows** at BoS confirmation points when ATR confirms strong momentum.
* Optional **dashed BoS lines** to show where price broke structure.
### ⚙️ **Customizable Inputs**:
* `Swing Length`: Defines the sensitivity of swing high/low detection.
* `Show Break of Structure`: Toggle on/off BoS confirmation lines.
* `Candle Lookback`: Number of historical candles to consider.
This indicator is ideal for traders who incorporate **smart money concepts**, **market structure analysis**, or **institutional order flow** strategies.
---
Would you like me to help write the **strategy** version of this or translate the description into another language for international audiences?

Dynamic Market Structure DetectorTitle: Dynamic Market Structure Detector – Real-Time BoS & ChoCH Signals
Short Description:
Identify market structure dynamically with real-time Break of Structure (BoS) and Change of Character (ChoCH) signals. Highlight untested support and resistance zones to improve trading precision.
Full Description:
The Dynamic Market Structure Detector is a powerful TradingView indicator designed for traders who want to automate the identification of key market structure levels. This indicator simplifies market analysis by dynamically tracking swing highs and lows, marking critical Break of Structure (BoS) and Change of Character (ChoCH) points, and highlighting untested support and resistance zones.
Key Features:
1. Real-Time Signals:
• Marks Break of Structure (BoS) and Change of Character (ChoCH) points as they occur.
• Automatically updates as the market evolves.
2. Dynamic Swing Highs and Lows:
• Tracks swing highs and lows based on user-defined sensitivity (Swing Length).
• Adjust swing length to tailor signals for intraday or swing trading.
3. Untested Zones Highlight:
• Visualize untested support and resistance zones dynamically.
• Opacity settings allow customization for better chart readability.
4. Customizable Inputs:
• Swing Length:
Adjust the sensitivity of BoS and ChoCH signals.
• Smaller Swing Length values (e.g., 3–5): Capture short-term market movements, ideal for intraday trading.
• Larger Swing Length values (e.g., 10–20): Focus on significant market structure changes for swing or positional trading.
Experiment with these values to find the best fit for your trading style.
• Untested Zone Opacity:
Control the visibility of highlighted support and resistance zones.
• Lower opacity values (e.g., 10–50): Make the zones more prominent, helpful for darker chart backgrounds.
• Higher opacity values (e.g., 70–90): Provide subtle highlights, better suited for lighter chart setups.
• A value of 100% renders the zones completely transparent (invisible).
Use this setting to customize the visual appearance of your chart while still retaining key zone information.
5. User-Friendly Visualization:
• Color-coded labels for BoS (Green) and ChoCH (Red).
• Highlight zones for untested areas using customizable colors (Support: Blue, Resistance: Orange).
Why Use This Indicator?
• Simplifies market structure analysis by automating key calculations.
• Helps traders identify potential trend reversals and continuation points.
• Reduces the need for manual charting, saving time and effort.
• Provides visual clarity on untested zones for better decision-making.
Recommended Usage:
• Intraday Traders: Use smaller Swing Length values (e.g., 3–5) to capture short-term market movements.
• Swing Traders: Opt for higher Swing Length values (e.g., 10–20) to focus on larger market structure changes.
• Monitor untested zones for potential price reactions, enhancing your trade entries and exits.
Notes :
This indicator is best suited for traders who prefer price action trading and market structure analysis. While the indicator provides reliable insights, it is recommended to use it in conjunction with other analysis tools for a holistic trading approach.
Credits:
Developed by TradeTech Analysis to empower traders with automated tools for smarter trading decisions.

Internal/External Market Structure [UAlgo]The "Internal/External Market Structure " indicator is a tool designed to identify and visualize internal and external market structure based on swing highs and lows. It helps traders understand short-term (internal) and long-term (external) price behavior.
🔶 What are ChoCH and BoS?
Change of Character (ChoCH)
Change of character refers to the reversal of market trend either from bullish to bearish or bearish to bullish. ChoCH is also a break of market structure but in opposite direction.
If market is in bullish trend but it breaks it previous (higher) low and makes a lower low, it will be termed a “bearish change of character” as price changed its trend from bullish to bearish.
Like wise if price is in bearish trend and it breaks its previous (lower) high making a higher high it will be marked as “bullish change of character” as price changed its trend from bearish to bullish.
Break of Structure (BoS)
When price breaks its structure in direction of previous trend its called break of structure (BoS). So its a trend continuation pattern.
As you know in bullish trend price makes higher highs. Each time when price break a previous high and marks a new high its known as bullish break of structure.
But in bearish trend price makes lower lows so every time when price breaks previous low and makes a new low it is called as bearish break of structure.
🔶 Key Features
Internal Swing Length: Allowing for fine-tuning of sensitivity to smaller, more frequent market movements.
External Swing Length: Focusing on capturing broader market trends.
The indicator differentiates between internal and external market structures, using different styles and colors to represent each. Internal structures are shown with solid lines, while external structures use dashed lines, providing clear visual cues.
Internal Market Structure:
The internal market structure focuses on shorter-term swings and is useful for identifying minor trend changes and short-term price movements. Breaks of internal swing highs or lows can indicate potential changes in the market's direction or momentum. The labels "CHoCH" and "BoS" help distinguish between changes in character and break of structure events, respectively.
External Market Structure:
The external market structure captures larger, more significant market moves. It is particularly useful for identifying major trend changes and key support and resistance levels. The dashed lines and corresponding labels "CHoCH+" and "BoS+" indicate more substantial shifts in market sentiment.
For BoS (Break of Structure):
For ChoCH (Change of Character):
🔶 Disclaimer
Use with Caution: This indicator is provided for educational and informational purposes only and should not be considered as financial advice. Users should exercise caution and perform their own analysis before making trading decisions based on the indicator's signals.
Not Financial Advice: The information provided by this indicator does not constitute financial advice, and the creator (UAlgo) shall not be held responsible for any trading losses incurred as a result of using this indicator.
Backtesting Recommended: Traders are encouraged to backtest the indicator thoroughly on historical data before using it in live trading to assess its performance and suitability for their trading strategies.
Risk Management: Trading involves inherent risks, and users should implement proper risk management strategies, including but not limited to stop-loss orders and position sizing, to mitigate potential losses.
No Guarantees: The accuracy and reliability of the indicator's signals cannot be guaranteed, as they are based on historical price data and past performance may not be indicative of future results.

UTS CORE + BOS + CHOCH – RR/TP/SL 📊 Indicator Working Principle
### 🔹 1. BOS (Break of Structure)
* **Definition:** Occurs when the price breaks the previous swing high or swing low level.
* **Interpretation:**
* If the last high is broken upwards → **Bullish BOS** (confirmation of uptrend).
* If the last low is broken downwards → **Bearish BOS** (confirmation of downtrend).
---
### 🔹 2. CHOCH (Change of Character)
* **Definition:** Indicates a trend reversal.
* **Interpretation:**
* In an uptrend, if the last low is broken downwards → **CHOCH↓** (start of downtrend).
* In a downtrend, if the last high is broken upwards → **CHOCH↑** (start of uptrend).
* **Chart:** Blue “CHOCH↑” labels on the chart mark trend reversals.
---
### 🔹 3. FVG (Fair Value Gap)
* **Definition:** A price gap formed between 3 candles.
* **Logic:**
* If the low of one candle stays above the high of the candle two bars back, a gap is created.
* Price tends to return to these gaps to “fill” them.
* **Chart:** The indicator highlights these gaps automatically (green/purple lines).
---
### 🔹 4. Signal Generation (BUY / SELL)
* A valid BOS or CHOCH confirmation + presence of FVG → **signal is triggered.**
* **Rules:**
* Upward break → **BUY signal**
* Downward break → **SELL signal**
* **Chart:** Red “SELL” and green “BUY” labels represent these trade signals.
---
### 🔹 5. RR – TP/SL Management
* When a trade is opened, the indicator automatically calculates **Entry, Stop Loss (SL), and Take Profits (TP1, TP2, TP3).**
* **Risk/Reward ratios:**
* TP1 = 1R
* TP2 = 2R
* TP3 = 3R
* If TP1 is hit and “Breakeven” option is enabled → SL moves to entry (risk-free trade).
---
👉 In short: this indicator tracks **market structure (BOS/CHOCH)**, detects **imbalances (FVG)**, and combines them with **risk/reward management (TP/SL)** to give you a ready-made trade

Trend Fib Zone Bounce (TFZB) [KedArc Quant]Description:
Trend Fib Zone Bounce (TFZB) trades with the latest confirmed Supply/Demand zone using a single, configurable Fib pullback (0.3/0.5/0.6). Trade only in the direction of the most recent zone and use a single, configurable fib level for pullback entries.
• Detects market structure via confirmed swing highs/lows using a rolling window.
• Draws Supply/Demand zones (bearish/bullish rectangles) from the latest MSS (CHOCH or BOS) event.
• Computes intra zone Fib guide rails and keeps them extended in real time.
• Triggers BUY only inside bullish zones and SELL only inside bearish zones when price touches the selected fib and closes back beyond it (bounce confirmation).
• Optional labels print BULL/BEAR + fib next to the triangle markers.
What it does
Finds structure using confirmed swing highs/lows (you choose the confirmation length).
Builds the latest zone (bullish = demand, bearish = supply) after a CHOCH/BOS event.
Draws intra-zone “guide rails” (Fib lines) and extends them live.
Signals only with the trend of that zone:
BUY inside a bullish zone when price tags the selected Fib and closes back above it.
SELL inside a bearish zone when price tags the selected Fib and closes back below it.
Optional labels print BULL/BEAR + Fib next to triangles for quick context
Why this is different
Most “zone + fib + signal” tools bolt together several indicators, or fire counter-trend signals because they don’t fully respect structure. TFZB is intentionally minimal:
Single bias source: the latest confirmed zone defines direction; nothing else overrides it.
Single entry rule: one Fib bounce (0.3/0.5/0.6 selectable) inside that zone—no counter-trend trades by design.
Clean visuals: you can show only the most recent zone, clamp overlap, and keep just the rails that matter.
Deterministic & transparent: every plot/label comes from the code you see—no external series or hidden smoothing
How it helps traders
Cuts decision noise: you always know the bias and the only entry that matters right now.
Forces discipline: if price isn’t inside the active zone, you don’t trade.
Adapts to volatility: pick 0.3 in strong trends, 0.5 as the default, 0.6 in chop.
Non-repainting zones: swings are confirmed after Structure Length bars, then used to build zones that extend forward (they don’t “teleport” later)
How it works (details)
*Structure confirmation
A swing high/low is only confirmed after Structure Length bars have elapsed; the dot is plotted back on the original bar using offset. Expect a confirmation delay of about Structure Length × timeframe.
*Zone creation
After a CHOCH/BOS (momentum shift / break of prior swing), TFZB draws the new Supply/Demand zone from the swing anchors and sets it active.
*Fib guide rails
Inside the active zone TFZB projects up to five Fib lines (defaults: 0.3 / 0.5 / 0.7) and extends them as time passes.
*Entry logic (with-trend only)
BUY: bar’s low ≤ fib and close > fib inside a bullish zone.
SELL: bar’s high ≥ fib and close < fib inside a bearish zone.
*Optionally restrict to one signal per zone to avoid over-trading.
(Optional) Aggressive confirm-bar entry
When do the swing dots print?
* The code confirms a swing only after `structureLen` bars have elapsed since that candidate high/low.
* On a 5-min chart with `structureLen = 10`, that’s about 50 minutes later.
* When the swing confirms, the script plots the dot back on the original bar (via `offset = -structureLen`). So you *see* the dot on the old bar, but it only appears on the chart once the confirming bar arrives.
> Practical takeaway: expect swing markers to appear roughly `structureLen × timeframe` later. Zones and signals are built from those confirmed swings.
Best timeframe for this Indicator
Use the timeframe that matches your holding period and the noise level of the instrument:
* Intraday :
* 5m or 15m are the sweet spots.
* Suggested `structureLen`:
* 5m: 10–14 (confirmation delay \~50–70 min)
* 15m: 8–10 (confirmation delay \~2–2.5 hours)
* Keep Entry Fib at 0.5 to start; try 0.3 in strong trends, 0.6 in chop.
* Tip: avoid the first 10–15 minutes after the open; let the initial volatility set the early structure.
* Swing/overnight:
* 1h or 4h.
* `structureLen`:
* 1h: 6–10 (6–10 hours confirmation)
* 4h: 5–8 (20–32 hours confirmation)
* 1m scalping: not recommended here—the confirmation lag relative to the noise makes zones less reliable.
Inputs (all groups)
Structure
• Show Swing Points (structureTog)
o Plots small dots on the bar where a swing point is confirmed (offset back by Structure Length).
• Structure Length (structureLen)
o Lookback used to confirm swing highs/lows and determine local structure. Higher = fewer, stronger swings; lower = more reactive.
Zones
• Show Last (zoneDispNum)
o Maximum number of zones kept on the chart when Display All Zones is off.
• Display All Zones (dispAll)
o If on, ignores Show Last and keeps all zones/levels.
• Zone Display (zoneFilter): Bullish Only / Bearish Only / Both
o Filters which zone types are drawn and eligible for signals.
• Clean Up Level Overlap (noOverlap)
o Prevents fib lines from overlapping when a new zone starts near the previous one (clamps line start/end times for readability).
Fib Levels
Each row controls whether a fib is drawn and how it looks:
• Toggle (f1Tog…f5Tog): Show/hide a given fib line.
• Level (f1Lvl…f5Lvl): Numeric ratio in . Defaults active: 0.3, 0.5, 0.7 (0 and 1 off by default).
• Line Style (f1Style…f5Style): Solid / Dashed / Dotted.
• Bull/Bear Colors (f#BullColor, f#BearColor): Per-fib color in bullish vs bearish zones.
Style
• Structure Color: Dot color for confirmed swing points.
• Bullish Zone Color / Bearish Zone Color: Rectangle fills (transparent by default).
Signals
• Entry Fib for Signals (entryFibSel): Choose 0.3, 0.5 (default), or 0.6 as the trigger line.
• Show Buy/Sell Signals (showSignals): Toggles triangle markers on/off.
• One Signal Per Zone (oneSignalPerZone): If on, suppresses additional entries within the same zone after the first trigger.
• Show Signal Text Labels (Bull/Bear + Fib) (showSignalLabels): Adds a small label next to each triangle showing zone bias and the fib used (e.g., BULL 0.5 or BEAR 0.3).
How TFZB decides signals
With trend only:
• BUY
1. Latest active zone is bullish.
2. Current bar’s close is inside the zone (between top and bottom).
3. The bar’s low ≤ selected fib and it closes > selected fib (bounce).
• SELL
1. Latest active zone is bearish.
2. Current bar’s close is inside the zone.
3. The bar’s high ≥ selected fib and it closes < selected fib.
Markers & labels
• BUY: triangle up below the bar; optional label “BULL 0.x” above it.
• SELL: triangle down above the bar; optional label “BEAR 0.x” below it.
Right-Panel Swing Log (Table)
What it is
A compact, auto-updating log of the most recent Swing High/Low events, printed in the top-right of the chart.
It helps you see when a pivot formed, when it was confirmed, and at what price—so you know the earliest bar a zone-based signal could have appeared.
Columns
Type – Swing High or Swing Low.
Date – Calendar date of the swing bar (follows the chart’s timezone).
Swing @ – Time of the original swing bar (where the dot is drawn).
Confirm @ – Time of the bar that confirmed that swing (≈ Structure Length × timeframe after the swing). This is also the earliest moment a new zone/entry can be considered.
Price – The swing price (high for SH, low for SL).
Why it’s useful
Clarity on repaint/confirmation: shows the natural delay between a swing forming and being usable—no guessing.
Planning & journaling: quick reference of today’s pivots and prices for notes/backtesting.
Scanning intraday: glance to see if you already have a confirmed zone (and therefore valid fib-bounce entries), or if you’re still waiting.
Context for signals: if a fib-bounce triangle appears before the time listed in Confirm @, it’s not a valid trade (you were too early).
Settings (Inputs → Logging)
Log swing times / Show table – turn the table on/off.
Rows to keep – how many recent entries to display.
Show labels on swing bar – optional tags on the chart (“Swing High 11:45”, “Confirm SH 14:15”) that match the table.
Recommended defaults
• Structure Length: 10–20 for intraday; 20–40 for swing.
• Entry Fib for Signals: 0.5 to start; try 0.3 in stronger trends and 0.6 in choppier markets.
• One Signal Per Zone: ON (prevents over trading).
• Zone Display: Both.
• Fib Lines: Keep 0.3/0.5/0.7 on; turn on 0 and 1 only if you need anchors.
Alerts
Two alert conditions are available:
• BUY signal – fires when a with trend bullish bounce at the selected fib occurs inside a bullish zone.
• SELL signal – fires when a with trend bearish bounce at the selected fib occurs inside a bearish zone.
Create alerts from the chart’s Alerts panel and select the desired condition. Use Once Per Bar Close to avoid intrabar flicker.
Notes & tips
• Swing dots are confirmed only after Structure Length bars, so they plot back in time; zones built from these confirmed swings do not repaint (though they extend as new bars form).
• If you don’t see a BUY where you expect one, check: (1) Is the active zone bullish? (2) Did the candle’s low actually pierce the selected fib and close above it? (3) Is One Signal Per Zone suppressing a second entry?
• You can hide visual clutter by reducing Show Last to 1–3 while keeping Display All Zones off.
Glossary
• CHOCH (Change of Character): A shift where price breaks beyond the last opposite swing while local momentum flips.
• BOS (Break of Structure): A cleaner break beyond the prior swing level in the current momentum direction.
• MSS: Either CHOCH or BOS – any event that spawns a new zone.
Extension ideas (optional)
• Add fib extensions (1.272 / 1.618) for target lines.
• Zone quality score using ATR normalization to filter weak impulses.
• HTF filter to only accept zones aligned with a higher timeframe trend.
⚠️ Disclaimer This script is provided for educational purposes only.
Past performance does not guarantee future results.
Trading involves risk, and users should exercise caution and use proper risk management when applying this strategy.

Structure From Start – MTF (body-close BOS)Displays higher-timeframe market structure from a chosen start date using body-close BOS logic, with trend state, guard levels, and BOS markers plotted on your current chart.
Multi-Timeframe Market Structure with Body-Close BOS Logic
This indicator tracks market structure from a chosen start date on a higher-timeframe (HTF) of your choice, then displays it on your current chart for intraday context.
It detects swing highs/lows using pivot logic, confirms Break of Structure (BOS) only when a candle closes beyond the swing level (body-close rule), and maintains the “valid swing” level that invalidates the current bias.
Key Features:
• Works on any HTF you select (e.g., H1, H4) while you operate on lower TFs like M5 or M1.
• Start reading structure from any date/time you choose for focused backtesting or scenario analysis.
• Highlights trend state (long/short/neutral) with background colors.
• Plots the active “guard” level (valid swing high/low) that would flip bias if broken.
• Marks BOS events directly on your trading TF, updating only when the HTF candle closes.
Ideal for combining a clear higher-timeframe bias with lower-timeframe execution, without manually tracking HTF structure changes during live markets.

Market Structure MTF Trend [Pt]█ Author's Notes
There are numerous market structure indicators in the TradingView library, each offering a unique approach to identifying price action shifts. Market Structure MTF Trend was created with simplicity and flexibility in mind—providing a highly customizable multi-timeframe setup, visually clear trendlines, and straightforward labeling. This combination helps both new and experienced traders easily spot and interpret market structure changes.
█ Overview
Market Structure MTF Trend is a powerful yet user-friendly indicator designed to identify and visualize key turning points in price action. It focuses on two core concepts:
Change of Character (CHoCH): A momentary shift in the market’s behavior, signaling that the current price movement may be losing momentum and could soon reverse.
Break of Structure (BoS): A more definitive event confirming a new price pattern, where the market establishes a fresh trend direction by surpassing previous swing highs or lows.
By combining these signals across up to four different timeframes, even traders unfamiliar with market structure can quickly learn to spot and validate potential trend reversals or continuations.
█ Key Features
Multi-Timeframe Analysis: Monitors CHoCH and BoS events simultaneously on multiple intervals (e.g., 15m, 30m, 60m, 240m), providing a clear, layered understanding of market dynamics.
Straightforward Visual Cues: Labels are placed directly on the chart at swing highs and lows, while colored bars at the bottom give an instant snapshot of whether each timeframe is bullish or bearish.
Configurable Timeframes & Pivot Strength: Easily set up the desired intervals and adjust pivot strength to tune how sensitive the indicator is to minor price fluctuations.
Color-Coded Signals: Different colors help you distinguish between potential early reversals (CHoCH) and confirmed shifts (BoS), ensuring each signal’s importance is immediately clear.
█ Usage & Benefits
Learn Market Structure Basics: For those new to swing highs/lows, CHoCH, and BoS, the script’s on-chart labels and dynamic bar coloring provide a practical, visual way to grasp these concepts.
Spot Reversals Early: CHoCH alerts you to possible shifts in momentum, allowing you to anticipate trend changes before they fully develop.
Confirm Trend Breaks: BoS events confirm that the market has established a new directional bias, reinforcing higher‐probability entry or exit points.
Reduce Noise & Stay Focused: The multi-timeframe setup ensures you won’t overlook larger trends or get lost in smaller fluctuations.
Streamline Decision-Making: Color-coded bars let you gauge overall market sentiment at a glance—ideal for quickly validating trades without juggling multiple charts.
Market Structure MTF Trend is perfect for traders who want to learn or refine their understanding of price action. By integrating multiple timeframes into a single, cohesive interface, this tool highlights both subtle shifts and confirmed breaks in market structure, empowering you to trade with greater insight and confidence.

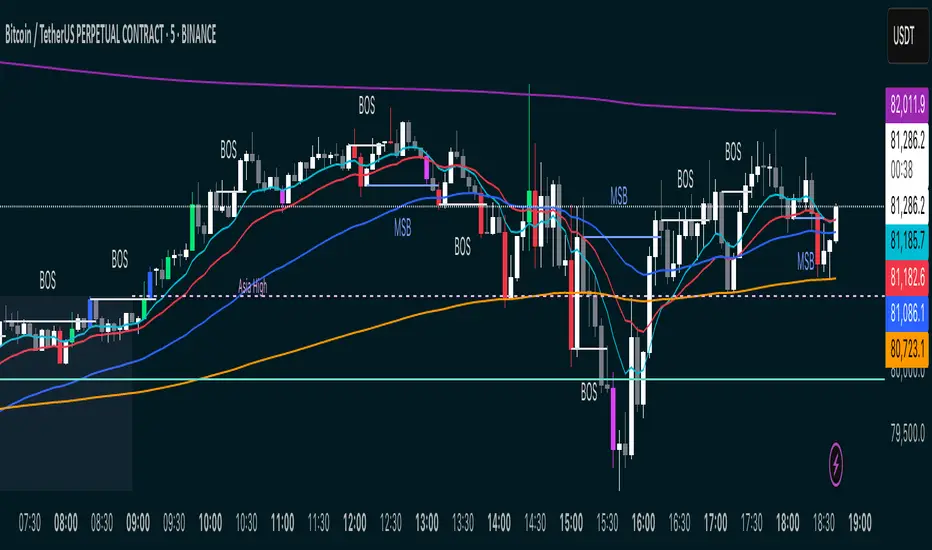
MSB BOS Market Structure [FTB]Track Market Structure Breaks (MSB) and Breaks of Structure (BOS) on your charts. This indicator does exactly that without clutter and with easy-to-spot.
🔑 Features:
MSB (Market Structure Break): Shows when price flips and breaks the previous high/low — possible start of a new trend.
BOS (Break of Structure): Highlights key structural breakouts in line with the existing trend.
✅ Pivot-Based Analysis (Body Focused)
Uses candle body-based pivot highs and lows to find clean market structure points (no wicks confusion here!).
Adjustable pivot strength — control how many candles you want on either side to define a swing.
✅ Clean Visual Markings
MSB and BOS lines with optional labels so you see exactly where breaks happen.
Customizable line style (Solid, Dashed, Dotted) to match your chart aesthetic.
Optional pivot markers to show minor swing highs/lows.
✅ Alerts Ready
Set alerts for any MSB or BOS, or filter to specific bullish/bearish breaks — never miss a key level again
💡 How to Use This Indicator:
Identify Trend Shifts: Use MSB to spot early trend reversals — when a previous structure breaks against the trend.
Catch Continuations: Watch for BOS to confirm trend continuation — great for riding the trend!
⚙️ Settings You Can Adjust:
Pivot Strength: How many candles to look back and forward for swing points (default: 3).
Show Pivots: Optional — highlight swing highs and lows for extra clarity.
EBL - Enigma BOS Logic: A Comprehensive Multi-Timeframe Trend anThe EBL (Enigma BOS Logic) script is designed for traders seeking an advanced and versatile tool for identifying market trends, breakouts, and critical price levels. This indicator leverages multi-timeframe analysis, trend filtering, and customizable guidance line settings to provide an all-in-one solution for informed trading decisions.
What Does EBL Do?
EBL identifies critical breakout levels (BOS - Break of Structure) on up to three selected timeframes and dynamically plots them as horizontal guidance lines. It combines these levels with trend analysis and user-defined filters to show only the most relevant data. The script offers flexibility to adapt to different trading styles, whether you're a scalper, day trader, or swing trader.
Key Features:
Multi-Timeframe Analysis:
Users can select three distinct timeframes (e.g., 4H, 30m, 15m).
Execution timeframe (e.g., 1m or 5m) overlays the lines from the selected higher timeframes for real-time precision.
Customizable Guidance Lines:
Define line length (horizontal bars) and choose whether lines extend to the current price.
Individual color settings for bullish and bearish lines.
Trend Detection Filter:
Automatically determines the overall market trend based on the 50-period SMA on each selected timeframe.
Displays only bullish lines during uptrends and bearish lines during downtrends.
Time-Limited Display:
Option to show only lines from the last three days, reducing clutter and focusing on recent price action.
Alerts:
Trigger alerts when price breaks above or below critical levels on any selected timeframe.
Users can choose to receive alerts only for specific timeframes.
How Does It Work?
Break of Structure (BOS):
The script captures key high and low levels on each selected timeframe.
Levels are dynamically updated as the market evolves.
Trend Filtering:
Trend direction is determined for each timeframe based on whether the close is above or below its 50-period SMA.
The overall trend combines signals from all three timeframes, providing a balanced and holistic view of the market.
User Control:
Customize everything: timeframes, colors, line behavior, and alert conditions.
Adjust filters to focus on your preferred time horizon (e.g., last 3 days).
How to Use:
Select up to three timeframes based on your trading strategy (e.g., 4H for macro view, 30m for intermediate trends, and 15m for precision).
Enable or disable the trend filter to control whether lines reflect the market's directional bias.
Configure alerts for breakout levels that align with your strategy.
Use the execution timeframe to see how higher timeframe levels interact with real-time price action.
Who Is It For?
This indicator is ideal for:
Trend Traders who want a clear view of directional bias across multiple timeframes.
Breakout Traders who need to identify key resistance and support levels dynamically.
Scalpers and Day Traders who require real-time precision by overlaying higher timeframe levels on lower execution timeframes.
Underlying Concepts:
Break of Structure (BOS): Highlights significant market pivot points, essential for identifying breakout opportunities.
Multi-Timeframe Confluence: Combines insights from various timeframes to create a balanced understanding of price behavior.
Trend Filtering: Ensures clarity by only displaying levels that align with the overall market direction.
EBL - Enigma BOS Logic is not just another breakout indicator. It is a comprehensive tool that combines multi-timeframe analysis, trend detection, and user-centric customization to empower traders with actionable insights. Whether you're analyzing macro trends or executing precision trades, EBL adapts to your strategy and provides clarity in the chaos of the market.

Lumiere’s Indicator BundleThe Lumiere’s Indicator Bundle combines three of Lumiere’s most used tools into one script:
🔹 BOS Mark-out – Marks Breaks of Structure with clear bullish/bearish levels and optional alerts.
🔹 Liquidity Mark-ou t – Draws significant swing highs/lows and automatically removes them once swept.
🔹 Trading Session High/Low – Tracks Asia, London, and New York session ranges with customizable timezone.
Why this bundle?
I made this bundle so everyone can run all my indicators at once without having to pick and choose between them or worry about chart space limits.
Instead of loading 3 separate indicators, this package gives you everything in one place. You can toggle each module (BOS, Liquidity, Sessions) on or off from the settings. All inputs are kept clean and organized in their own sections for easy adjustments.
What to expect
BOS lines always plotted on top for maximum clarity.
Liquidity highs/lows update in real time and get removed when taken out.
Session ranges show the active session’s high/low and can mark sweeps after the session closes.
Default timezone is New York (UTC-4), but you can switch to any TradingView-supported timezone.
BOS alerts are included, so you’ll never miss a structural break.

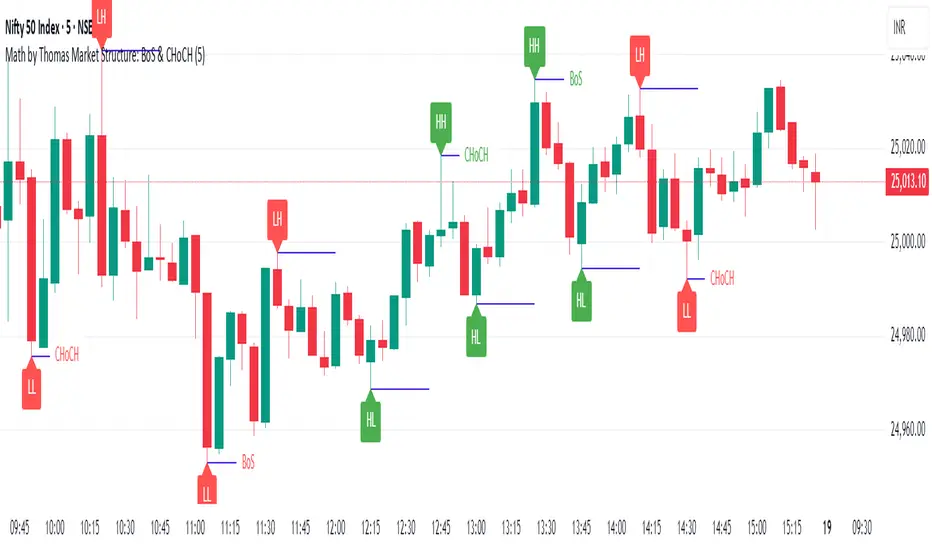
Market Structure: BoS & CHoCH (Math by Thomas)📌 Description:
Market Structure: BoS & CHoCH (Math by Thomas) is a clean and reliable market structure tool designed to visually mark Swing Highs, Swing Lows, and classify each one as HH (Higher High), LH (Lower High), LL (Lower Low), or HL (Higher Low) based on price action. It also detects and labels Break of Structure (BoS) and Change of Character (CHoCH) to help identify potential continuation or reversal in trend.
🛠️ How to Use:
Add the indicator to your chart (works on any timeframe and asset).
Adjust the "Swing Sensitivity" input to fine-tune how many bars the script uses to detect a swing high/low. A higher number smooths out noise.
The script will automatically:
Mark every confirmed swing high or low with a solid line.
Label the swing as HH, LH, HL, or LL depending on its relative position.
Show BoS (trend continuation) or CHoCH (trend reversal) labels with the current trend direction.
Toggle labels or lines on or off with the corresponding checkboxes in settings.
🔍 Tip:
Use this indicator alongside other tools like volume or RSI for more confident entries. A CHoCH followed by two BoS in the same direction often signals a strong trend reversal.
Market Structure (Intrabar) [LuxAlgo]The Market Structure (Intrabar) indicator is designed to automatically detect and highlight real-time intrabar market structures, a core component of the Smart Money Concepts methodology.
🔶 USAGE
The proposed indicator gives a detailed picture of the most recent candle lower timeframe trends, highlighting market structures within them.
This can be particularly useful to assess the price dynamic within the most recent candle. For example, we can see how pronounced a trend is by the number of opposite bullish/bearish market structures formed within the candle.
Users can select the intrabar timeframe of interest from the "Intrabar Timeframe" setting, using a timeframe significantly lower than the chart timeframe will return more intrabar candles and potentially more market structures.
🔹 Dashboard
Users have access to a dashboard returning useful statistics such as the number of formed CHoCH's and BOS's from the intrabar prices. These can be indicative of how predominant a trend is within the intrabar data or if there exist multiple trends.
🔶 DETAILS
Market structures allow determining trend continuations as well as trend reversals in the market through two distinct structures:
🔹 Change of Character (CHoCH)
A change of character (CHoCH) refers to a shift in the market behavior of a security that is driven by changes in the underlying supply and demand dynamics. CHoCH's are indicative of confirmed reversals.
🔹 Break of Structure (BoS)
The break of structure (BoS) refers to the point at which a key level of support or resistance is broken. BOS's are indicative of confirmed trend continuations.
🔶 SETTINGS
🔹Inside the Bar Market Structure
Intrabar Timeframe: Lower timeframe setting option, if set to 'Auto' the script will determine the lower timeframe based on the chart timeframe.
Intrabar Market Structure, Length: Toggles the visibility of the break of structures and change of characters. Length defines the detection length of the swing levels.
Intrabar Swing Levels: Toggles the visibility of the swing levels, including a color customization option for highs and lows.
Intrabar Statistics: Toggles the visibility of the dashboard. Some further statistical details are presented in the tooltips of the table cells
🔹 General
Market Structure Colors: Color customization option for the break of structure and change of character lines and labels.
Intrabar Candle Colors: Color customization option for intrabar candles.
Intrabar Candles Horizontal Offset: Adjusting the intrabar candles horizontal position
Dashboard: Dashboard position and size customization option
🔶 LIMITATIONS
Please note that seconds-based intervals are available for premium and professional plan holders, which implies that the seconds-based intervals usage of the indicator may not be available for all users depending on their subscription plan.
🔶 RELATED SCRIPTS
Smart-Money-Concepts
ICT-Concepts

Mark StructureMark Structure is building the market swing structure, minor and sub structure and marks all possible insignificant pivots
Building such structure is really complex task to do, that has a lot of obstacles and challenges. I'm doing my best to develop this indicator behaving in absolutely expectable and right way. Fill free to leave any comments or bug reports.
it supports:
- Marking all pivots with labels or join them continuously with trend lines.
- Marking minor and sub structured swings with labels or join them continuously with trend lines. Marking BOS or SMS BOS, which are mbos. Minor and substructure are structures inside swing structure and it can differ from the structure of lower timeframe
- Marking swings of swing structure with labels or join them continuously with trend lines. Marking BOS or SMS BOS of swing structure
- Changing bullish and bearish colors of each kind of structures
- Changing pivot labelings
- Changing colors of BOSs
Remarks:
- As I told you guys before, it has a lot of challenging cases. eg we have swing low and high on the same candle and in order to decide which pivot goes first I take lower time frame data to figure out what pivot is the first, but it happens that on lower time frame the same issue takes place, due to limitation of TradingView I can't go infinitely to lower timeframes to solve this issue, so I mark those cases with labels
- Another issue is very beginning of the trend its hard to detect swing structure there due to missing historical data. so skip a few waves in the very beginning
- Don't expect to have minor and sub structure in each swing waves, its totally fine when you don't have them at all
- Swing structure is the most significant structure and shows real price direction. Trend change is confirmed when for bull->bear the last HLbull LH>HH and HH-HL-HH are confirmed. You can change labelling for unconfirmed swing trend in the settings. By default its already done
