Divergence IQ [TradingIQ]Hello Traders!
Introducing "Divergence IQ"
Divergence IQ lets traders identify divergences between price action and almost ANY TradingView technical indicator. This tool is designed to help you spot potential trend reversals and continuation patterns with a range of configurable features.
Features
Divergence Detection
Detects both regular and hidden divergences for bullish and bearish setups by comparing price movements with changes in the indicator.
Offers two detection methods: one based on classic pivot point analysis and another that provides immediate divergence signals.
Option to use closing prices for divergence detection, allowing you to choose the data that best fits your strategy.
Normalization Options:
Includes multiple normalization techniques such as robust scaling, rolling Z-score, rolling min-max, or no normalization at all.
Adjustable normalization window lets you customize the indicator to suit various market conditions.
Option to display the normalized indicator on the chart for clearer visual comparison.
Allows traders to take indicators that aren't oscillators, and convert them into an oscillator - allowing for better divergence detection.
Simulated Trade Management:
Integrates simulated trade entries and exits based on divergence signals to demonstrate potential trading outcomes.
Customizable exit strategies with options for ATR-based or percentage-based stop loss and profit target settings.
Automatically calculates key trade metrics such as profit percentage, win rate, profit factor, and total trade count.
Visual Enhancements and On-Chart Displays:
Color-coded signals differentiate between bullish, bearish, hidden bullish, and hidden bearish divergence setups.
On-chart labels, lines, and gradient flow visualizations clearly mark divergence signals, entry points, and exit levels.
Configurable settings let you choose whether to display divergence signals on the price chart or in a separate pane.
Performance Metrics Table:
A performance table dynamically displays important statistics like profit, win rate, profit factor, and number of trades.
This feature offers an at-a-glance assessment of how the divergence-based strategy is performing.
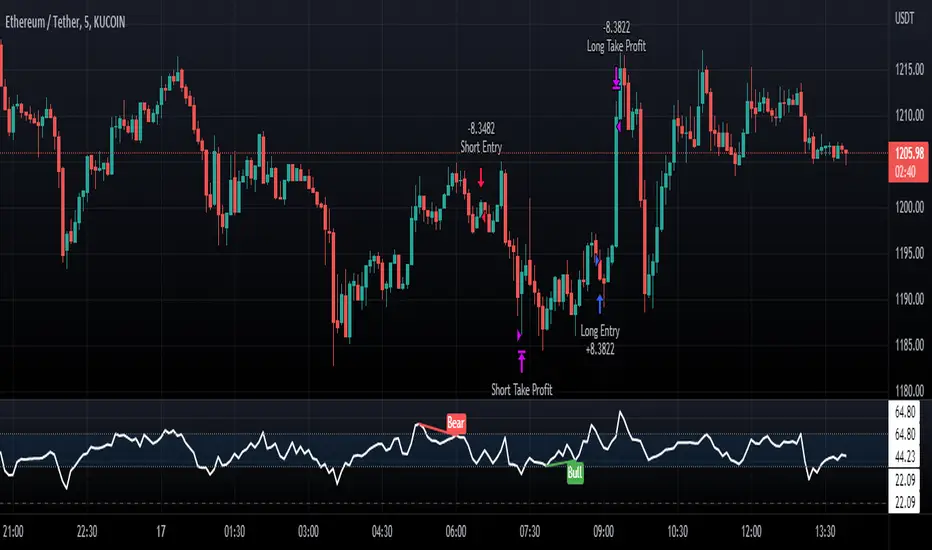
The image above shows Divergence IQ successfully identifying and trading a bullish divergence between an indicator and price action!
The image above shows Divergence IQ successfully identifying and trading a bearish divergence between an indicator and price action!
The image above shows Divergence IQ successfully identifying and trading a hidden bullish divergence between an indicator and price action!
The image above shows Divergence IQ successfully identifying and trading a hidden bearish divergence between an indicator and price action!
The performance table is designed to provide a clear summary of simulated trade results based on divergence setups. You can easily review key metrics to assess the strategy’s effectiveness over different time periods.
Customization and Adaptability
Divergence IQ offers a wide range of configurable settings to tailor the indicator to your personal trading approach. You can adjust the lookback and lookahead periods for pivot detection, select your preferred method for normalization, and modify trade exit parameters to manage risk according to your strategy. The tool’s clear visual elements and comprehensive performance metrics make it a useful addition to your technical analysis toolbox.
The image above shows Divergence IQ identifying divergences between price action and OBV with no normalization technique applied.
While traders can look for divergences between OBV and price, OBV doesn't naturally behave like an oscillator, with no definable upper and lower threshold, OBV can infinitely increase or decrease.
With Divergence IQ's ability to normalize any indicator, traders can normalize non-oscillator technical indicators such as OBV, CVD, MACD, or even a moving average.
In the image above, the "Robust Scaling" normalization technique is selected. Consequently, the output of OBV has changed and is now behaving similar to an oscillator-like technical indicator. This makes spotting divergences between the indicator and price easier and more appropriate.
The three normalization techniques included will change the indicator's final output to be more compatible with divergence detection.
This feature can be used with almost any technical indicator.
Stop Type
Traders can select between ATR based profit targets and stop losses, or percentage based profit targets and stop losses.
The image above shows options for the feature.
Divergence Detection Method
A natural pitfall of divergence trading is that it generally takes several bars to "confirm" a divergence. This makes trading the divergence complicated, because the entry at time of the divergence might look great; however, the divergence wasn't actually signaled until several bars later.
To circumvent this issue, Divergence IQ offers two divergence detection mechanisms.
Pivot Detection
Pivot detection mode is the same as almost every divergence indicator on TradingView. The Pivots High Low indicator is used to detect market/indicator highs and lows and, consequently, divergences.
This method generally finds the "best looking" divergences, but will always take additional time to confirm the divergence.
Immediate Detection
Immediate detection mode attempts to reduce lag between the divergence and its confirmation to as little as possible while avoiding repainting.
Immediate detection mode still uses the Pivots Detection model to find the first high/low of a divergence. However, the most recent high/low does not utilize the Pivot Detection model, and instead immediately looks for a divergence between price and an indicator.
Immediate Detection Mode will always signal a divergence one bar after it's occurred, and traders can set alerts in this mode to be alerted as soon as the divergence occurs.
TradingView Backtester Integration
Divergence IQ is fully compatible with the TradingView backtester!
Divergence IQ isn’t designed to be a “profitable strategy” for users to trade. Instead, the intention of including the backtester is to let users backtest divergence-based trading strategies between the asset on their chart and almost any technical indicator, and to see if divergences have any predictive utility in that market.
So while the backtester is available in Divergence IQ, it’s for users to personally figure out if they should consider a divergence an actionable insight, and not a solicitation that Divergence IQ is a profitable trading strategy. Divergence IQ should be thought of as a Divergence backtesting toolkit, not a full-feature trading strategy.
Strategy Properties Used For Backtest
Initial Capital: $1000 - a realistic amount of starting capital that will resonate with many traders
Amount Per Trade: 5% of equity - a realistic amount of capital to invest relative to portfolio size
Commission: 0.02% - a conservative amount of commission to pay for trade that is standard in crypto trading, and very high for other markets.
Slippage: 1 tick - appropriate for liquid markets, but must be increased in markets with low activity.
Once more, the backtester is meant for traders to personally figure out if divergences are actionable trading signals on the market they wish to trade with the indicator they wish to use.
And that's all!
If you have any cool features you think can benefit Divergence IQ - please feel free to share them!
Thank you so much TradingView community!
在腳本中搜尋"Divergence"

Divergence Strategy [Trendoscope®]🎲 Overview
The Divergence Strategy is a sophisticated TradingView strategy that enhances the Divergence Screener by adding automated trade signal generation, risk management, and trade visualization. It leverages the screener’s robust divergence detection to identify bullish, bearish, regular, and hidden divergences, then executes trades with precise entry, stop-loss, and take-profit levels. Designed for traders seeking automated trading solutions, this strategy offers customizable trade parameters and visual feedback to optimize performance across various markets and timeframes.
For core divergence detection features, including oscillator options, trend detection methods, zigzag pivot analysis, and visualization, refer to the Divergence Screener documentation. This description focuses on the strategy-specific enhancements for automated trading and risk management.
🎲 Strategy Features
🎯Automated Trade Signal Generation
Trade Direction Control : Restrict trades to long-only or short-only to align with market bias or strategy goals, preventing conflicting orders.
Divergence Type Selection : Choose to trade regular divergences (bullish/bearish), hidden divergences, or both, targeting reversals or trend continuations.
Entry Type Options :
Cautious : Enters conservatively at pivot points and exits quickly to minimize risk exposure.
Confident : Enters aggressively at the latest price and holds longer to capture larger moves.
Mixed : Combines conservative entries with delayed exits for a balanced approach.
Market vs. Stop Orders: Opt for market orders for instant execution or stop orders for precise price entry.
🎯 Enhanced Risk Management
Risk/Reward Ratio : Define a risk-reward ratio (default: 2.0) to set profit targets relative to stop-loss levels, ensuring consistent trade sizing.
Bracket Orders : Trades include entry, stop-loss, and take-profit levels calculated from divergence pivot points, tailored to the entry type and risk-reward settings.
Stop-Loss Placement : Stops are strategically set (e.g., at recent pivot or last price point) based on entry type, balancing risk and trade validity.
Order Cancellation : Optionally cancel pending orders when a divergence is broken (e.g., price moves past the pivot in the wrong direction), reducing invalid trades. This feature is toggleable for flexibility.
🎯 Trade Visualization
Target and Stop Boxes : Displays take-profit (lime) and stop-loss (orange) levels as boxes on the price chart, extending 10 bars forward for clear visibility.
Dynamic Trade Updates : Trade visualizations are added, updated, or removed as trades are executed, canceled, or invalidated, ensuring accurate feedback.
Overlay Integration : Trade levels overlay the price chart, complementing the screener’s oscillator-based divergence lines and labels.
🎯 Strategy Default Configuration
Capital and Sizing : Set initial capital (default: $1,000,000) and position size (default: 20% of equity) for realistic backtesting.
Pyramiding : Allows up to 4 concurrent trades, enabling multiple divergence-based entries in trending markets.
Commission and Margin : Accounts for commission (default: 0.01%) and margin (100% for long/short) to reflect trading costs.
Performance Optimization : Processes up to 5,000 bars dynamically, balancing historical analysis and real-time execution.
🎲 Inputs and Configuration
🎯Trade Settings
Direction : Select Long or Short (default: Long).
Divergence : Trade Regular, Hidden, or Both divergence types (default: Both).
Entry/Exit Type : Choose Cautious, Confident, or Mixed (default: Cautious).
Risk/Reward : Set the risk-reward ratio for profit targets (default: 2.0).
Use Market Order : Enable market orders for immediate entry (default: false, uses limit orders).
Cancel On Break : Cancel pending orders when divergence is broken (default: true).
🎯Inherited Settings
The strategy inherits all inputs from the Divergence Screener, including:
Oscillator Settings : Oscillator type (e.g., RSI, CCI), length, and external oscillator option.
Trend Settings : Trend detection method (Zigzag, MA Difference, External), MA type, and length.
Zigzag Settings : Zigzag length (fixed repaint = true).
🎲 Entry/Exit Types for Divergence Scenarios
The Divergence Strategy offers three Entry/Exit Type options—Cautious, Confident, and Mixed—which determine how trades are entered and exited based on divergence pivot points. This section explains how these settings apply to different divergence scenarios, with placeholders for screenshots to illustrate each case.
The divergence pattern forms after 3 pivots. The stop and entry levels are formed on one of these levels based on Entry/Exit types.
🎯Bullish Divergence (Reversal)
A bullish divergence occurs when price forms a lower low, but the oscillator forms a higher low, signaling a potential upward reversal.
💎 Cautious:
Entry : At the pivot high point for a conservative entry.
Exit : Stop-loss at the last pivot point (previous low that is higher than the current pivot low); take-profit at risk-reward ratio. Canceled if price breaks below the pivot (if Cancel On Break is enabled).
Behavior : Enters after confirmation and exits quickly to limit downside risk.
💎Confident:
Entry : At the last pivot low, (previous low which is higher than the current pivot low) for an aggressive entry.
Exit : Stop-loss at recent pivot low, which is the lowest point; take-profit at risk-reward ratio. Canceled if price breaks below the pivot. (lazy exit)
Behavior : Enters early to capture trend continuation, holding longer for gains.
💎Mixed:
Entry : At the pivot high point (conservative).
Exit : Stop-loss at the recent pivot point that has resulted in lower low (lazy exit). Canceled if price breaks below the pivot.
Behavior : Balances entry caution with extended holding for trend continuation.
🎯Bearish Divergence (Reversal)
A bearish divergence occurs when price forms a higher high, but the oscillator forms a lower high, indicating a potential downward reversal.
💎Cautious:
Entry : At the pivot low point (lower high) for a conservative short entry.
Exit : Stop-loss at the previous pivot high point (previous high); take-profit at risk-reward ratio. Canceled if price breaks above the pivot (if Cancel On Break is enabled).
Behavior : Enters conservatively and exits quickly to minimize risk.
💎Confident:
Entry : At the last price point (previous high) for an aggressive short entry.
Exit : Stop-loss at the pivot point; take-profit at risk-reward ratio. Canceled if price breaks above the pivot.
Behavior : Enters early to maximize trend continuation, holding longer.
💎Mixed:
Entry : At the previous piot high point (conservative).
Exit : Stop-loss at the last price point (delayed exit). Canceled if price breaks above the pivot.
Behavior : Combines conservative entry with extended holding for downtrend gains.
🎯Bullish Hidden Divergence (Continuation)
A bullish hidden divergence occurs when price forms a higher low, but the oscillator forms a lower low, suggesting uptrend continuation. In case of Hidden bullish divergence, b]Entry is always on the previous pivot high (unless it is a market order)
💎Cautious:
Exit : Stop-loss at the recent pivot low point (higher than previous pivot low); take-profit at risk-reward ratio. Canceled if price breaks below the pivot (if Cancel On Break is enabled).
Behavior : Enters after confirmation and exits quickly to limit downside risk.
💎Confident:
Exit : Stop-loss at previous pivot low, which is the lowest point; take-profit at risk-reward ratio. Canceled if price breaks below the pivot. (lazy exit)
Behavior : Enters early to capture trend continuation, holding longer for gains.
🎯Bearish Hidden Divergence (Continuation)
A bearish hidden divergence occurs when price forms a lower high, but the oscillator forms a higher high, suggesting downtrend continuation. In case of Hidden Bearish divergence, b]Entry is always on the previous pivot low (unless it is a market order)
💎Cautious:
Exit : Stop-loss at the latest pivot high point (which is a lower high); take-profit at risk-reward ratio. Canceled if price breaks above the pivot (if Cancel On Break is enabled).
Behavior : Enters conservatively and exits quickly to minimize risk.
💎Confident/Mixed:
Exit : Stop-loss at the previous pivot high point; take-profit at risk-reward ratio. Canceled if price breaks above the pivot.
Behavior : Uses the late exit point to hold longer.
🎲 Usage Instructions
🎯Add to Chart:
Add the Divergence Strategy to your TradingView chart.
The oscillator and divergence signals appear in a separate pane, with trade levels (target/stop boxes) overlaid on the price chart.
🎯Configure Settings:
Adjust trade settings (direction, divergence type, entry type, risk-reward, market orders, cancel on break).
Modify inherited Divergence Screener settings (oscillator, trend method, zigzag length) as needed.
Enable/disable alerts for divergence notifications.
🎯Interpret Signals:
Long Trades: Triggered on bullish or bullish hidden divergences (if allowed), shown with green/lime lines and labels.
Short Trades: Triggered on bearish or bearish hidden divergences (if allowed), shown with red/orange lines and labels.
Monitor lime (target) and orange (stop) boxes for trade levels.
Review strategy performance metrics (e.g., profit/loss, win rate) in the strategy tester.
🎯Backtest and Optimize:
Use TradingView’s strategy tester to evaluate performance on historical data.
Fine-tune risk-reward, entry type, position sizing, and cancellation settings to suit your market and timeframe.
For questions, suggestions, or support, contact Trendoscope via TradingView or official support channels. Stay tuned for updates and enhancements to the Divergence Strategy!

Divergence for Many [Dimkud - v5]Strategy is based on "Divergence for Many Indicators v4 ST" strategy by CannyTolany01
which is based on "Divergence for Many Indicator" indicator by LonesomeTheBlue
This strategy is searching for divergences on 18 indicators which you can select and optimise one by one.
Additionally you can connect any other External Indicator value. (just add this indicator the the chart and select option in settings)
To the original indicator/strategy I have added 9 additional indicators:
( Money Flow Index, Williams_Vix, Stochastic RSI , SMI Ergodic Oscillator, Volume Weighted MACD , Bull Bear Power, Balance of Power , Relative Volatility Index , Logistic Settings).
Converted strategy to v5 of Pine Script.
Added Static SL/TP in percents (%).
Added filters to filter enters:
1. Volume Weighted MACD - Multi-TimeFrame Filter
(It checks for histogram to falling or rising for a set periods of bars)
2. Money Flow Index - Multi-TimeFrame Filter
(It checks if MFI Oscillator is in the set diapason.
Also It checks if MFI is falling or rising for a set periods of bars )
3. ATR filter
(check changes in fast ATR to slow ATR )
Strategy shows good backtest results on many crypto tokens on 45m - 1h periods. (with parameters optimisation for every indicator)
To find best parameters - you can enable indicators one-by one, and optimise best parameters for each of them.
Then enable all indicators with successful results.
Optimise SL/TP.
Then try to enable and optimise filters (channels etc.)
The better is to optimise parameters separately for Short and Long trading. And run two separate bots (in settings enable only Long or only Short.)
Updates:
- Added visualisation for open trades (SL/TP)
- Added Volatility filter by ATR with many options for tests.
- Fixed some small bugs.
- Added second RSI filter (you can use two RSIs with different TF or settings)
- Updated ATR volatility and MFI filter. Removed non-effective options
- Added CCI filter
- Added option to Enable/Disable visualisation of TP/SL on chart
- Fixed one small quick bug. ("ATR filter short" was not working)
- Added Super Trend filter
- Added Momentum filter
- Added Volume Filter
- All "request.security" MultiTimeFrame calls changed to 100% non-repait function "f_security()"

Divergence for Many Indicators v4 STHello Traders.
This is the Strategy version of Divergence for Many Indicators v4, an easy and comfortable indicator.
- - - -
*It's been modified a little bit from the original.
*I got permission from the original author.
*I'm not good at English, I'm sorry.
- - - -
< 4 things to check >
1. Since repainting is not performed, the first imprinted signal can be accurately seen.
2. It does not respond to continuous diversions.
3. If the opposite diversity is not imprinted, caution is required as it is designed not to indicate liquidation. Be careful when reading the figures shown in the strategy tester.
4. Added stop loss and take propirane.
< What changed? >
1. pivot period 5 - > 9
2. Money Flow index and Chaikin Money Flow are released.
- - - -
KOR SUB
< 4가지 확인 사항 >
1. 리페인팅이 없으므로 첫 번째로 각인된 신호를 정확히 볼 수 있습니다.
2. 연속된 다이버젼스에 대해서는 반응하지 않습니다.
3. 반대의 다이버젼스가 각인되지 않으면 청산 표시를 하지 않도록 설계되어 있으므로 주의를 요합니다.
4. 스탑 로스와 테이크 프로핏 항목을 추가하였습니다.
< 무엇이 변경되었나? >
1. 피봇 페리어드 값이 조금 수정되었습니다.
2. MFI & CMF 가 체크 해제된 상태입니다.
THANK YOU ^^

Pro Divergence [regular + hidden] by TradingClue█ Pro Divergence is my new divergence-based toolkit that will help you to spot lucrative opportunities in all kinds of markets.
I've developed toolkits and strategies that use divergences for many years, e.g. AutoDivergence and CCIDivergence . Pro Divergence is my latest development and benefits from those yearlong experiences.
The main algorithm to detect divergences has changed from using linear regressions and moving averages to algorithmic trendline detection like I've been using in TD Lines .
This new approach supports the detection of regular divergences but also hidden divergences can be identified.
Before going more into the details of the mechanics of Pro Divergence, let's recap, what divergences are all about when it comes to trading.
█ Regular Divergence
The basic idea is pretty simple: If price goes in the opposite direction than some other technical indicator - in most cases an oscillator - we speak of a divergence. A regular divergence might be a signal for a trend reversal. That's it.
For example, if the price is currently rising, while at the same time Momentum is falling - it might be time for a reversal and the price of an asset is about to fall soon. If there are additional indications to confirm the signal, e.g. if RSI is in the overbought area, it might be a good idea to go short on that specific asset.
Regular bullish divergences are indicated when price is forming lower lows while an oscillator shows higher lows.
Regular bearish divergences are indicated when price is forming higher highs while an oscillator shows lower highs.
█ Hidden Divergence
While regular divergences indicate trend reversals, hidden divergences indicate a trend continuation.
When the price is making higher lows and the oscillator is showing lower lows, we speak of a bullish hidden divergence. When the price is making lower highs and the oscillator shows higher highs, it's a bearish hidden divergence.
These rules for identifying divergences are pretty simple and straightforward. And they are also confusing at times. But that's what Pro Divergence is helping you with: trade based on customizable signals to identify all kinds of divergences.
You could either use the strategy settings of the toolkit to optimize the properties to show winning backtesting results. Or you use the signals as an extra confirmation to some other kind of signal/ strategy you are working with.
█ Summary of all current features
• Oscillator: choose between CCI, Momentum, MACD, or RSI. All oscillators-settings are customizable.
• RSI-filter: in some cases, the quality of the signals can be improved by an RSI filter, e.g. a bullish signal would only be valid if RSI is in the oversold area. Set the RSI period and the oversold/ overbought levels to your preferred values.
• You can display all divergences on the chart to get an idea of the current price action. Or you can pick any combination of signals you would like to include in a backtest. Possible signals are: regular bullish divergence, regular bearish divergence, hidden bullish divergence, hidden bearish divergence
• Exits: there are many ways to get exit signals - combinations of the below options are possible:
• fixed profit targets/ stop losses based on ticks
• Exit when momentum reverses
• Exit when price touches the opposite Bollinger Band (e.g. a long position will be closed when price touches the upper Bollinger Band). The settings for the Bollinger Bands are customizable.
• Entry: you can choose only to enter a trade if momentum is going in the same direction as the direction of your trade (e.g. only go long if momentum is rising)
• time and date filer
• Do a backtest only in a given time range (maybe you're not interested in the whole range of historical data when trading in a higher timeframe. Or you would like to do some kind of walk forward analysis)
• Only trade during special times of a day, e.g. only trade during the first hours of a trading session
Since this strategy is making heavy use of math and technical indicators, it is not tied to a certain asset class or timeframe. It was tested successfully on a large number of financial instruments like stocks, crypto, forex, and others.

RSI Divergence Strategy - AliferCryptoStrategy Overview
The RSI Divergence Strategy is designed to identify potential reversals by detecting regular bullish and bearish divergences between price action and the Relative Strength Index (RSI). It automatically enters positions when a divergence is confirmed and manages risk with configurable stop-loss and take-profit levels.
Key Features
Automatic Divergence Detection: Scans for RSI pivot lows/highs vs. price pivots using user-defined lookback windows and bar ranges.
Dual SL/TP Methods:
- Swing-based: Stops placed a configurable percentage beyond the most recent swing high/low.
- ATR-based: Stops placed at a multiple of Average True Range, with a separate risk/reward multiplier.
Long and Short Entries: Buys on bullish divergences; sells short on bearish divergences.
Fully Customizable: Input groups for RSI, divergence, swing, ATR, and general SL/TP settings.
Visual Plotting: Marks divergences on chart and plots stop-loss (red) and take-profit (green) lines for active trades.
Alerts: Built-in alert conditions for both bullish and bearish RSI divergences.
Detailed Logic
RSI Calculation: Computes RSI of chosen source over a specified period.
Pivot Detection:
- Identifies RSI pivot lows/highs by scanning a lookback window to the left and right.
- Uses ta.barssince to ensure pivots are separated by a minimum/maximum number of bars.
Divergence Confirmation:
- Bullish: Price makes a lower low while RSI makes a higher low.
- Bearish: Price makes a higher high while RSI makes a lower high.
Entry:
- Opens a Long position when bullish divergence is true.
- Opens a Short position when bearish divergence is true.
Stop-Loss & Take-Profit:
- Swing Method: Computes the recent swing high/low then adjusts by a percentage margin.
- ATR Method: Uses the current ATR × multiplier applied to the entry price.
- Take-Profit: Calculated as entry price ± (risk × R/R ratio).
Exit Orders: Uses strategy.exit to place bracket orders (stop + limit) for both long and short positions.
Inputs and Configuration
RSI Settings: Length & price source for the RSI.
Divergence Settings: Pivot lookback parameters and valid bar ranges.
SL/TP Settings: Choice between Swing or ATR method.
Swing Settings: Swing lookback length, margin (%), and risk/reward ratio.
ATR Settings: ATR length, stop multiplier, and risk/reward ratio.
Usage Notes
Adjust the Pivot Lookback and Range values to suit the volatility and timeframe of your market.
Use higher ATR multipliers for wider stops in choppy conditions, or tighten swing margins in trending markets.
Backtest different R/R ratios to find the balance between win rate and reward.
Disclaimer
This script is for educational purposes only and does not constitute financial advice. Trading carries significant risk and you may lose more than your initial investment. Always conduct your own research and consider consulting a professional before making any trading decisions.

Bullish Divergence Short-term Long Trade FinderThis script is a Bullish divergence trade finder built to find small periods where Bitcoin will likely rise from. It looks for bullish divergence followed by a higher low as long as the hour RSI value is below the 40 mark, if then it will enter an long. It marks out Buy signals on the RSI if the value dips below 'RSI Bull Condition Minimum' (Default 40) on the current time frame in view. It also marks out Sell signals found when the RSI is above the 'RSI Bearish Condition Minimum' (Default 50). The sell signals are bearish divergence that has occurred recently on the RSI. When a long is in play it will sell if it finds bearish divergence or the time frame in view reaches RSI value higher than the 'RSI Sell Value'(Default 75). You can set your stop loss value with the 'Stop loss Percentage' (default 5).
Available inputs:
RSI Period: relative strength measurement length(Typically 14)
RSI Oversold Level: the bottom bar of the RSI (Typically 30)
RSI Overbought Level: the top bar of the RSI (Typically 70)
RSI Bearish Condition Minimum: The minimum value the script will use to look for a pivot high that starts the Bearish condition to Sell (Default 50)
RSI Bearish Condition Sell Min: the minimum value the script will accept a bearish condition (Default 60)
RSI Bull Condition Minimum: the minimum value it will consider a pivot low value in the RSI to find a divergence buy (Default 40)
Look Back this many candles: the amount of candles thee script will look back to find a low value in the RSI (Default 25)
RSI Sell Value: The RSI value of the exit condition for a long when value is reached (Default 75)
Stop loss Percentage: Percentage value for amount to lose (Default 5)
The formula to enter a long is stated below:
If price finds a lower low and there is a higher low found following a lower low and price has just made another dip and price closes lower than the last divergence and Relative strength index hour value is less than 40 enter a long.
The formula to exit a long is stated below:
If the value drops below the stop loss percentage OR (the RSI value is greater than the value of the parameter 'RSI Sell Value' or bearish divergence is found greater than the parameter 'RSI Bearish Condition Minimum' )
This script was built from much strategy testing on BTC but works with alts (occasionally) also. It is most successful to my knowledge using the 15 min and 7 min time frames with default values. Hope it helps! Follow for further possible updates to this script or other entry or exit strategies.
snapshot:
I only have a Pro trading view account so I cannot share a larger data set about this script because the buy signals happen pretty rarely. The most amount that I could find within a view for me was 40 trades within a viewable time. The suggested/default parameters that I have do not occur very often so it limits the data set. Adjustments can be made to the parameters so that trades can be entered more often. The scripts success is dependent on the values of the parameters set by the user. This script was written to be used for BTC/USD or BTC/USDT trading. I am unable to share a larger dataset without putting out results that are intended to fail or having a premium account so reaching the 100 trade minimum is not possible with my account.

Normalized CCI Divergence StrategyStrategy Overview:
This script takes the Commodity Channel Index and normalizes the equation to be read easier by the user. Bullish, Bearish, Hidden Bullish, and Hidden Bearish divergences are identified and displayed in the underlay. Hidden Bullish and Hidden Bearish are turned off by default, but can be turned on in the user settings. The strategy itself signals long or short based on the appearance of these divergences in addition to previous CCI values being above or below a threshold. *Shorter timeframes such as 5M are recommended.* Take profit, stop loss, and trailing percentages are also included, found at the bottom of the Input tab under “TT and TTP” as well as “Stop Loss”. Make sure to understand the TP/SL ratio that you desire before use, as the desired hit rate/profitability percentage will be affected accordingly. This strategy does NOT guarantee future returns. Apply caution in trading regardless of discretionary or algorithmic. Understand the concepts of risk/reward and the intricacies of each strategy choice before utilizing them in your personal trading.
Profitview Settings
If you wish to utilize Profitview’s automation system, find the included “Profitview Settings” under the Input tab of the strategy settings menu. If not, skip this section entirely as it can be left blank. Options will be “OPEN LONG TITLE”, “OPEN SHORT TITLE”, “CLOSE LONG TITLE”, and “CLOSE SHORT TITLE”. If you wished to trade SOL, for example, you would put “SOL LONG”, “SOL SHORT”, “SOL CLOSE LONG”, and “SOL CLOSE SHORT” in these areas. Within your Profitview extension, ensure that your Alerts all match these titles. To set an alert for use with Profitview, go to the “Alerts” tab in TradingView, then create an alert. Make sure that your desired asset and timeframe are currently displayed on your screen when creating the alert. Under the “Condition” option of the alert, select the strategy, then select the expiration time. If using TradingView Premium, this can be open-ended. Otherwise, select your desired expiration time and date. This can be updated whenever desired to ensure the strategy does not expire. Under “Alert actions”, nothing necessarily needs to be selected unless so desired. Leave the “Alert name” option empty. For the “Message”, delete the generated message and replace it with {{strategy.order.alert_message}} and nothing else.
RSI Hidden Divergence + Stochastic + 200 EMA @DaviddTechHey Traders,
This is my first strategy of many I hope. Inspired by a strategy I found on YouTube I wanted to see if it would work with a BOT strategy.
The idea is :
## LONG ##
* When the price is above 200 EMA take only LONG positions.
* Look for Bullish hidden divergence.
* Stochastic crossover to find our entry.
## SHORTS ##
* When the price is below 200 EMA take only SHORTpositions.
* Look for Bearish hidden divergence.
* Stochastic crossunder to find our entry.
You can used a fixed percentage, ATR, HH/LL or a FIB level to take profit.
Everything is very visual and can be connected easily to a bot.
I will be doing a video on HOW-TO setup in a couple of days.
## MUTLI LEVEL PROFITS ##
This will show you on backtest is you take profits at 3 levels however I have not tested on a BOT strategy.
NOTE : This is for educational purposes and please test on a paper account, as I said this is my first strategy.
I will be working and back testing new strategies every week.
- Made with ♥ @DaviddTech

Jeddingen Divergence Strategy v4Momentum vs. price divergence. Sell signals on bearish divergence, buy signals on bullish divergence .
Strategy includes an RSI filter, limit the time-range for back-testing and lots of other configuration options.
The below example uses stop-losses.
There is also a matching TradingView study with alert-conditions available!

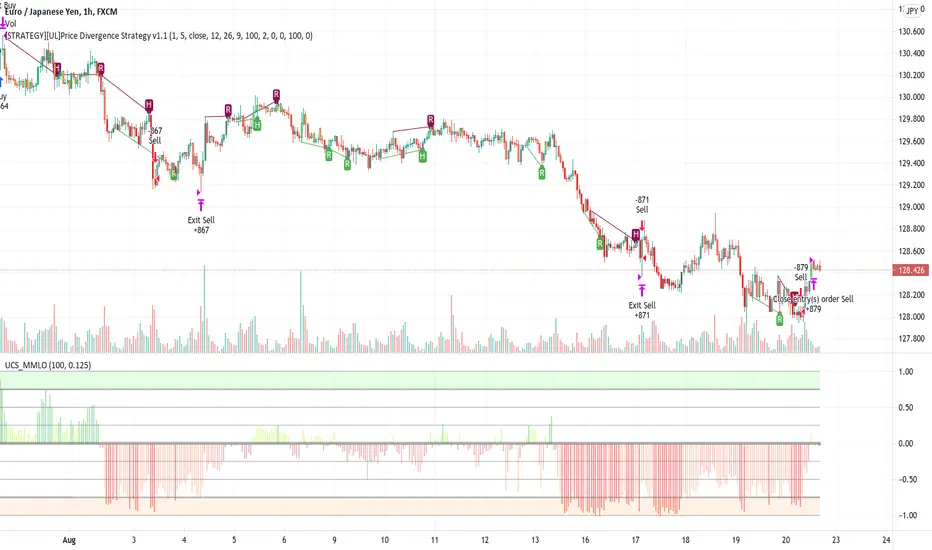
[STRATEGY][UL]Price Divergence Strategy v1.0Created by Request: This is a trend trading strategy that uses Price Divergence detection signals that are confirmed by the "Murrey's Math Oscillator" (Donchanin Channel based).
Strategy Code Based on:
Price Divergence Detector V2 by RicardoSantos
UCS_Murrey's Math Oscillator by Ucsgears
Strategy Risk Management Based on:
Strategy Code Example by JayRogers
Information on Divergence Trading:
- www.babypips.com
*** USE AT YOUR OWN RISK ***
MA Divergences StrategyThis is the Strategy version of the Study I published. It is a Moving Average that can be applied to any plot to plot divergences on any oscillator, as well as perform backtesting. You'll need a REALLY good oscillator to perform live trades using this alone, but I think it is a valuable tool and had the Strategy hanging around and for some reason didn't upload it yet.
So here it is.
Turn Length to 1 to follow the oscillator without lag. Turn Length up if you are getting too many false signals or tweak the original oscillator settings.
Profitable Pair Correlation Divergence Scanner v6This strategy identifies divergence opportunities between two correlated assets using a combination of Z-Score spread analysis, trend confirmation, RSI & MACD momentum checks, correlation filters, and ATR-based stop-loss/take-profit management. It’s optimized for positive P&L and realistic trade execution.
Key Features:
Pair Divergence Detection:
Measures deviation between returns of two assets and identifies overbought/oversold spread conditions using Z-Score.
Trend Alignment:
Trades only in the direction of the primary asset’s trend using a fast EMA vs slow EMA filter.
Momentum Confirmation:
Confirms trades with RSI and MACD to reduce false signals.
Correlation Filter:
Ensures the pair is strongly correlated before taking trades, avoiding noisy signals.
Risk Management:
Dynamic ATR-based stop-loss and take-profit ensures proper reward-to-risk ratio.
Exit Conditions:
Automatically closes positions when Z-Score normalizes, or ATR-based exits are hit.
How It Works:
Calculate Returns:
Computes returns for both assets over the selected timeframe.
Z-Score Spread:
Calculates the spread between returns and normalizes it using moving average and standard deviation.
Trend Filter:
Only takes long trades if the fast EMA is above the slow EMA, and short trades if the fast EMA is below the slow EMA.
Momentum Confirmation:
Confirms trade direction with RSI (>50 for longs, <50 for shorts) and MACD alignment.
Correlation Check:
Ensures the pair’s recent correlation is strong enough to validate divergence signals.
Trade Execution:
Opens positions when Z-Score crosses thresholds and all conditions align. Positions close when Z-Score normalizes or ATR-based SL/TP is hit.
Plot Explanation:
Z-Score: Blue line shows divergence magnitude.
Entry Levels: Red/Green lines mark long/short thresholds.
Exit Zone: Gray lines show normalization zone.
EMA Trend Lines: Purple (fast), Orange (slow) for trend alignment.
Correlation: Teal overlay shows current correlation strength.
Usage Tips:
Use highly correlated pairs for best results (e.g., EURUSD/GBPUSD).
Run on higher timeframe charts (1h or 4h) to reduce noise.
Adjust ATR multiplier based on volatility to avoid premature stops.
Combine with alerts for automated notifications or webhook execution.
Conclusion:
The Profitable Pair Correlation Divergence Scanner v6 is designed for traders who want systematic, low-risk, positive P&L trading opportunities with minimal manual monitoring. By combining trend alignment, momentum confirmation, correlation filters, and dynamic exits, it reduces false signals and improves execution reliability.
Run it on TradingView and watch how it captures divergence opportunities while maintaining positive P&L across trades.

Macd Divergence + MTF EMA MACD Divergence + Multi Time Frame EMA
This Strategy uses 3 indicators: the Macd and two emas in different time frames
The configuration of the strategy is:
Macd standar configuration (12, 26, 9) in 1H resolution
10 periods ema, in 1H resolution
5 periods ema, in 15 minutes resolution
We use the two emas to filter for long and short positions.
If 15 minutes ema is above 1H ema, we look for long positions
If 15 minutes ema is below 1H ema, we look for short positions
We can use an aditional filter using a 100 days ema, so when the 15' and 1H emas are above the daily ema we take long positions
Using this filter improves the strategy
We wait for Macd indicator to form a divergence between histogram and price
If we have a bullish divergence, and 15 minutes ema is above 1H ema, we wait for macd line to cross above signal line and we open a long position
If we have a bearish divergence, and 15 minutes ema is below 1H ema, we wait for macd line to cross below signal line and we open a short position
We close both position after a cross in the oposite direction of macd line and signal line
Also we can configure a Take profit parameter and a trailing stop loss

EMA Cross + Divergence strategy (Div. signals by The Divergent)A sample strategy demonstrating the usage of The Divergent divergence indicator and The Divergent Library .
The Divergent is an advanced divergence indicator which you can easily incorporate into your own strategies.
In order to use this strategy (and to use the signals in your own strategy), you need to have the Pro version of The Divergent applied to your chart.
For more information, please see the comments inlined in the code.

Ultimate Bullish Divergence for RSI MFI RVSI OBV w/ Buy SignalsThis strategy is based on the Indicator below and includes all of its features.
This version Includes the Strategy tester and a dynamic SL
The only drawdown of this version is that Alerts are not as customizable
Ultimate Bullish Divergence for RSI OBV RVSI MFI w/ Buy Alerts

RSI Overbought Oversold Divergence Strategy w/ Buy/Sell SignalsThis indicator is a copy of my RSI Overbought/Oversold Divergence Indicator with-Alerts
Only difference is that the alerts are disabled, instead it uses tradingviews strategy tester signals
If you want alerts just use the other indicator

MACD hist divergence strategy with switch v2
sum Macd hist to compare their strength,the DIAMOND means total strength , if the strength divergence, the trend may change
Macd 面積比較力度, 鑽石代表總力度, 力度背離即可能發生反轉
for the bullish market, I will suggest you to close the sw of buying energy divergence ex:btc
對於大牛市會建議您將買點能量背離關掉ex 比特幣
this strategy only have long order by now
目前此策略只支援做多
按鈕簡介
switch info
1.macd 面積背離時價格是否有背離的開關
1.A divergence switch btw price and MACD hist
2.macd 快線下穿0軸賣出的選項
2. Once MACD fast_line crossunder 0 stop loss switch
3.the setting logic and method is like this
設定如下
A1. 大牛股 for bullish market
B1. 高勝率低利潤 for high winning rate but lower profit
C1 高頻適合小級別 for high frq trading, useful in low period
D1 極小級別 for extremeness low period

HFT Divergence Hunter BacktesterDefault Settings are meant to be used in BTC /USDT chart on 5 min time frame on Binance Futures . If you want to use for another asset on another time frame YOU MUST CHANGE THE SETTINGS
This is a divergence finding strategy developed by HFT Research. It is a highly customizable strategy and provides endless opportunities to find profitable trades in the market.
Default Settings are meant to be used in BTC /USDT chart on 5 min time frame on Binance Futures . If you want to use for another asset on another time frame YOU MUST CHANGE THE SETTINGS
This is a divergence finding indicator developed by HFT Research. It is a highly customizable indicator and provides endless opportunities to find profitable trades in the market.
Use Envelope , this is the main decision maker in this strategy. The idea behind is that you choose the length of the moving average and set an offset % to create an upper and lower band. If you click on “display envelope” you will be able to visually see the band you have created. This way, you get to scalp the market as the price is diverging and moving away from the moving average. As the famous saying goes, moving averages act like magnets and prices always visits them back. Using this ideology, we aim to capitilize on the price swings that move away from the chosen moving average by x%.
STARC Bands ;
These are two bands that are applied above and below a simple moving average of an asset’s price. The upper band is created by adding the value of the average true range (ATR) or a multiple of i. The lower band is created by subtracting the value of the ATR from the SMA . The channel can provide traders with ideas on when to buy or sell. During an overall uptrend, buying near the lower band and selling near the top band is favorable. However, from our testing results it does fairly poorly in crypto markets while it does pretty well in traditional markets.
Use RSI ;
One of the most commonly used indicators in the trading world. The idea is simple, buy when its oversold and sell when its overbought. You can use RSI as a secondary confirmation of the dips. It can be turned on and off.
Use MFI
MFI stands for Money Flow Index and it is an oscillator like RSI . However, it does track the price in a different fashion than RSI providing a reliable option. It uses the price and volume data for identifying overbought and oversold signals in an asset.
Use Fisher Transform
Even though, it has a funny name, Fisher is actually a very decent and reliable indicator. It converts the prices into a Gaussian normal distribution channel. Therefore, the indicator detects when the prices have moved to an extreme, based on recent price action.
Use VWAP
VWAP stands for volume weighted average price . It is an extremely useful indicator when trading intra-day. It does reset every trading session which is at 00:00 UTC . Instead of looking at x number of candles and providing an average price, it will take into consideration the volume that’s traded at a certain price and weigh it accordingly. It will NOT give entry signals but act as a filter. If the price is above VWAP will filter out the shorts and other way around for longs.
Use ADX
Average directional index is a powerful indicator when one is assessing the strength of a trend as well as measuring the volatility in the market. Unfortunately, the worst market condition for this strategy is sideways market. ADX becomes a useful tool since it can detect trend. If the volatility is low and there is no real price movement, ADX will pick that up and will not let you get in trades during a sideways market. It will allow you to enter trades only when the market is trending.
Use Super trend Filter
The indicator works well in a trending market but can give false signals when a market is trading in a range.
It uses the ATR ( average true range ) as part of its calculation which takes into account the volatility of the market. The ATR is adjusted using the multiplier setting which determines how sensitive the indicator is.
Use MA Filter
Lookback: It is an option to look back x number of candles to validate the price crossing. If the market is choppy and the price keeps crossing up and down the moving average you have chosen, it will generate a lot of “noisy” signals. This option allows you to confirm the cross by selecting how many candles the price needs to stay above or below the moving average. Setting it 0 will turn it off.
MA Filter Type: There is a selection of moving averages that is available on TradingView currently. You can choose from 14 different moving average types to detect the trend as accurate as possible.
Filter Length: You can select the length of your moving average. Most commonly used length being 50,100 and 200.
Filter Type: This is our propriety smoothing method in order to make the moving averages lag less and influence the way they are calculated slightly. Type 1 being the normal calculation and type 2 being the secret sauce .
Reverse MA Filter: This option allows you to use the moving average in reverse. For example, the strategy will go long when the price is above the moving average. However, if you use the reserve MA Filter, you will go short when the price is above the moving average. This method works best in sideways market where price usually retraces back to the moving average. So, in an anticipation of price reverting back to the moving average, it is a useful piece of option to use during sideway markets.
Use MACD Filter
MACD here will act as a filter rather than an entry signal generator. There are a few different ways to use this MACD filter. You can click on the Use MACD filter and it will use filter out the shorts generated in a bullish territory and longs generated in the bearish territory. It will greatly reduce the number of trades the strategy will trade because MACD is a lagging indicator. By the time MACD turns bullish or bearish , most of the other indicators will have already generated the signals. Therefore, resulting in less trades. You can use MACD filter as MA oscillator meaning that it will only look at the MA lines in MACD to filter out trades. Alternatively, you can use it with the histogram (Signal lines) meaning that it will only look at the histogram whether its below or above the zero line in order to filter out the trades.
TP (%)
Place your desired take profit percentage here. Default is 1.5%
Move SL At Entry x% Profit
This is when the strategy will move your SL to the entry point if the position reaches x% profit. It can also generate a signal which can be automated to adjust the SL on the exchange.
SL (%)
Place your desired stop loss percentage here. Default is 1%
The backtester assumes the following;
- 1000$ capital
- 0.06% commission based on binance
- 1% risk meaning 100% equity on cross leverage
- Backtest results are starting from 2020
If you want to get access to this indicator please DM me or visit our website.

inwCoin Sto RSI Bullish/Bearish Divergence StrategyinwCoin Stochastic RSI Bullish / Bearish Divergence Strategy
This strategy is an alternated version of inwCoin RSI Bull/Bear div Strategy.
Because I want to know if the popular "STO RSI Divergence" Strategy really work in real trade?
The good thing about Sto RSI that it can provide us with more entry data for both long and short.
Because sometime RSI will never go to OB or OS zone again..
But sto will keep swinging between OB and OS zone.
Entry Condition
=============
BUY = Smooth K is higher low + price is lower low
SELL = Smooth K is lower high + price is higher high
Other Parameters
===============
- Use stop loss + stop loss %
- Data source for high/low price check
- Lookback period for divergence
Conclusion
==========
This strategy is working great for short entry when market is in sideway down.
Like in 1/7/2019 - 1/1/2020
or 1/1/2018-1/1/2019
But your portfolio will go kaboom if you short in the uptrend....
Also, this is not the good strategy for trend following + long position
But it's great addition if you want to pyramid your position in uptrend.
or looking for good spot to entry long if you miss the uptrend bus.

Auto Divergence StrategyThis is the initial release of the Strategy to backtest my Auto Divergence Study:

RSI Divergence + EMA @DaviddTechVery simple strategy that will look for Divergence on the RSI.
My Strategy for this was mixed with the 55 EMA which you can activate in the settings.
WARNING:
- For purpose educate only - My mission is to debunk fake strategies with code to find THE ONE.
- Plots EMAs and other values on chart.
- This script to change bars colors.
