Relative Strength Exponential Moving Average [CC]The Relative Strength Exponential Moving Average was created by Vitali Apirine (Stocks and Commodities Jan 2022 pgs 22-25) and this is a handy moving average that combines a typical overbought/oversold mechanic with an overall trend indicator. Even though the typical length is so large it reacts extremely quickly when the stock becomes overbought or oversold. Because of this the indicator by itself doesn't work as well during choppy periods so Vitali recommends using a moving average crossover system during choppy so do one indicator with the default length of 50 and use a different length of 10 so when the shorter length crosses over the longer length then buy and vice versa you would sell. Generally speaking buy when the line turns green and sell when it turns red. I have used strong buy and sell signals in addition to normal signals so strong signals are darker in color and normal signals are lighter in color.
Let me know if there are any other scripts or indicators you would like me to publish!
在腳本中搜尋"Exponential Moving Average"

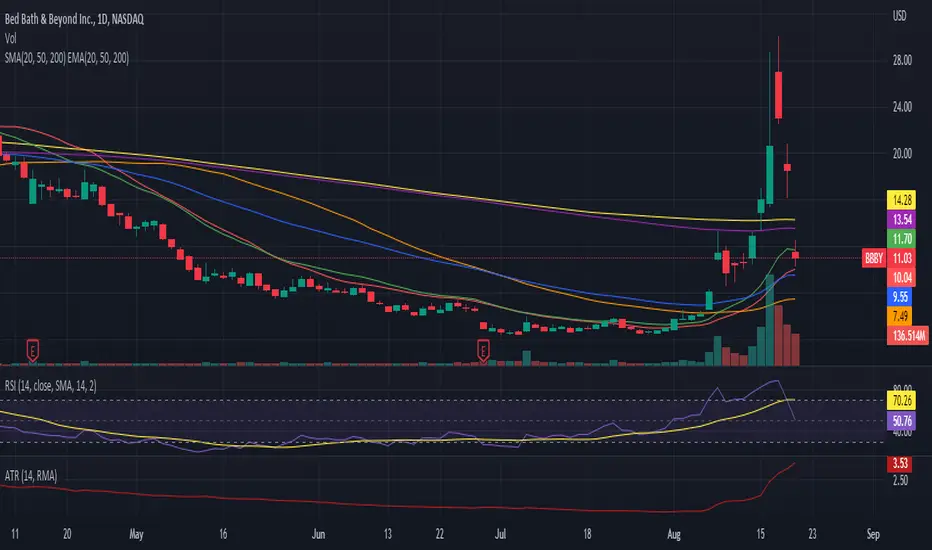
Simple and Exponential Moving Averages (20, 50, 200)Displays the 20, 50, and 200 simple and exponential moving averages in 1 indicator.
Ehlers Error Correcting Exponential Moving Average [CC]The Error Correcting Exponential Moving Average was created by John Ehlers and Ric Way (Stocks & Commodities V. 28:11 (30-35)) and this is an excellent moving average that accurately identifies the trend and sticks with the price during trends or choppy periods pretty well. It looks back to find the best gain setting for each day that returns the smallest difference between the current price and the ema based on the gain setting and uses that day's info in it's total calculations and if there is a zero gain for the day then it is just a classic ema. I have included strong buy and sell signals in addition to normal ones so lighter colors are normal and darker colors are strong. Buy when the line turns green and sell when it turns red.
Let me know if there are any other indicators you would like to see me publish!

4 Exponential Moving Averages With Colors(100,300,600,1000)4 Exponential Moving Averages With Colors(100,300,600,1000) With Colors
To play with Scalper,Swing, intraday


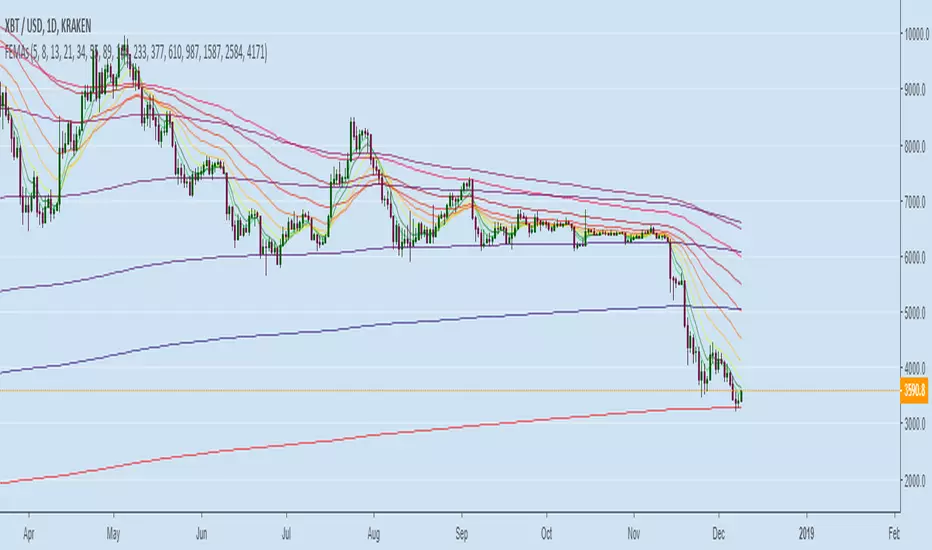
Most Fibonacci Exponential Moving AveragesThis indicator displays 15 Fibonacci Exponential Moving Averages
Can be used for support/resistance over many timeframes.
In the future I will try to add the predicted projections.
You can edit the inputs to include different length EMAs, and change the colors. You can also choose which ones you want to show.
Enjoy.

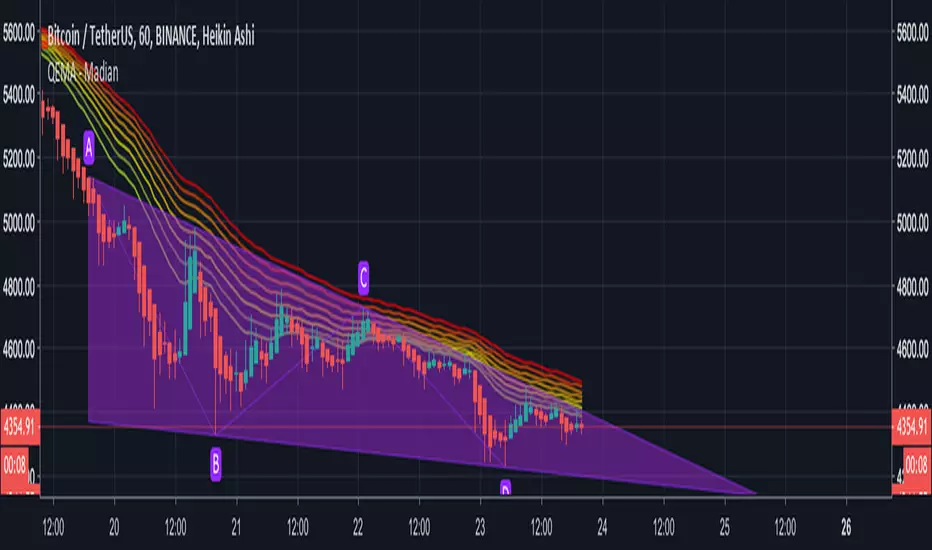
QEMA - 8 Exponential Moving Averages (20 - 55) / MadianQEMA - 8 Exponential Moving Averages (20, 25, 30, 35, 40, 45, 50, 55)
This QEMA act as support and resistance .
Daily Exponential Moving AveragesTired of wasting countless hours switching back and forth between timeframes?
Worry not! For only 499.95$ now you can... Oh wait this script took me 5 minutes I can't sell that.
The idea is priceless thought.
This is a very basic script that lets you view 2 daily exponential moving averages from any timeframe (you won't see much from higher timeframes thought).
To see the 1 hour regular divergence at the top you would still need to check the 1 hour.
I recommend having a vague idea of the trend on daily/weekly chart and then looking only at 4 HR with daily indicators on it like with this script + maybe if you want you might use the 1HR chart for confirmation or to try and pinpoint the best place to enter.
No matter what your holding periods are, other timeframes are bad anyway.
Going to release a couple more scripts in the coming weeks.


Four Exponential Moving AveragesFour Exponential Moving Averages combined into one indicator
For customization DM

[3EMA]Triple Exponential Moving Averages Crossing Triple lines crossing EMA. 15 50 200 Days , btw period is editable.
//Just copy and edit from

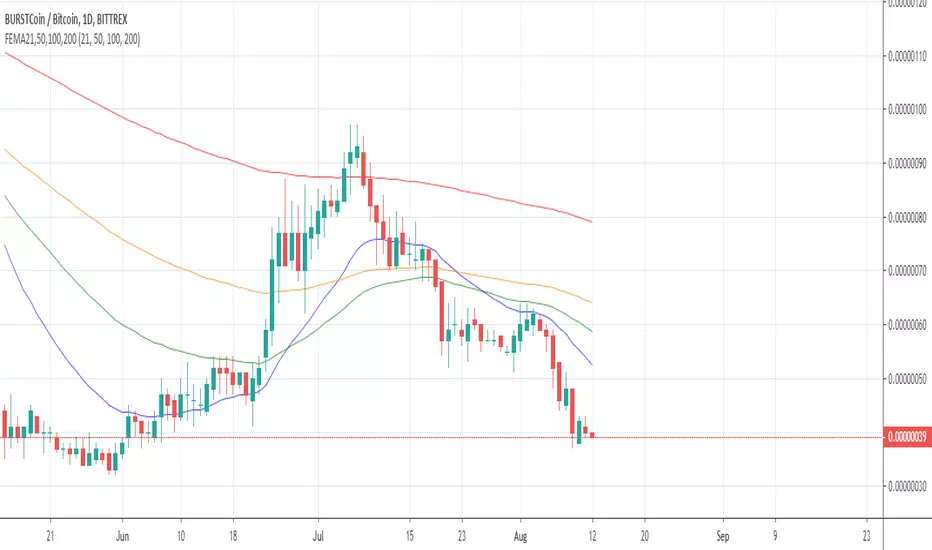
Fibonacci-based Exponential Moving AveragesFibonacci-based exponential moving averages 21/34/55/89/144/233


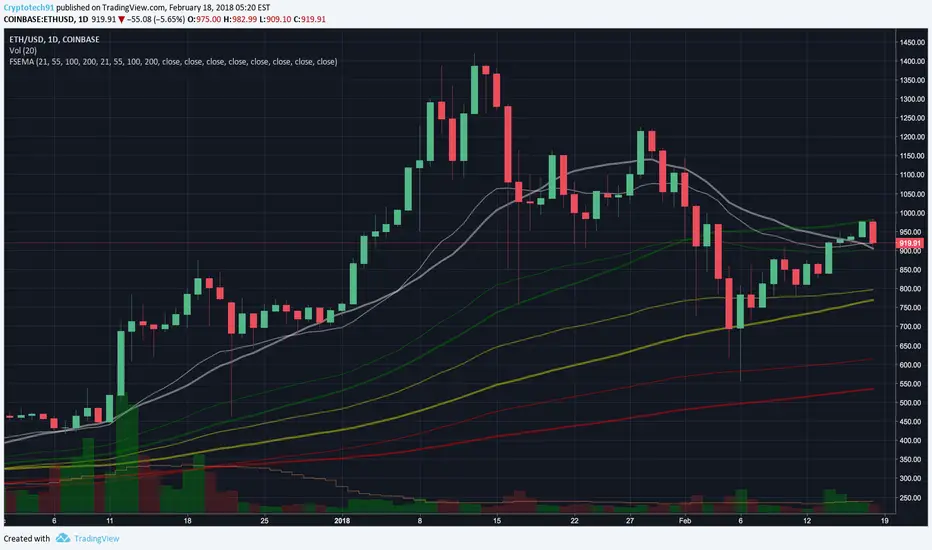
Four Exponential Moving AveragesThis indicator was made to allow four exponential moving averages to be displayed without needing to use up 4 charting indicators individually
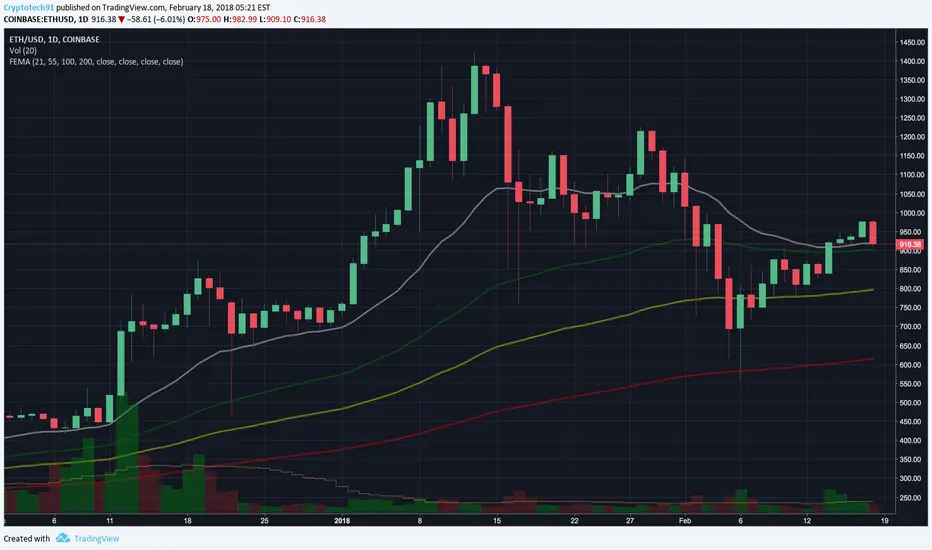
Four Simple And Exponential Moving AveragesThis indicator was made to allow four simple and exponential moving averages to be displayed without needing to use up 8 charting indicators individually
4 Exponential Moving Averages + One Extra for 1D Charts4 Exponential Moving Averages + One Extra for 1D Charts
I use 4 EMAs for my 1 hour and 4 hours Chart.
Additionally for 1D Charts, sometime i need to use 9 EMA. Now is in place. Enjoy it!
I used them only for support my analisys based on Elliot Waves and Fibonacci projections and Retracements, which are my main strategy.

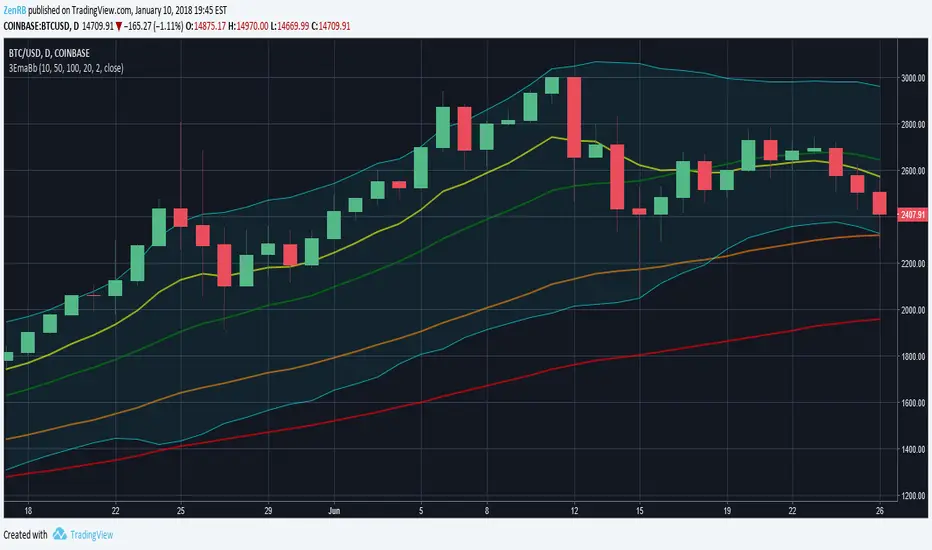
Triple Exponential Moving Averages with Bollinger BandsParameterized triple exponential moving averages with Bollinger Bands in one indicator.
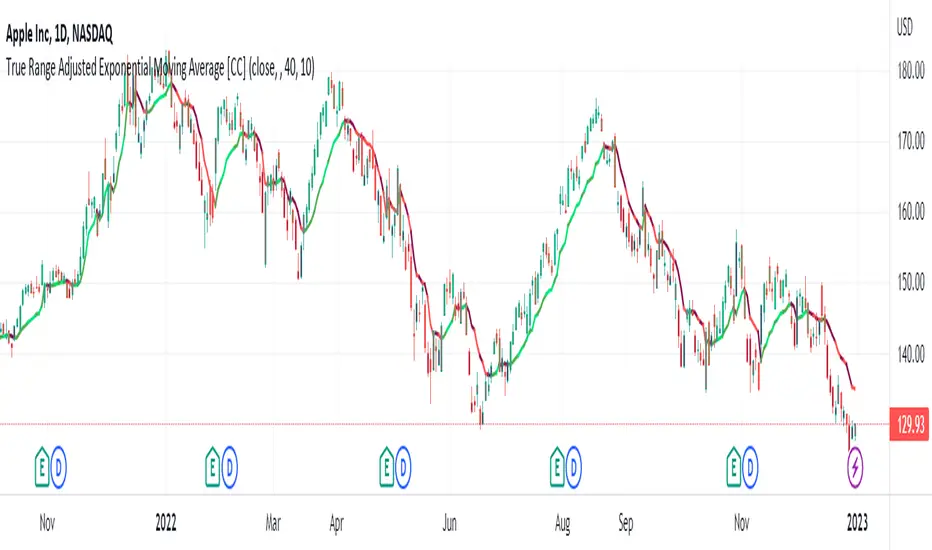
True Range Adjusted Exponential Moving Average [CC]The True Range Adjusted Exponential Moving Average was created by Vitali Apirine (Stocks and Commodities Jan 2023 pgs 22-27) and this is the latest indicator in his EMA variation series. He has been tweaking the traditional EMA formula using various methods and this indicator of course uses the True Range indicator. The way that this indicator works is that it uses a stochastic of the True Range vs its highest and lowest values over a fixed length to create a multiple which increases as the True Range rises to its highest level and decreases as the True Range falls. This in turn will adjust the Ema to rise or fall depending on the underlying True Range. As with all of my indicators, I have color coded it to turn green when it detects a buy signal or turn red when it detects a sell signal. Darker colors mean it is a very strong signal and let me know if you find any settings that work well overall vs the default settings.
Let me know if you would like me to publish any other scripts that you recommend!
Volume Weighted Exponential Moving Average Suite (VWEMA)This is a volume weighted exponential moving average (EMA) script that allows users to customize various parameters to fit their specific needs.
The script includes four different EMA styles: EMA, DEMA, TEMA, and EHMA. Users can choose which style they would like to use by selecting it in the input field. The script also allows users to customize the length of the EMA, with options for both a maximum and minimum length. Users can also choose to use a manual length or to use the dominant cycle within a range as the length.
In addition to these options, the script also includes the ability to turn on or off volume weighting and a daily reset feature that resets the EMA every day. There is also an option to turn on deviation bands, which show the standard deviation of the selected EMA.
Overall, this script offers a wide range of customization options to help users find the best EMA settings for their needs. It is an advanced tool that can be very helpful for traders looking to optimize their EMA strategy.
Cumulative length instead of cycle length
Double EMA Volume Weighted
Triple EMA Volume Weighted
EHMA Volume Weighted
Higher time frame
Deviation Bands

Awesome Oscillator - Exponential Moving AverageStandard Awesome Oscillator is SMA. I have created this with Exponential Moving Average
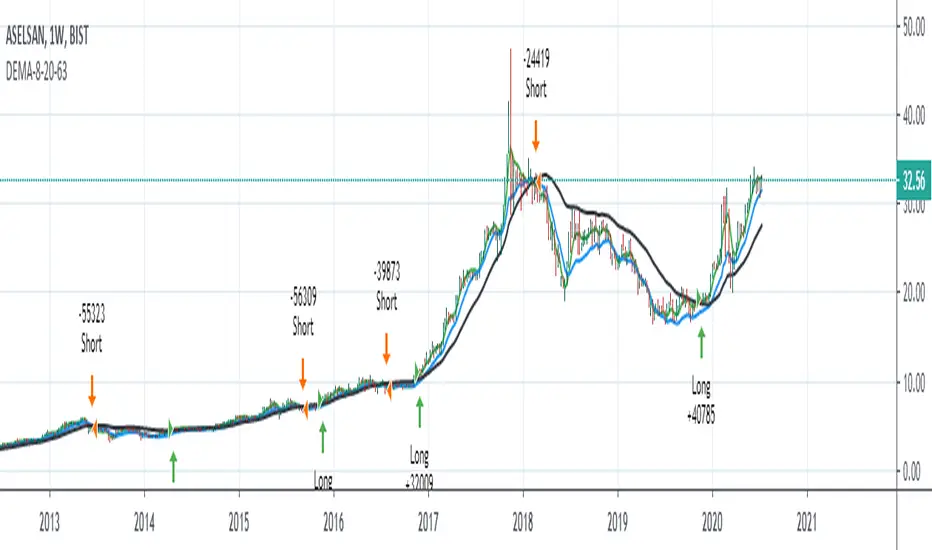
Double Exponential Moving Average 8-20-63 StrategyHello, this script was made upon the request of aliergin63, one of my followers.
I do not know exactly from whom it is quoted. (It may be author HighProfit.)
Long position when 8 dema is over 20 dema and 63 dema,
it opens a short position for the vice versa.
Alarms have been added.
%0.1 comission added.
Regards.
Note : DEMA = Double Exponential Moving Average