Ranged Volume DCA Strategy - R3c0nTraderUpdate: Republishing this as Public Open-Source script.
Credits:
Thank you "EvoCrypto" for granting me permission to use "Ranged Volume" to create this strategy.
Thank you "junyou0424" for granting me permission to use "DCA Bot with SuperTrend Emulator" which I used for adding bot inputs, calculations, and strategy
What does this do?
This script is mainly used for backtesting a Ranged Volume strategy to see how a 3Commas bot would perform.
I created this script out of necessity and I wanted a way to test a 3Commas DCA bot with a strategy based on “Volume.”
I came across "EvoCrypto’s" "Ranged Volume" study and strategy in TradingView and I liked it. I wanted to configure it so it can be used for DCA bot backtesting. I used parts from "junyou0424’s" "DCA Bot with SuperTrend Emulator" to add the following:
1. The Start Time and End Time
2. Price deviation to open safety orders (%)
3. Target Take Profit (%)
4. Trailing deviation
5. Base Order and Safety Order
6. Safety order volume scale
7. Safety order step scale
8. Max safety orders
In addition to the above, I also added chart indicators for "Take Profit" as well as "Safety Order"
Pre-requisites:
You can use this script without a 3Commas account and see how 3Commas DCA Bot and Ranged Volume strategy would perform vs. a non-DCA strategy. However, I highly recommend signing up for their free account and going through their training. This would give you a base understanding on the settings you will see in this strategy and why you will need to know them.
That said these are the pre-requisites I suggest you have:
1. Base Knowledge of 3Commas DCA bots
2. Base knowledge of settings such as “Max safety trades count”, “safety order volume scale” and “safety order step scale”. If these are alien to you, I suggest you read up on these.
3. Knowledge of setting up a Single-pair 3Commas bot for receiving custom TradingView signal.
4. A paper-bot to test your ideas. (Do not use a real money bot until you have tested it sufficiently with a paper-bot. You alone are responsible for your results!)
5. Add the study I created called "R3c0nTrader’s Ranged Volume Study” which adds a separate chart in its own pane showing the volume spikes. It will also generate the “buy” signals for your bot. NOTE: The study also has the same color scheme as this strategy and having the colors in both the strategy and the study will make things easier to see. If you use EvoCrypto’s Ranged Volume Study instead, just keep in mind that the colors won’t match, and you will have to manually match them.
6. Make your buy signals from your strategy are the same as in your study! To do this, use the same “Volume Range Length” you entered in the STRATEGY and enter that value for the “Volume Range Length” in the STUDY. Also ensure you have the same settings for “Heikin Ashi” (On or Off).
Comparisons of Ranged Volume Strategy vs Ranged Volume DCA Strategy
BTCUSD
Beware of Strategies that claim super high profits. This can easily be done by lowering the initial capital to something unrealistic. If I did that with this strategy and set the initial capital $100 and base order size to $100, I get a net profit of 2,864% which is not realistic.
How to Use
1. On the “Inputs” tab:
a. Set your Start and End Time to backtest against.
b. Set your “Volume Range Length” (number of bars to look back)
c. “Heikin Ashi Colors” – Usually I leave this enabled
d. “Show Bar Colors” – Leave enabled
e. “Show Break-Out” – Leave enabled
f. “Show Range” – Leave enabled
g. Set your other inputs which are those settings you would find in your 3Commas bot that you want to test (e.g., Price deviation to open safety orders, Target Take Profit, Base order, Safety order, etc.).
h. Quick Example for BTCUSD on 2hr chart:
i. Price deviation to open safety orders (%) = 6
ii. Target Take Profit (%) = 14
iii. Trailing deviation = 0
iv. Base order = 100
v. Safety order = 200
vi. Safety order volume scale = 2
vii. Safety order step scale = 1.4
viii. Max safety order = 5
2. On the “Properties” tab, set your initial capital, base currency, etc.
a. Initial capital – Default is 10,000 (Please use realistic values here. The amount here should be able to cover ALL your safety orders if they were triggered. Ideally, you should have funds left over and not use all trade capital.)
b. Base currency – Select your currency
c. Order Size - Not used. Use the “Inputs” tab to change your base order size.
d. Leave “Pyramiding” set to 999. This acts as a ceiling to the “Max safety orders” on the “Inputs” tab. It must always be higher than your “Max safety orders.” For example, if you set your “Max safety orders” to “4” and “Pyramiding” to “4” then it effectively means you have “3” “Max safety orders” and not “4” because it is counting each successive entry including the initial order.
e. “Commission” - Optional
f. “Verify price for limit orders” – Leave at zero. This does not change anything that I can tell.
g. Optional - Enter a value for “Commission”
h. Slippage – Optional. Slippage does not occur in backtesting but does occur in real trading but it can be simulated. Example use case for tracking performance of a real money bot: You enter the start date and time of your bot’s trade into this strategy and you notice some values are a little off due to slippage (average price, take profit, safety orders are not lining up) then you would go back here and increase the slippage until those lines up close enough with your actuals.
i. Margin for long positions – I don’t use this honestly.
j. Margin for short positions – I don’t use this honestly.
k. Recalculate “After order is filled” and “On every tick” – I don’t use this honestly.
3. “Style” tab
a. Ranged Volume Bar Coloring - You must disable bar coloring in any studies you added or this may not work properly
i. Color 0 – Default Yellow; appears when a volume breakout occurs
ii. Color 1 – Default Red; appears when a volume breakdown occurs
iii. Color 2 – Light Blue; appears when Close is higher than the Open
iv. Color 3 – Dark Blue; appears when the Close is lower than the Open
b. Take profit – Default Green; take profit line
c. Safety order – Default Light Blue; safety order line
d. No Safety Orders left – Default Red; when a trade runs out of safety orders, the line turns red and there is no safety orders left underneath to catch any further falling price movements.
e. Avg Position Price – Default Orange; your average position price for any given trade.
f. Take Profit Plot Area – Default Green; creates a highlighted area for your take profit
g. SO Plot Area – Default Light Blue; creates a highlighted area for your safety orders
h. Trades on chart – Show or hide your trades on the chart
i. Signal labels – Show or hide the trade signal labels on the chart
j. Quantity – Show or hide the trade quantity on the chart
Explanation of Chart lines and colors on chart
在腳本中搜尋"N+credit最新动态"

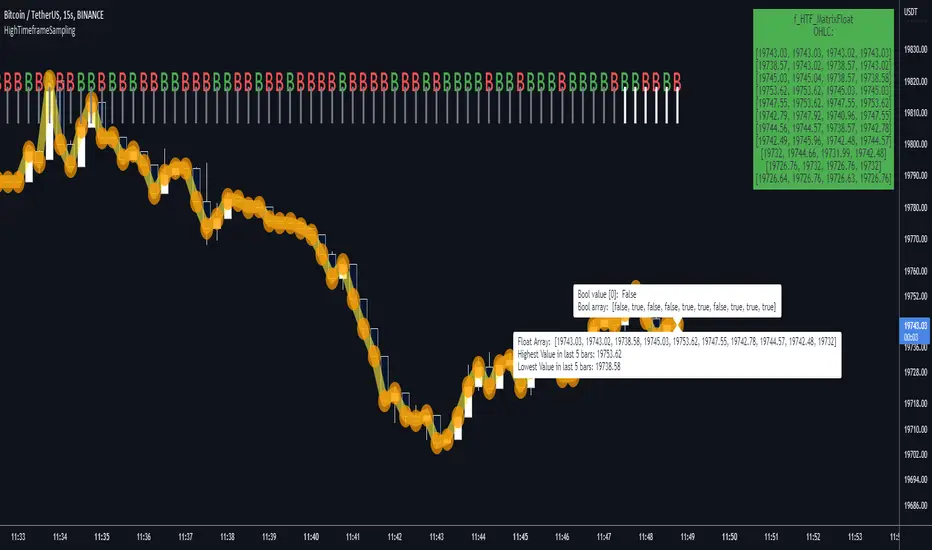
HighTimeframeSamplingLibrary "HighTimeframeSampling"
Library for sampling high timeframe (HTF) data. Returns an array of historical values, an arbitrary historical value, or the highest/lowest value in a range, spending a single security() call.
An optional pass-through for the chart timeframe is included. Other than that case, the data is fixed and does not alter over the course of the HTF bar. It behaves consistently on historical and elapsed realtime bars.
The first version returns floating-point numbers only. I might extend it if there's interest.
🙏 Credits: This library is (yet another) attempt at a solution of the problems in using HTF data that were laid out by Pinecoders - to whom, especially to Luc F, many thanks are due - in "security() revisited" - which I recommend you consult first. Go ahead, I'll wait.
All code is my own.
~~~~~~~~~~~~~~~~~~~~~~~~~~~~~~~~~~~~~~~~~~~~~~~~~~~~~~~~~~~~~~~~~~~~
WHAT'S THE PROBLEM? OR, WHY NOT JUST USE SECURITY()
~~~~~~~~~~~~~~~~~~~~~~~~~~~~~~~~~~~~~~~~~~~~~~~~~~~~~~~~~~~~~~~~~~~~
There are many difficulties with using HTF data, and many potential solutions. It's not really possible to convey it only in words: you need to see it on a chart.
Before using this library, please refer to my other HTF library, HighTimeframeTiming: which explains it extensively, compares many different solutions, and demonstrates (what I think are) the advantages of using this very library, namely, that it's stable, accurate, versatile and inexpensive. Then if you agree, come back here and choose your function.
~~~~~~~~~~~~~~~~~~~~~~~~~~~~~~~~~~~~~~~~~~~~~~~~~~~~~~~~~~~~~~~~~~~~
MOAR EXPLANATION
~~~~~~~~~~~~~~~~~~~~~~~~~~~~~~~~~~~~~~~~~~~~~~~~~~~~~~~~~~~~~~~~~~~~
🧹 Housekeeping: To see which plot is which, turn line labels on: Settings > Scales > Indicator Name Label. Vertical lines at the top of the chart show the open of a HTF bar: grey for historical and white for real-time bars.
‼ LIMITATIONS: To avoid strange behaviour, use this library on liquid assets and at chart timeframes high enough to reliably produce updates at least once per bar period.
A more conventional and universal limitation is that the library does not offer an unlimited view of historical bars. You need to define upfront how many HTF bars you want to store. Very large numbers might conceivably run into data or performance issues.
~~~~~~~~~~~~~~~~~~~~~~~~~~~~~~~~~~~~~~~~~~~~~~~~~~~~~~~~~~~~~~~~~~~~
BRING ON THE FUNCTIONS
~~~~~~~~~~~~~~~~~~~~~~~~~~~~~~~~~~~~~~~~~~~~~~~~~~~~~~~~~~~~~~~~~~~~
@function f_HTF_Value(string _HTF, float _source, int _arrayLength, int _HTF_Offset, bool _useLiveDataOnChartTF=false)
Returns a floating-point number from a higher timeframe, with a historical operator within an abitrary (but limited) number of bars.
@param string _HTF is the string that represents the higher timeframe. It must be in a format that the request.security() function recognises. The input timeframe cannot be lower than the chart timeframe or an error is thrown.
@param float _source is the source value that you want to sample, e.g. close, open, etc., or you can use any floating-point number.
@param int _arrayLength is the number of HTF bars you want to store and must be greater than zero. You can't go back further in history than this number of bars (minus one, because the current/most recent available bar is also stored).
@param int _HTF_Offset is the historical operator for the value you want to return. E.g., if you want the most recent fixed close, _source=close and _HTF_Offset = 0. If you want the one before that, _HTF_Offset=1, etc.
The number of HTF bars to look back must be zero or more, and must be one less than the number of bars stored.
@param bool _useLiveDataOnChartTF uses live data on the chart timeframe.
If the higher timeframe is the same as the chart timeframe, store the live value (i.e., from this very bar). For all truly higher timeframes, store the fixed value (i.e., from the previous bar).
The default is to use live data for the chart timeframe, so that this function works intuitively, that is, it does not fix data unless it has to (i.e., because the data is from a higher timeframe).
This means that on default settings, on the chart timeframe, it matches the raw source values from security(){0}.
You can override this behaviour by passing _useLiveDataOnChartTF as false. Then it will fix all data for all timeframes.
@returns a floating-point value that you requested from the higher timeframe.
@function f_HTF_Array(string _HTF, float _source, int _arrayLength, bool _useLiveDataOnChartTF=false, int _startIn, int _endIn)
Returns an array of historical values from a higher timeframe, starting with the current bar. Optionally, returns a slice of the array. The array is in reverse chronological order, i.e., index 0 contains the most recent value.
@param string _HTF is the string that represents the higher timeframe. It must be in a format that the request.security() function recognises. The input timeframe cannot be lower than the chart timeframe or an error is thrown.
@param float _source is the source value that you want to sample, e.g. close, open, etc., or you can use any floating-point number.
@param int _arrayLength is the number of HTF bars you want to keep in the array.
@param bool _useLiveDataOnChartTF uses live data on the chart timeframe.
If the higher timeframe is the same as the chart timeframe, store the live value (i.e., from this very bar). For all truly higher timeframes, store the fixed value (i.e., from the previous bar).
The default is to use live data for the chart timeframe, so that this function works intuitively, that is, it does not fix data unless it has to (i.e., because the data is from a higher timeframe).
This means that on default settings, on the chart timeframe, it matches raw source values from security().
You can override this behaviour by passing _useLiveDataOnChartTF as false. Then it will fix all data for all timeframes.
@param int _startIn is the array index to begin taking a slice. Must be at least one less than the length of the array; if out of bounds it is corrected to 0.
@param int _endIn is the array index BEFORE WHICH to end the slice. If the ending index of the array slice would take the slice past the end of the array, it is corrected to the end of the array. The ending index of the array slice must be greater than or equal to the starting index. If the end is less than the start, the whole array is returned. If the starting index is the same as the ending index, an empty array is returned. If either the starting or ending index is negative, the entire array is returned (which is the default behaviour; this is effectively a switch to bypass the slicing without taking up an extra parameter).
@returns an array of HTF values.
@function f_HTF_Highest(string _HTF="", float _source, int _arrayLength, bool _useLiveDataOnChartTF=true, int _rangeIn)
Returns the highest value within a range consisting of a given number of bars back from the most recent bar.
@param string _HTF is the string that represents the higher timeframe. It must be in a format that the request.security() function recognises. The input timeframe cannot be lower than the chart timeframe or an error is thrown.
@param float _source is the source value that you want to sample, e.g. close, open, etc., or you can use any floating-point number.
@param int _arrayLength is the number of HTF bars you want to store and must be greater than zero. You can't have a range greater than this number.
@param bool _useLiveDataOnChartTF uses live data on the chart timeframe.
If the higher timeframe is the same as the chart timeframe, store the live value (i.e., from this very bar). For all truly higher timeframes, store the fixed value (i.e., from the previous bar).
The default is to use live data for the chart timeframe, so that this function works intuitively, that is, it does not fix data unless it has to (i.e., because the data is from a higher timeframe).
This means that on default settings, on the chart timeframe, it matches raw source values from security().
You can override this behaviour by passing _useLiveDataOnChartTF as false. Then it will fix all data for all timeframes.
@param _rangeIn is the number of bars to include in the range of bars from which we want to find the highest value. It is NOT the historical operator of the last bar in the range. The range always starts at the current bar. A value of 1 doesn't make much sense but the function will generously return the only value it can anyway. A value less than 1 doesn't make sense and will return an error. A value that is higher than the number of stored values will be corrected to equal the number of stored values.
@returns a floating-point number representing the highest value in the range.
@function f_HTF_Lowest(string _HTF="", float _source, int _arrayLength, bool _useLiveDataOnChartTF=true, int _rangeIn)
Returns the lowest value within a range consisting of a given number of bars back from the most recent bar.
@param string _HTF is the string that represents the higher timeframe. It must be in a format that the request.security() function recognises. The input timeframe cannot be lower than the chart timeframe or an error is thrown.
@param float _source is the source value that you want to sample, e.g. close, open, etc., or you can use any floating-point number.
@param int _arrayLength is the number of HTF bars you want to store and must be greater than zero. You can't go back further in history than this number of bars (minus one, because the current/most recent available bar is also stored).
@param bool _useLiveDataOnChartTF uses live data on the chart timeframe.
If the higher timeframe is the same as the chart timeframe, store the live value (i.e., from this very bar). For all truly higher timeframes, store the fixed value (i.e., from the previous bar).
The default is to use live data for the chart timeframe, so that this function works intuitively, that is, it does not fix data unless it has to (i.e., because the data is from a higher timeframe).
This means that on default settings, on the chart timeframe, it matches raw source values from security().
You can override this behaviour by passing _useLiveDataOnChartTF as false. Then it will fix all data for all timeframes.
@param _rangeIn is the number of bars to include in the range of bars from which we want to find the highest value. It is NOT the historical operator of the last bar in the range. The range always starts at the current bar. A value of 1 doesn't make much sense but the function will generously return the only value it can anyway. A value less than 1 doesn't make sense and will return an error. A value that is higher than the number of stored values will be corrected to equal the number of stored values.
@returns a floating-point number representing the lowest value in the range.
Follow The Ranging HullThis is a scalping strategy, trying to make quick points based on momentum and trend trading.
Entry Points are when either the range filter or the the following line changes colour. And the Hull is in that same direction.
--The Strategy Only enters on range filter entry point for now.
This Strategy has been tested on the NASDAQ 1 min, And works best with low timeframes.
Set the IsStrategy on the settings to true, to activate the strategy.
Make sure the Dates are correct .
Credits:
Hull Suite by InSilico www.tradingview.com
Range Filter Buy and Sell 5 min www.tradingview.com
Follow Line Indicator by Dreadblitz www.tradingview.com

HighTimeframeTimingLibrary "HighTimeframeTiming"
@description Library for sampling high timeframe (HTF) historical data at an arbitrary number of HTF bars back, using a single security() call.
The data is fixed and does not alter over the course of the HTF bar. It also behaves consistently on historical and elapsed realtime bars.
‼ LIMITATIONS: This library function depends on there being a consistent number of chart timeframe bars within the HTF bar. This is almost always true in 24/7 markets like crypto.
This might not be true if the chart doesn't produce an update when expected, for example because the asset is thinly traded and there is no volume or price update from the feed at that time.
To mitigate this risk, use this function on liquid assets and at chart timeframes high enough to reliably produce updates at least once per bar period.
The consistent ratio of bars might also break down in markets with irregular sessions and hours. I'm not sure if or how one could mitigate this.
Another limitation is that because we're accessing a multiplied number of chart bars, you will run out of chart bars faster than you would HTF bars. This is only a problem if you use a large historical operator.
If you call a function from this library, you should probably reproduce these limitations in your script description.
However, all of this doesn't mean that this function might not still be the best available solution, depending what your needs are.
If a single chart bar is skipped, for example, the calculation will be off by 1 until the next HTF bar opens. This is certainly inconsistent, but potentially still usable.
@function f_offset_synch(float _HTF_X, int _HTF_H, int _openChartBarsIn, bool _updateEarly)
Returns the number of chart bars that you need to go back in order to get a stable HTF value from a given number of HTF bars ago.
@param float _HTF_X is the timeframe multiplier, i.e. how much bigger the selected timeframe is than the chart timeframe. The script shows a way to calculate this using another of my libraries without using up a security() call.
@param int _HTF_H is the historical operator on the HTF, i.e. how many bars back you want to go on the higher timeframe. If omitted, defaults to zero.
@param int _openChartBarsIn is how many chart bars have been opened within the current HTF bar. An example of calculating this is given below.
@param bool _updateEarly defines whether you want to update the value at the closing calculation of the last chart bar in the HTF bar or at the open of the first one.
@returns an integer that you can use as a historical operator to retrieve the value for the appropriate HTF bar.
🙏 Credits: This library is an attempt at a solution of the problems in using HTF data that were laid out by Pinecoders in "security() revisited" -
Thanks are due to the authors of that work for an understanding of HTF issues. In addition, the current script also includes some of its code.
Specifically, this script reuses the main function recommended in "security() revisited", for the purposes of comparison. And it extends that function to access historical data, again just for comparison.
All the rest of the code, and in particular all of the code in the exported function, is my own.
Special thanks to LucF for pointing out the limitations of my approach.
~~~~~~~~~~~~~~~~|
EXPLANATION
~~~~~~~~~~~~~~~~|
Problems with live HTF data: Many problems with using live HTF data from security() have been clearly explained by Pinecoders in "security() revisited"
In short, its behaviour is inconsistent between historical and elapsed realtime bars, and it changes in realtime, which can cause calculations and alerts to misbehave.
Various unsatisfactory solutions are discussed in "security() revisited", and understanding that script is a prerequisite to understanding this library.
PineCoders give their own solution, which is to fix the data by essentially using the previous HTF bar's data. Importantly, that solution is consistent between historical and realtime bars.
This library is an attempt to provide an alternative to that solution.
Problems with historical HTF data: In addition to the problems with live HTF data, there are different issues when trying to access historical HTF data.
Why use historical HTF data? Maybe you want to do custom calculations that involve previous HTF bars. Or to use HTF data in a function that has mutable variables and so can't be done in a security() call.
Most obviously, using the historical operator (in this description, represented using { } because the square brackets don't render) on variables already retrieved from a security() call, e.g. HTF_Close{1}, is not very useful:
it retrieves the value from the previous *chart* bar, not the previous HTF bar.
Using {1} directly in the security() call instead does get data from the previous HTF bar, but it behaves inconsistently, as we shall see.
This library addresses these concerns as well.
Housekeeping: To follow what's going on with the example and comparisons, turn line labels on: Settings > Scales > Indicator Name Label.
The following explanation assumes "close" as the source, but you can change it if you want.
To quickly see the difference between historical and realtime bars, set the HTF to something like 3 minutes on a 15s chart.
The bars at the top of the screen show the status. Historical bars are grey, elapsed realtime bars are red, and the realtime bar is green. A white vertical line shows the open of a HTF bar.
A: This library function f_offset_synch(): When supplied with an input offset of 0, it plots a stable value of the close of the *previous* HTF bar. This value is thus safe to use for calculations and alerts.
For a historical operator of {1}, it gives the close of the *last-but-one* bar. Sounds simple enough. Let's look at the other options to see its advantages.
B: Live HTF data: Represented on the line label as "security(){0}". Note: this is the source that f_offset_synch() samples.
The raw HTF data is very different on historical and realtime bars:
+ On historical bars, it uses a flat value from the end of the previous HTF bar. It updates at the close of the HTF bar.
+ On realtime bars, it varies between and within each chart bar.
There might be occasions where you want to use live data, in full knowledge of its drawbacks described above. For example, to show simple live conditions that are reversible after a chart bar close.
This library transforms live data to get the fixed data, thus giving you access to both live and fixed data with only one security() call.
C: Historical data using security(){H}: To see how this behaves, set the {H} value in the settings to 1 and show options A, B, and C.
+ On historical bars, this option matches option A, this library function, exactly. It behaves just like security(){0} but one HTF bar behind, as you would expect.
+ On realtime bars, this option takes the value of security(){0} at the end of a HTF bar, but it takes it from the previous *chart* bar, and then persists that.
The easiest way to see this inconsistency is on the first realtime bar (marked red at the top of the screen). This option suddenly jumps, even if it's in the middle of a HTF bar.
Contrast this with option A, which is always constant, until it updates, once per HTF bar.
D: PineCoders' original function: To see how this behaves, show options A, B, and D. Set the {H} value in the settings to 0, then 1.
The PineCoders' original function (D) and extended function (E) do not have the same limitations as this library, described in the Limitations section.
This option has all of the same advantages that this library function, option A, does, with the following differences:
+ It cannot access historical data. The {H} setting makes no difference.
+ It always updates at the open of the first chart bar in a new HTF bar.
By contrast, this library function, option A, is configured by default to update at the close of the last chart bar in a HTF bar.
This little frontrunning is only a few seconds but could be significant in trading. E.g. on a 1D HTF with a 4H chart, an alert that involves a HTF change set to trigger ON CLOSE would trigger 4 hours later using this method -
but use exactly the same value. It depends on the market and timeframe as to whether you could actually trade this. E.g. at the very end of a tradfi day your order won't get executed.
This behaviour mimics how security() itself updates, as is easy to see on the chart. If you don't want it, just set in_updateEarly to false. Then it matches option D exactly.
E: PineCoders' function, extended to get history: To see how this behaves, show options A and E. Set the {H} value in the settings to 0, then 1.
I modified the original function to be able to get historical values. In all other respects it is the same.
Apart from not having the option to update earlier, the only disadvantage of this method vs this library function is that it requires one security() call for each historical operator.
For example, if you wanted live data, and fixed data, and fixed data one bar back, you would need 3 security() calls. My library function requires just one.
This is the essential tradeoff: extra complexity and less robustness in certain circumstances (the PineCoders function is simple and universal by comparison) for more flexibility with fewer security() calls.

Multi-Timeframe 10XIMPORTANT NOTE:
-> The timeframe for this indicator must be set at 1 minute;
-> If the chart timeframe is higher than 1 minute, the results shown in the table for timeframes lower than the chart will not be correct;
-> Tradingview's own documentation explains this as follows: " It is not recommended to request data of a timeframe lower that the current chart timeframe, for example 1 minute data from a 5 minutes chart. The main problem with such a case is that some part of a 1 minute data will be inevitably lost, as it’s impossible to display it on a 5 minutes chart and not to break the time axis. In such cases the behavior of security can be rather unexpected "; and
-> It is therefore recommended that this indicator is placed in a standalone 1min chart window, and the window resized to only show the table to avoid any issues.
Credits:
-> J. Welles Wilder creating the Directional Movement System (DMS) (1978); and
-> John Carter applying the DMS to create the popular Simpler Trading 10X Bars indicator.
Introduction:
Quickly see the quality and strength of a trend based on Directional Movement Index (DMI).
The Average Directional Index (ADX), Minus Directional Indicator (-DI) and Plus Directional Indicator (+DI) represent a group of directional movement indicators that form a trading system developed by Welles Wilder. Although Wilder designed his Directional Movement System with commodities and daily prices in mind, these indicators can also be applied to stocks. Wilder determined directional movement by comparing the difference between two consecutive lows with the difference between their respective highs.
+DI and -DI are derived from smoothed averages of these differences and measure trend direction over time. These two indicators are often collectively referred to as the DMI. ADX is in turn derived from the smoothed averages of the difference between +DI and -DI; it measures the strength of the trend (regardless of direction) over time.
Trade Signals:
-> Green indicates an uptrend i.e. when +DI is above -DI and ADX is greater than 20 - there is more upward pressure than downward pressure in the price;
-> Red indicates a downtrend i.e. when -DI is above +DI and ADX is greater than 20 - there is more downward pressure on the price; and
-> Yellow indicates no strong directional trend and potential for a reversal.
Standalone Indicator:
The 10X Bars version of the indicator can be found here:

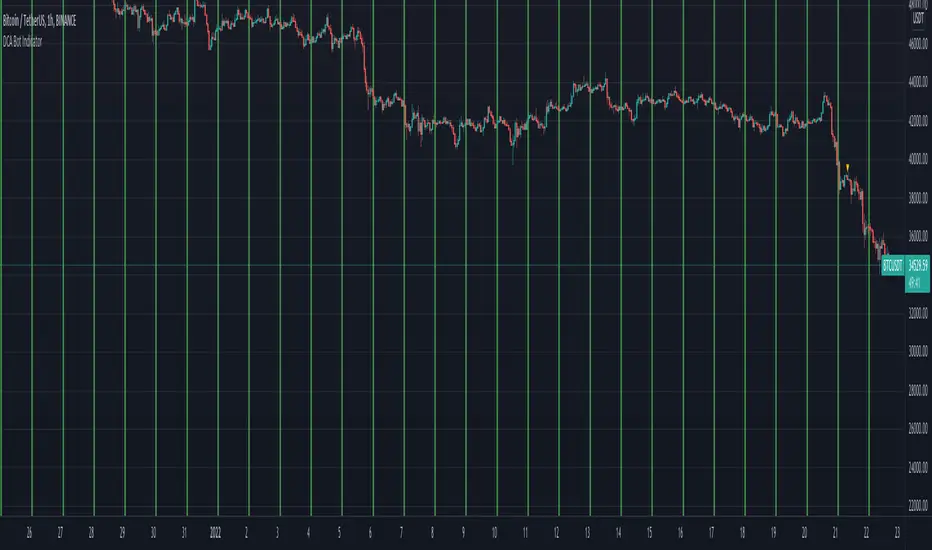
DCA Bot IndicatorName: DCA Bot Indicator
Category: Dollar Cost Average.
Operating mode: Alerts at a specific time, day of the week and day of the month.
Trades duration: N/A.
Timeframe: 1H
Suggested usage: long-term investing DCA strategies.
Entry: Only indicates the time and then the day of the week or the day of the month to buy.
Exit: As per long-term Investor’s strategy.
Usage: If you want to perform a Dollar Cost Averaging approach with:
- Daily purchases (at a specific time)
- Weekly purchases (at a specific time and day of the week)
- Monthly purchases (at a specific time and day of the month)
It is then possible to set the alert text with a preferred message or for use with trade automation systems. The green background identify the specific time chosen.
It is possible to identify through the Bias Analyzer the best time for the daily purchase.
Configuration:
- Buy Time: hour you would like to buy, please consider that the script is executed at the end of the defined time, so if you would like to buy at 2, have to put 1.
- Buy only Days of the Week: you can select the day you want.
- Buy only on Day of Month, you can specify a specific day.
Credits:
- dsteaves for inspiration
Multi-Timeframe TTM Squeeze Pro
IMPORTANT NOTE:
-> The timeframe for this indicator must be set at 1 minute;
-> If the chart timeframe is higher than 1 minute, the results shown in the table for timeframes lower than the chart will not be correct;
-> Tradingview's own documentation explains this as follows: " It is not recommended to request data of a timeframe lower that the current chart timeframe, for example 1 minute data from a 5 minutes chart. The main problem with such a case is that some part of a 1 minute data will be inevitably lost, as it’s impossible to display it on a 5 minutes chart and not to break the time axis. In such cases the behavior of security can be rather unexpected "; and
-> It is therefore recommended that this indicator is placed in a standalone 1min chart window, and the window resized to only show the table to avoid any issues.
Credits:
-> John Carter creating the TTM Squeeze and TTM Squeeze Pro
-> Lazybear's original interpretation of the TTM Squeeze: Squeeze Momentum Indicator
-> Makit0's evolution of Lazybear's script to factor in the TTM Squeeze Pro upgrades - Squeeze PRO Arrows
This is my version of their collective works, with amendments primarily to the Squeeze Conditions to more accurately reflect the color coding used by the official TMM Squeeze Pro indicator.
TTM Squeeze Guide
For those unfamiliar with the TTM Squeeze, it is simply a visual way of seeing how Bollinger Bands (standard deviations from a simple moving average ) relate to Keltner Channels ( average true range bands) compared with the momentum of the price action. The concept is that as Bollinger Bands compress within Keltner Channels , price volatility decreases, giving way for a potential explosive price movement up or down.
Differences between the original TTM Squeeze and TTM Squeeze Pro:
-> Both use a 2 standard deviation Bollinger Band ;
-> The original squeeze only used a 1.5 ATR Keltner Channel; and
-> The pro version uses 1.0, 1.5 and 2.0 ATR Keltner Channels .
The pro version therefore helps differentiate between levels of squeeze (compression) as the Bollinger Bands moves through the Keltner Channels i.e. the greater the compression, the more potential for explosive moves - less compression means more squeezing.
The Histogram shows price momentum whereas the colored dots (along the zeroline) show where the Bollinger Bands are in relation to the Keltner Channels:
-> Cyan Bars = positive, increasing momentum;
-> Blue Bars = positive, decreasing momentum (indication of a reversal in price direction);
-> Red Bars = negative, increasing momentum;
-> Yellow Bars = negative, decreasing momentum (indication of a reversal in price direction);
-> Orange Dots = High Compression / large squeeze (One or both of the Bollinger Bands is inside the 1st (1.0 ATR) Keltner Channel);
-> Red Dots = Medium Squeeze (One or both of the Bollinger Bands is inside the 2nd (1.5 ATR) Keltner Channel);
-> Black Dots = Low compression / wide squeeze (One or both of the Bollinger Bands is inside the 3rd (2.0 ATR) Keltner Channels );
-> Green Dots = No Squeeze / Squeeze Fired (One or both of the Bollinger Bands is outside of the 3rd (2.0 ATR) Keltner Channel).
Ideal Scenario:
As the ticker enters the squeeze, black dots would warn of the beginning of a low compression squeeze. As the Bollinger bands continue to constrict within the Keltner Channels , red dots would highlight a medium compression. As the price action and momentum continues to compress an orange dot shows warning of high compression. As price action leaves the squeeze, the coloring would reverse e.g. orange to red to black to green. Any compression squeeze is considered fired at the first green dot that appears.
Note: This is an ideal progression of the different types of squeezes, however any type of squeeze (and color sequence) may appear at anytime, therefore the focus is primarily on the green dots after any type of compression.
Entry and Exit Guide:
-> John Carter recommends entering a position after at least 5 black dots or wait for 1st green dot ; and
-> Exit on second blue or yellow bar or, alternatively, remain in the position after confirming a continuing trend through a separate indicator.
Standalone Indicator:
The indicator (which can be used on any timeframe) can be found here:

Chikou Support and Resistance by TheSocialCryptoClubName: Chikou Supports and Resistances
Category: Indicator
Timeframe: Any Timeframe.
Description: Chikou Support and Resistance is an indicator which allows to represent on the chart the price structures identified by the cusps formed by the Ichimoku Kinko Hyo Chikou, Chikou is the line chart of close price projected in the past as per Kijun periods.
Suggested usage: Use on any timeframe. It is possible to calculate cusp only in a certain period and in a different time frame, and select those calculated by specific lines.
Technical Details: Internally it uses an Array to store the levels of when the Chikou bounces using the Zig-Zag indicator. At the last bar it prints the various lines on the screen.
Credits:
- Techniques has been explained by Corrado Rondelli in "Strategie di trading con l’indicatore Ichimoku Kinko Hyo"
- It is based on the Zig-Zag indicator of TradingView to calculate the Zig-Zag.

Ichimoku Support and Resistance by TheSocialCryptoClubName: Ichimoku Supports and Resistances
Category: Indicator
Timeframe: Any Timeframe.
Description: Ichimoku Support and Resistance is an indicator which allows to represent on the chart the price structures identified through the flat zones of the various lines of the Ichimoku Kinko Hyo indicator
Suggested usage: Use on any timeframe. It is possible to calculate flat zones only in a certain period and in a different time frame, and select those calculated by specific lines.
Technical Details: Internally it uses an Array to store the levels of when a line is flat (calculating the distance to the previous one). At the last bar it prints the various lines on the screen.
Credits:
- Some of the indications has been explained by Corrado Rondelli in "Strategie di trading con l’indicatore Ichimoku Kinko Hyo"

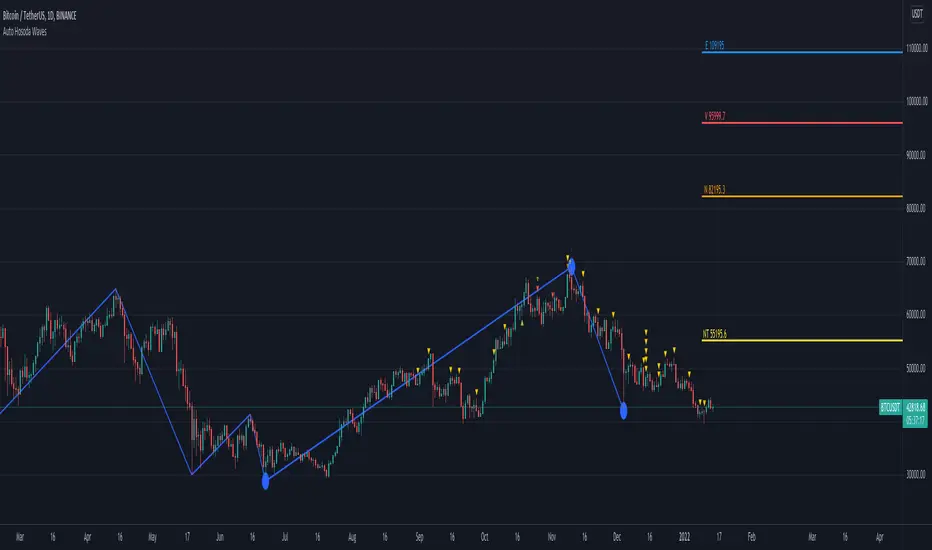
Auto Hosoda Waves by TheSocialCryptoClubName: Auto Hosoda Waves
Category: Indicator
Timeframe: Any Timeframe.
Description: Auto Hosoda Waves uses Zig-Zag to calculate bullish and bearish impulses.It then considers the last Zig-Zag movements to calculate the ABC pattern
Suggested usage: Use on any timeframe. From the configuration of the indicator it is possible to calculate waves also from past ABC patterns, so as to adapt to the trader's intuition.
Technical Details: Internally uses the Zig-Zag indicator for understanding the bounces. From bounces identifies the ABC patterns and uses the Hosoda Waves formulas to print the levels on the screen.
Credits:
- Technique has been explained by Corrado Rondelli in “Ichimoku Kinko Hyo. Operatività sui mercati”
- It is based on the Zig-Zag indicator of TradingView to calculate the Zig-Zag.
- Hosoda Waves calculation from Hosoda Waves by Rexio and modified by PawTar
Tenkan Higher Time Frame by TheSocialCryptoClubName: Tenkan HTF
Category: Indicator.
Timeframe: Any Timeframe
Description: Tenkan Higher Timeframe allows to visualise the Tenkan for the Current timeframe and one at a higher timeframe.
Suggested usage: Use on Daily to evaluate the Weekly Tenkan.
Technical Details: When the Tenkan changes direction, it is evaluated if the change is due to the creation of new highs or new lows - so what happened in the last candle, a symptom of strength or weakness - or if the change is due to the fact that the "outgoing" candle had lows or highs that were no longer present in the Tenkan period.
This indicator can also be used - by setting the appropriate period length - for the Kijun.
Credits:
- Technique has been explained by Corrado Rondelli.

Stage AnalysisThis indicator helps in identification of stage cycle of a stock. Only to be analysed on Weekly and Daily timeframe.
Stages
Stage 1 - Accumulation phase of a stock
Stage 2 - Uptrend phase
Stage 3 - Distribution phase
Stage 4 - Downtrend
As shown in the chart, each stock go through its stage cycle. Below points confirms the uptrend of a stock
This will give idea of when to buy a stock
Wait for first green label up bar to appear which is confirmation for stage 1 completion
Another green label appears which will indicate stage 2 is starting
Finally yellow label up appears which confirms the stage 2 uptrend
Once the yellow bar appears, Wait for a base to be formed then go for buy.
credits: Inspired from @BigBitsIO tutorials and @finallynitin

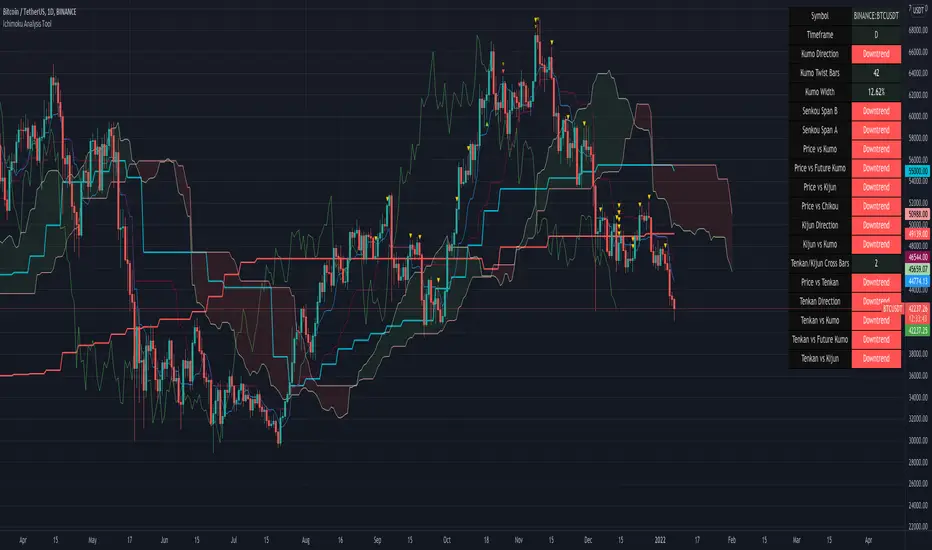
Ichimoku Analysis Tool by TheSocialCryptoClubName: Ichimoku Analysis Tool
Category: Indicator.
Timeframe: Any Timeframe
Description: Ichimoku Analysis Tool is an assistant for the trader to visualize the information that can be perceived at a glance from the Ichimoku Kinko Hyo indicator.
Suggested usage: Use on Daily to evaluate the general long term, short term and mid term situation.
Technical Details: Each cell of the table describes an element of the Ichimoku by simply assessing the direction of the lines - or whether they are flat - and how they are positioned with each other (e.g. Tenkan above or below the Kijun) and in general how long ago the last Kumo Twist was and the width in percent of the Kumo.
Credits:
- Some of the indications has been explained by Corrado Rondelli
- Table has been inspired by tanayroy's ICHIMOKU Trading beta
lib_Indicators_DTLibrary "lib_Indicators_DT"
This library functions returns some Moving averages and indicators.
Created it to feed my indicator/strategy "INDICATOR & CONDITIONS COMBINATOR FRAMEWORK v1 " which I will publish it as soon as possible.
Credits: Library includes some public indicators, snippets from tradingview & @03.freeman's ("All MAs displayed") scripts.
(I hope, I dont break Tradingview's House Rules on Script Publishing)
f_plotPrep(src_, src_, src_, src_) Prepare Indicator Plot Type
Parameters:
src_ : Source
src_ : plotingType_ "Original, Stochastic, Percent"
src_ : stochlen_ Stochasting plottingtype length
src_ : plotSWMA_ Use SWMA for the output
Returns: Return the prepared indicator
f_funcPlot(string, float, simple, string, simple, bool) f_funcPlot(string f, float src_, simple int length_, string plotingType_ = "Original", simple int stochlen_=50, bool plotSWMA=false) Return selected indicator value with different parameters
Parameters:
string : f indicator-> options=
float : src_ close,open.....
simple : int length_ indicator length
string : plotingType return param-> options= ['Original', 'Stochastic', 'PercentRank')
simple : int stochlen_ length for return Param
bool : plotSWMA Use SWMA on Plot
Returns: float

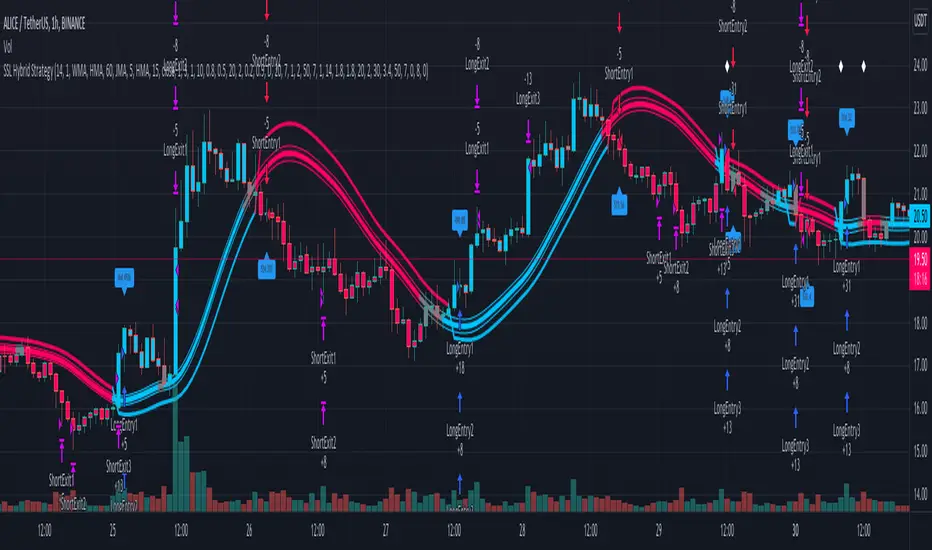
SSL Hybrid StrategyStrategy based on the SSL Hybrid indicator by Mihkel00
Designed for the purpose of back testing
Strategy:
Enters both long and short trades based on SSL1 crossing the baseline
Stop Loss calculated based on ATR multiplier
Option to allow moving of Stop Loss to break even on TP1
Option to turn off Stop Loss and Take Profit which will rely on indicator flip to exit from position
Take Profits configurable with up to 5 ATR multipliers and exits percentages (percentages calculated as percentages of original position size, eg. 100 tokens with 3 TPs of 20, 30, 50 would exit the same number of tokens on each TP)
Credits:
SSL Hybrid Mihkel00 www.tradingview.com
+ BB %B: MA selection, bar coloring, multi-timeframe, and alerts+ %B is, at its simplest, the classic Bollinger Bands %B indicator with a few added bells and whistles.
However, the right combination of bells and whistles will often improve and make a more adaptable indicator.
Classically, Bollinger Bands %B is an indicator that measures volatility, and the momentum and strength of a trend, and/or price movements.
It shows "overbought" and "oversold" spots on a chart, and is also useful for identifying divergences between price and trend (similar to RSI).
With + %B I've added the options to select one or two moving averages, candle coloring, and a host of others.
Let's start with the moving averages:
There are options for two: one faster and one slower. Or combine them how you will, or omit one or both of them entirely.
Here you will find options for SMA, EMA (as well as double and triple), Hull MA, Jurik MA, Least Squares MA, Triangular MA, Volatility Adjusted MA, and Weighted MA.
A moving average essentially helps to define trend by smoothing the noise of movements of the underlying asset, or, in this case, the output of the indicator.
All of these MAs available track this in a different way, and it's up to the trader to figure out which makes most sense to him/her.
MA's, in my opinion, improve the basic %B by providing a clearer picture of what the indicator is actually "seeing", and may be useful for providing entries and exits.
Next up is candle coloring:
I've added the option for this indicator to color candles on the chart based on where the %B is in relation to its upper and lower bounds, and median line.
If the %B is above the median but below the upper bound, candles will be green (showing bullish market structure). If %B is below the median but above the lower bound, candles will be red (denoting bearish market structure).
Overbought and oversold candles will also be colored on the chart, so that a quick glance will tell you whether price action is bullish/bearish or "oversold"/"overbought".
I've also added functionality that enables candles to be colored based on if the %B has crossed up or crossed down the primary moving average.
One example as a way to potentially use these features is if the candles are showing oversold coloration followed by the %B crossing up your moving average coloration. You might consider a long there (or exit a short position if you are short).
And the last couple of tweaks:
You may set the timeframe to whatever you wish, so maybe you're trading on the hourly, but you want to know where the %B is on the 4h chart. You can do that.
The background fill for the indicator is split into bullish and bearish halves. Obviously you may turn the background off, or make it all one color as well.
I've also added alerts, so you may set alerts for "overbought" and "oversold" conditions.
You may also set alerts for %B crossing over or under the primary moving average, or for crossing the median line.
All of these things may be turned on and off. You can pretty much customize this to your heart's delight. I see no reason why anyone would use the standard %B after playing with this.
I am no coder. I had this idea in my head, though, and I made it happen through referencing another indicator I was familiar with, and watching tutorials on YouTube.
Credits:
Firstly, thanks to www.tradingview.com for his brilliant, free tutorials on YouTube.
Secondly, thanks to www.tradingview.com for his beautiful SSL Hybrid indicator (and his clean code) from which I obtained the MAs.
Please enjoy this indicator, and I hope that it serves you well. :)

RSI + MFI - Crypto Bull and Bear market A fancy styled version of the RSI (Relative Stochastic Index) + MFI (Money Flow Index) oscillators in order to emphasize buy and sell opportunities.
The 80 and 20 Bands are meant to be used in Bull or Bear markets. Better performing in D timeframes.
The circles represent the cross between RSI and MFI .
Designed for Crypto Markets
Thanks @micheleprandina
Credits:

[A618] Trend Tracker using Chandelier StopTrend Tacker
Works on ATR concepts and uses "Chandelier Stop by pipCharlie" as its main engine
How it is calculated
> 2 ATR stop plots are plotted
> #one ATR stop is of current time frame
> other one is the 5 times multiple of the current timeframe
> Their crossovers are analysed with the close of Current Timeframe
> This sort of methodology can help one with generating consistent entry signals over a particular timeframe
> My timeframe of choice is : 5 mins
> I have used resolution of 25, for 5 mins (see 5*5 =25)
Credits:
Chandelier Stop by pipCharlie
Hope this helps!!!

Floor Pivots_DWMBasic Pivot points.
Script is easy to modify to personal requirements, and explained step-by-step on Kodify.com.
Original script credits: Kodify.com (kodify.net)

Statistical Histogram with configurable bins and Data WindowCreates a Histogram for Statistical Analysis of any source.
Input Parameters:
Sample Source: Select your source here, can be any numerical source.
Sample Period: Sample size for Mean and Standard Deviation Calculations.
Enable Cumulative Mode: Will attempt to calculate the bin for every sample in the entire dataset.
Window Period: Used only in Window Mode (Enable Cumulative Mode unchecked), Calculates the bin for the past Window Period sample size.
Bin Label Spacing: Adjust horizontal spacing of Bin Labels below the histogram for easier viewing.
Center Bin: Selects the center Bin, usually set to (0 - Bin Width) < Sample <= 0 standard deviations or (z_score)
Bin Width: Selects the Bin Width in standard deviations.
How you can use it:
View characteristics of dataset such as unimodal/bimodal and skewness to determine preferred statistical analysis.
Additional Reference:
en.wikipedia.org
en.wikipedia.org
Credits:
Thanks goes out to www.tradingview.com , for cleaning up some of the code and www.tradingview.com for the original idea.
Usage Tips:
When adjusting the bin parameters, center bin and bin width, verify that the total sum of the bins (Sum Frequency in the Data Window) is close to the Total Samples. If your Sum Frequency is drastically lower it means you need to adjust your center bin and/or bin width to capture more of the data available.

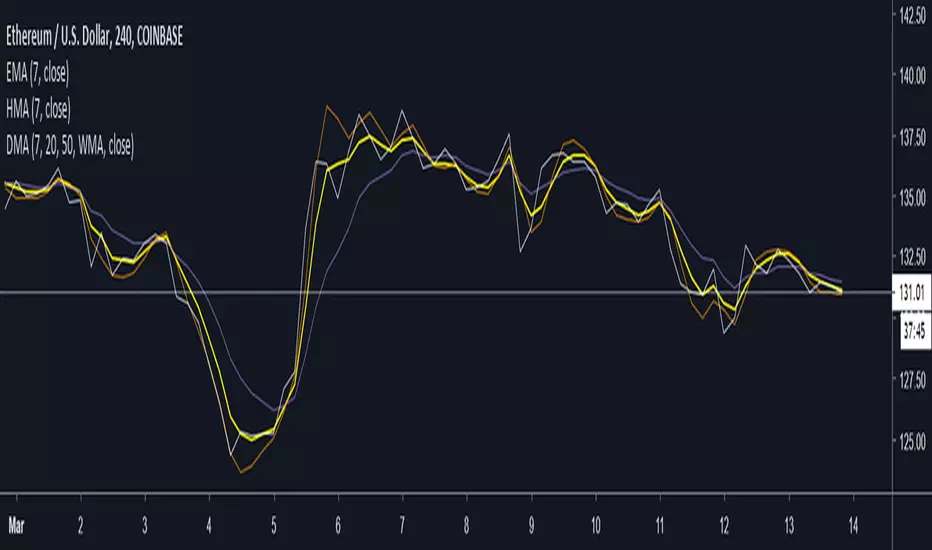
Dickinson Moving Average (DMA)Implementation of the "Dickinson Moving Average" from the r/algotrading post by Nathan Dickinson
Quoted from the author of the Dickinson Moving Average:
"I was experimenting with the “zero lag” code from John Ehlers and the Hull Moving Average and noticed that they seemed to respond in complementary ways when properly set up. With the right starting values, they blend together to make a moving average which responds with one (or maybe even half a bar) of lag. To my eye, it looks to be almost as good as the Jurik Moving Average."
Optional parameter input available to use Exponential Hull Moving Average (EHMA) instead of WMA for the Hull MA is available.
Acknowledgements/Credits:
Nathan Dickinson, Dickinson Moving Average
@RicardoSantos, Function for Hull Moving Average
Exponential Hull Moving Average sourced from:
// Raudys, Aistis & Lenčiauskas, Vaidotas & Malčius, Edmundas. (2013). Moving Averages for Financial Data Smoothing.
// Communications in Computer and Information Science. 403. 34-45. 10.1007/978-3-642-41947-8_4.
@Everget, Jurik Moving Average
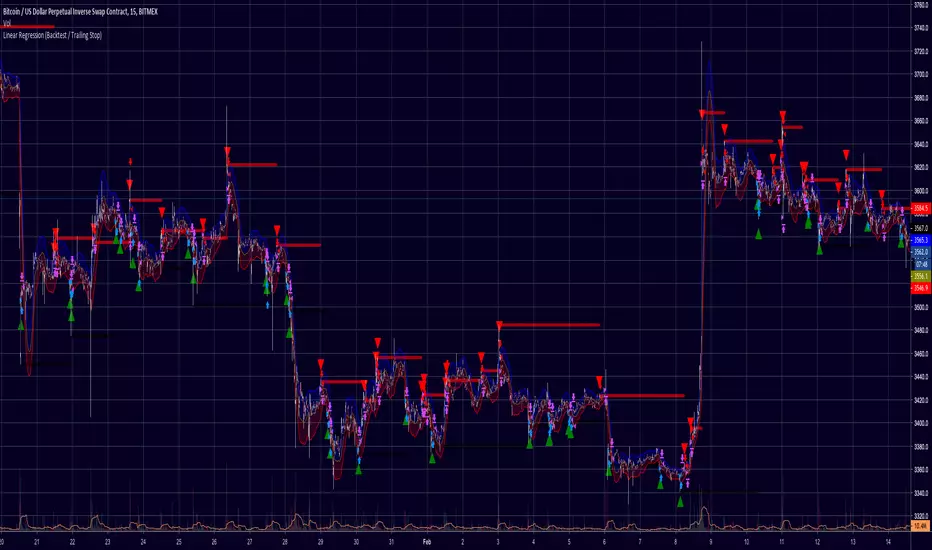
Linear Regression (Backtest / Trailing Stop)A Strategy with Backtest and Trailing Stop for Long/Short
Credits: Study by RafaelZioni - Thanks buddy!
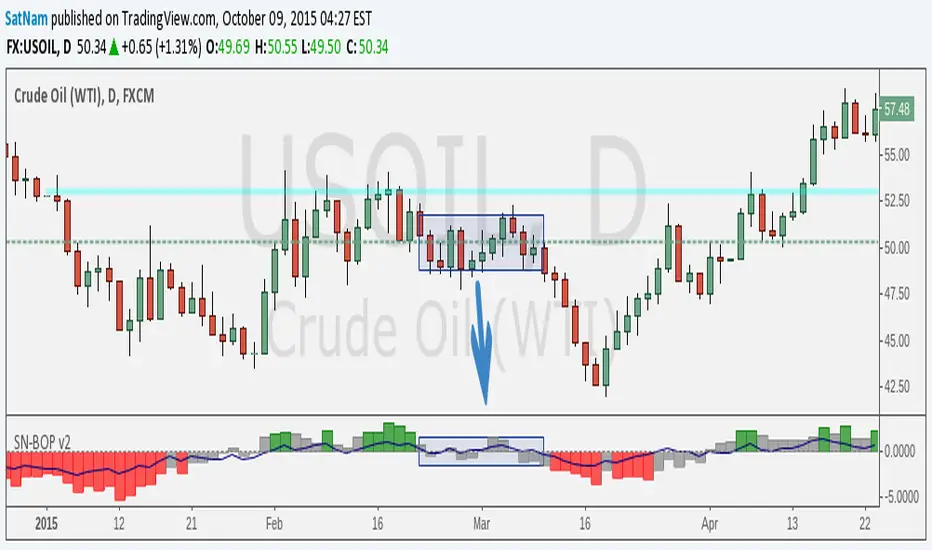
SN Smoothed Balance of Power v2Hi all,
here is an updated version of the indicator script I published yesterday.
The goal of this indicator is to try and find darkpool activity. The indicator itself is not enough to fully identify darkpool but it should be able to detect quiet accumulation. What makes this Balance of Power different from others on TV is that it is smoothed by using a moving average.
Notes:
- The values that are default are completely arbitrary except for the VWMA length (a 14-day period for the 1D chart is the norm). For instance the limit where it shows red/green I picked because it works best for the 1D chart I am using. Other TF's and charts will need tweaking of all the values you find in the options menu to get the best results.
- I modified the indicator such that it is usable on charts that do not show volume. HOWEVER, this chart is default to NYMEX: CL1!. To get different volume data this needs to be changed in the option menu.
- I am in no way an expert on darkpool/HFT trading and am merely going from the information I found on the internet. Consider this an experiment.
Credits:
- Lazybear for some of the plotting-code
- Igor Livshin for the formula
- TahaBintahir for the Symbol-code (although I'm not sure who the original author is...)