Adaptive Volume-Weighted RSI (AVW-RSI)Concept Summary
The AVW-RSI is a modified version of the Relative Strength Index (RSI), where each price change is weighted by the relative trading volume for that period. This means periods of high volume (typically driven by institutions or “big money”) have a greater influence on the RSI calculation than periods of low volume.
Why AVW-RSI Helps Traders
Avoids Weak Signals During Low Volume
Standard RSI may show overbought/oversold zones even during low-volume periods (e.g., during lunch hours or after news).
AVW-RSI gives less weight to these periods, avoiding misleading signals.
Amplifies Strong Momentum Moves
If RSI is rising during high volume, it's more likely driven by institutional buying—AVW-RSI reflects that stronger by weighting the RSI component.
Filters Out Retail Noise
By prioritizing high-volume candles, it naturally discounts fakeouts caused by thin markets or retail-heavy moves.
Highlights Institutional Entry/Exit
Useful for spotting hidden accumulation/distribution that classic RSI would miss.
How It Works (Calculation Logic)
Traditional RSI Formula Recap
RSI = 100 - (100 / (1 + RS))
RS = Average Gain / Average Loss (over N periods)
Modified Step – Apply Volume Weight
For each period
Gain_t = max(Close_t - Close_{t-1}, 0)
Loss_t = max(Close_{t-1} - Close_t, 0)
Weight_t = Volume_t / AvgVolume(N)
WeightedGain_t = Gain_t * Weight_t
WeightedLoss_t = Loss_t * Weight_t
Weighted RSI
AvgWeightedGain = SMA(WeightedGain, N)
AvgWeightedLoss = SMA(WeightedLoss, N)
RS = AvgWeightedGain / AvgWeightedLoss
AVW-RSI = 100 - (100 / (1 + RS))
Visual Features on Chart
Line Color Gradient
Color gets darker as volume weight increases, signaling stronger conviction.
Overbought/Oversold Zones
Traditional: 70/30
Suggested AVW-RSI zones: Use dynamic thresholds based on historical volatility (e.g., 80/20 for high-volume coins).
Volume Spike Flags
Mark RSI turning points that occurred during volume spikes with a special dot/symbol.
Trading Strategies with AVW-RSI
1. Weighted RSI Divergence
Regular RSI divergence becomes more powerful when volume is high.
AVW-RSI divergence with volume spike is a strong signal of reversal.
2. Trend Confirmation
RSI crossing above 50 during rising volume is a good entry signal.
RSI crossing below 50 with high volume is a strong exit or short trigger.
3. Breakout Validation
Price breaking resistance + AVW-RSI > 60 with volume = Confirmed breakout.
Price breaking but AVW-RSI < 50 or on low volume = Potential fakeout.
Example Use Case
Stock XYZ is approaching a resistance zone. A trader sees:
Standard RSI: 65 → suggests strength.
Volume is 3x the average.
AVW-RSI: 78 → signals strong momentum with institutional backing.
The trader enters confidently, knowing this isn't just low-volume hype.
Limitations / Tips
Works best on liquid assets (Forex majors, large-cap stocks, BTC/ETH).
Should be used alongside price action and volume analysis—not standalone.
Periods of extremely high volume (news events) might need smoothing to avoid spikes.
在腳本中搜尋"Relative"

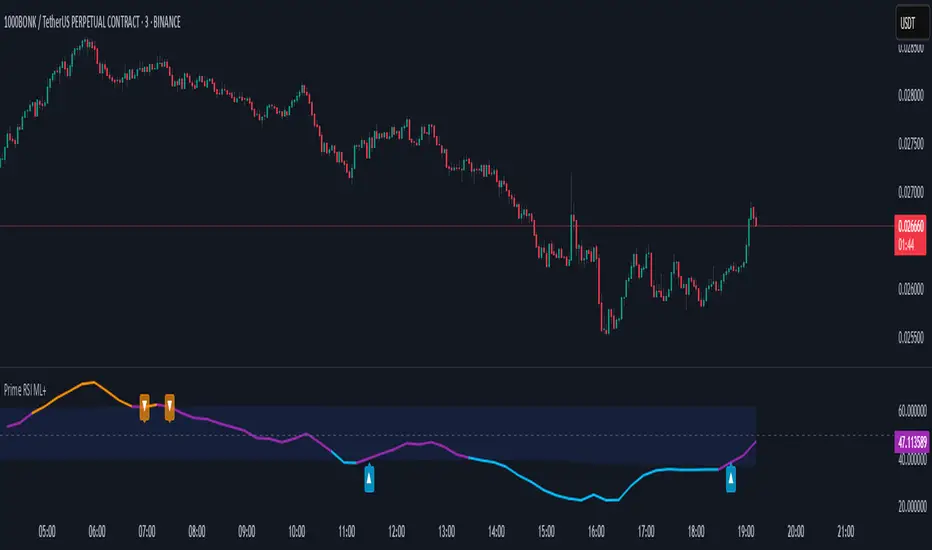
prime rsiThe "PRIME RSI" is a custom variation of the traditional RSI (Relative Strength Index) that offers enhanced flexibility and precision. This indicator provides an adaptable approach for tracking market conditions across different timeframes, making it an ideal tool for both short-term and long-term traders.
Key Features:
Custom Timeframe Selection: Users can select any timeframe to calculate the RSI, providing the ability to analyze data beyond the current chart's timeframe.
Smoothing Methods: Choose between Exponential Moving Average (EMA), Simple Moving Average (SMA), or the Relative Moving Average (RMA) for smoother, more accurate RSI values.
Signal Line: The signal line is smoothed using the selected method and visualized with dynamic coloring to indicate bullish (green) or bearish (red) market conditions.
Overbought/Oversold Levels: Clear levels at 70 (overbought) and 30 (oversold), with fill zones to highlight extreme market conditions, helping traders spot potential reversal points.
Midline at 50: The centerline at 50 serves as a neutral zone, allowing traders to identify shifts in market momentum quickly.
Practical Use:
Trend Confirmation: Use the PRIME RSI to confirm the prevailing market trend, with signals above 50 suggesting bullish momentum and signals below 50 indicating bearish trends.
Overbought/Oversold Conditions: The indicator’s overbought and oversold regions help pinpoint potential market reversals, giving traders valuable entry and exit signals.
Ideal For: All types of traders who want a more flexible and customizable RSI for better trend analysis, especially those working with smaller timeframes or seeking a more responsive momentum indicator.
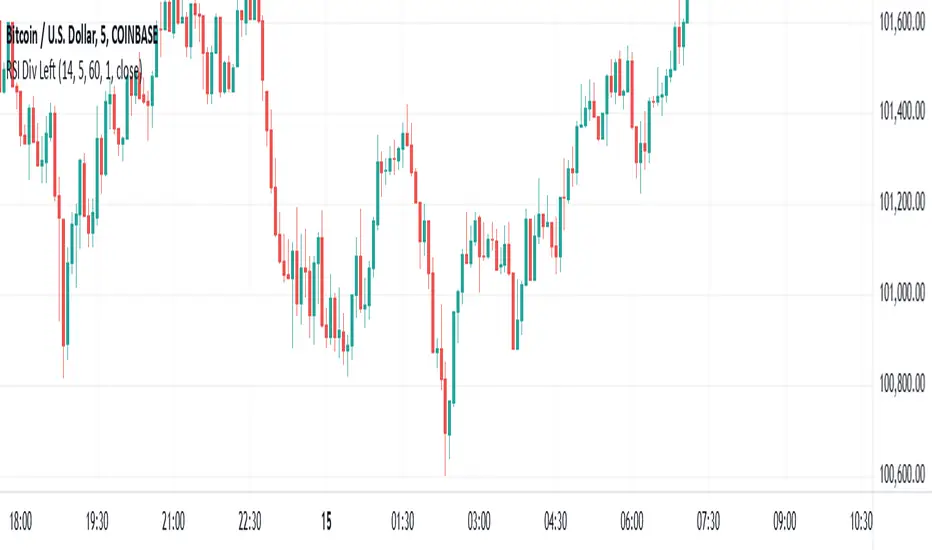
RSI Divergence - Left Candles Onlyrsi
The **RSI Divergence** indicator in this script is designed to highlight **divergence** between the **Relative Strength Index (RSI)** and **price action** on a chart. Divergence can be a key signal for potential trend reversals or continuation in technical analysis.
### **Key Components of the Indicator:**
1. **RSI Calculation:**
- The **Relative Strength Index (RSI)** is calculated using a typical 14-period length, but the user can customize this input.
- RSI is a momentum oscillator that measures the speed and change of price movements, oscillating between 0 and 100. Values above 70 indicate overbought conditions, and values below 30 indicate oversold conditions.
2. **Divergence Logic:**
- **Bullish Divergence:** Occurs when the price forms a **lower low**, but the RSI forms a **higher low**. This suggests that despite price continuing to drop, momentum (RSI) is strengthening, which may indicate a potential price reversal to the upside.
- **Bearish Divergence:** Occurs when the price forms a **higher high**, but the RSI forms a **lower high**. This indicates that even though price is rising, the momentum (RSI) is weakening, which could signal a price reversal to the downside.
3. **Pivot Identification:**
- The script identifies **pivot points** (local highs and lows) on both price and RSI.
- **Bullish Divergence:** A lower price low with a higher RSI low.
- **Bearish Divergence:** A higher price high with a lower RSI high.
4. **Lookback Periods:**
- **Lookback Left (lookbackLeft):** Defines the number of bars to look back for pivot confirmation. This allows for adjusting the sensitivity of the divergence.
- The **divergence range** is constrained by two parameters:
- **Minimum range (rangeLower):** The minimum number of bars for divergence to be considered.
- **Maximum range (rangeUpper):** The maximum number of bars for divergence to be considered.
5. **Signal Generation and Plotting:**
- When a **bullish divergence** is detected, a **green label** is plotted below the bar where the divergence occurs.
- When a **bearish divergence** is detected, a **red label** is plotted above the bar.
- The script uses **`plotshape()`** to plot these labels on the chart.
6. **Alerts:**
- Alerts are configured for both **bullish** and **bearish divergences** so that you can be notified when a divergence signal occurs.
---
### **How the Indicator Works:**
- The RSI and price action are compared using **pivots**: The script checks whether the price and RSI are forming new highs or lows within the specified **lookback period**.
- If the conditions for divergence (higher/lower RSI pivot vs price pivot) are met, a signal is plotted on the chart.
- The script helps to visually identify potential reversal points and allows users to set alerts for these divergence signals.
---
### **Use Case:**
- This script is useful for traders looking to trade potential trend reversals based on **divergence** between price and RSI.
- **Bullish divergence** can indicate a **buy** opportunity, while **bearish divergence** can suggest a **sell** opportunity.
- The indicator works best in **volatile markets** and when combined with other technical analysis tools for confirmatio
RSI Overlay Table - 30 Tickers Sorted with ColorOverview
The RSI Overlay Table script provides traders with a powerful tool to monitor the Relative Strength Index (RSI) across multiple tickers in real-time. This script enables users to keep track of up to 30 different assets simultaneously, displaying their RSI values in an easy-to-read table format directly on the chart. It helps traders identify overbought and oversold conditions quickly, enhancing their ability to make informed trading decisions.
Key Features
Monitor Multiple Tickers: Track the RSI values of up to 30 different tickers at once. This allows users to have a broad view of market conditions across various assets without the need to switch between charts.
Dynamic RSI Calculations: The script calculates the RSI using the user-defined length, providing flexibility to adjust sensitivity based on the trading strategy. The default RSI length is set to 14, a commonly used period in technical analysis.
Customizable Overbought and Oversold Levels: Users can define their own overbought and oversold RSI levels, allowing them to tailor the script to their trading style. By default, the overbought level is set at 70, and the oversold level is set at 30.
Hide Neutral Rows Option: To help traders focus on the most critical signals, the script includes an option to hide rows where the RSI values are neither overbought nor oversold. This feature helps traders concentrate on assets that are more likely to experience a price reversal.
Color-Coded Alerts: The script highlights overbought and oversold conditions with distinct colors:
Red: Indicates that the asset is overbought (RSI above the user-defined overbought level).
Green: Indicates that the asset is oversold (RSI below the user-defined oversold level).
How to Use the RSI Overlay Table Script
Input Tickers: Enter up to 30 ticker symbols in the script settings. The script will automatically fetch the RSI values for each ticker and display them in the overlay table on the chart.
Adjust RSI Settings: Modify the RSI length and the overbought/oversold levels according to your trading strategy. These settings can be adjusted in the script input panel.
Use the Hide Neutral Rows Option: Toggle the “Hide Neutral Rows” option to focus only on tickers that are in overbought or oversold conditions. This feature is useful for traders who wish to filter out less significant signals and only act on strong RSI indicators.
Interpret the Table: The table will display each ticker symbol alongside its current RSI value. Tickers with RSI values above the overbought level will be highlighted in red, suggesting a potential sell signal. Tickers with RSI values below the oversold level will be highlighted in green, indicating a potential buy signal.
Application and Strategy
The RSI Overlay Table script is designed for traders who manage multiple assets and need to monitor their technical indicators efficiently. It is particularly useful for:
Swing Traders: Identifying overbought and oversold conditions to time entries and exits.
Portfolio Managers: Monitoring the relative strength of various assets in a portfolio.
Scalpers: Quickly spotting extreme price movements across multiple assets.
Notes
This script is intended to be used as a supplementary tool for technical analysis. Always use it in conjunction with other indicators and market analysis techniques.
The RSI values and signals provided by this script should not be taken as financial advice.
The RSI Overlay Table script provides a clear and efficient way to track RSI values across multiple assets, helping traders make more informed decisions. By offering customizable settings and a clean, color-coded interface, this tool aims to enhance the user's trading experience and streamline their analysis process.

RSI Analysis with Statistical Summary Scientific Analysis of the Script "RSI Analysis with Statistical Summary"
Introduction
I observed that there are outliers in the price movement liquidity, and I wanted to understand the RSI value at those points and whether there are any notable patterns. I aimed to analyze this statistically, and this script is the result.
Explanation of Key Terms
1. Outliers in Price Movement Liquidity: An outlier is a data point that significantly deviates from other values. In this context, an outlier refers to an unusually high or low liquidity of price movement, which is the ratio of trading volume to the price difference between the open and close prices. These outliers can signal important market changes or unusual trading activities.
2. RSI (Relative Strength Index): The RSI is a technical indicator that measures the speed and change of price movements. It ranges from 0 to 100 and helps identify overbought or oversold conditions of a trading instrument. An RSI value above 70 indicates an overbought condition, while a value below 30 suggests an oversold condition.
3. Mean: The mean is a measure of the average of a dataset. It is calculated by dividing the sum of all values by the number of values. In this script, the mean of the RSI values is calculated to provide a central tendency of the RSI distribution.
4. Standard Deviation (stdev): The standard deviation is a measure of the dispersion or variation of a dataset. It shows how much the values deviate from the mean. A high standard deviation indicates that the values are widely spread, while a low standard deviation indicates that the values are close to the mean.
5. 68% Confidence Interval: A confidence interval indicates the range within which a certain percentage of values of a dataset lies. The 68% confidence interval corresponds to a range of plus/minus one standard deviation around the mean. It indicates that about 68% of the data points lie within this range, providing insight into the distribution of values.
Overview
This Pine Script™, written in Pine version 5, is designed to analyze the Relative Strength Index (RSI) of a stock or other trading instrument and create statistical summaries of the distribution of RSI values. The script identifies outliers in price movement liquidity and uses this information to calculate the frequency of RSI values. At the end, it displays a statistical summary in the form of a table.
Structure and Functionality of the Script
1. Input Parameters
- `rsi_len`: An integer input parameter that defines the length of the RSI (default: 14).
- `outlierThreshold`: An integer input parameter that defines the length of the outlier threshold (default: 10).
2. Calculating Price Movement Liquidity
- `priceMovementLiquidity`: The volume is divided by the absolute difference between the close and open prices to calculate the liquidity of the price movement.
3. Determining the Boundary for Liquidity and Identifying Outliers
- `liquidityBoundary`: The boundary is calculated using the Exponential Moving Average (EMA) of the price movement liquidity and its standard deviation.
- `outlier`: A boolean value that indicates whether the price movement liquidity exceeds the set boundary.
4. Calculating the RSI
- `rsi`: The RSI is calculated with a period length of 14, using various moving averages (e.g., SMA, EMA) depending on the settings.
5. Storing and Limiting RSI Values
- An array `rsiFrequency` stores the frequency of RSI values from 0 to 100.
- The function `f_limit_rsi` limits the RSI values between 0 and 100.
6. Updating RSI Frequency on Outlier Occurrence
- On an outlier occurrence, the limited and rounded RSI value is updated in the `rsiFrequency` array.
7. Statistical Summary
- Various variables (`mostFrequentRsi`, `leastFrequentRsi`, `maxCount`, `minCount`, `sum`, `sumSq`, `count`, `upper_interval`, `lower_interval`) are initialized to perform statistical analysis.
- At the last bar (`bar_index == last_bar_index`), a loop is run to determine the most and least frequent RSI values and their frequencies. Sum and sum of squares of RSI values are also updated for calculating mean and standard deviation.
- The mean (`mean`) and standard deviation (`stddev`) are calculated. Additionally, a 68% confidence interval is determined.
8. Creating a Table for Result Display
- A table `resultsTable` is created and filled with the results of the statistical analysis. The table includes the most and least frequent RSI values, the standard deviation, and the 68% confidence interval.
9. Graphical Representation
- The script draws horizontal lines and fills to indicate overbought and oversold regions of the RSI.
Interpretation of the Results
The script provides a detailed analysis of RSI values based on specific liquidity outliers. By calculating the most and least frequent RSI values, standard deviation, and confidence interval, it offers a comprehensive statistical summary that can help traders identify patterns and anomalies in the RSI. This can be particularly useful for identifying overbought or oversold conditions of a trading instrument and making informed trading decisions.
Critical Evaluation
1. Robustness of Outlier Identification: The method of identifying outliers is solely based on the liquidity of price movement. It would be interesting to examine whether other methods or additional criteria for outlier identification would lead to similar or improved results.
2. Flexibility of RSI Settings: The ability to select various moving averages and period lengths for the RSI enhances the adaptability of the script, allowing users to tailor it to their specific trading strategies.
3. Visualization of Results: While the tabular representation is useful, additional graphical visualizations, such as histograms of RSI distribution, could further facilitate the interpretation of the results.
In conclusion, this script provides a solid foundation for analyzing RSI values by considering liquidity outliers and enables detailed statistical evaluation that can be beneficial for various trading strategies.

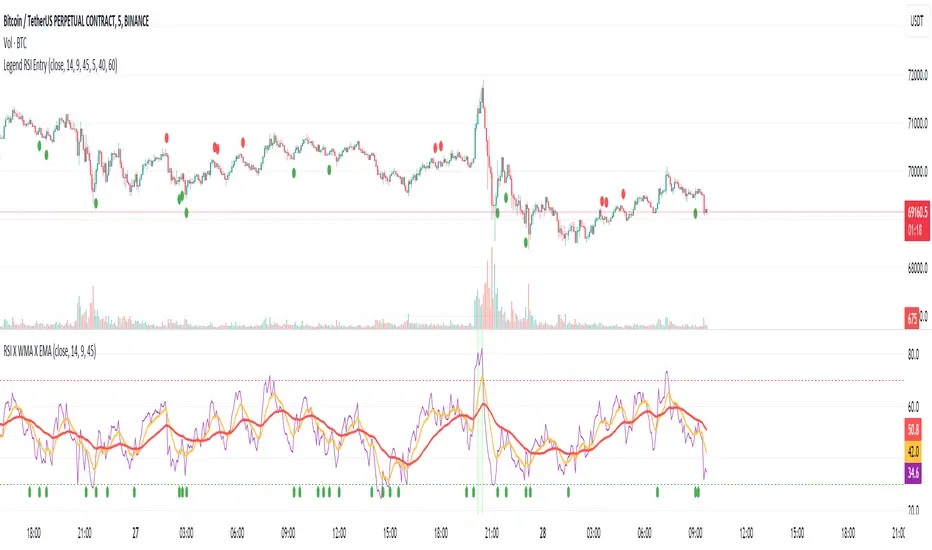
Entry Buy/Sell with Adjustable EMA-WMA Difference by Brian LeThe "Entry Buy/Sell with RSI-WMA Conditions" script, crafted by Brian Le, is a specialized TradingView indicator designed for traders who seek to capitalize on specific RSI (Relative Strength Index) crossover events relative to key moving averages, specifically the EMA (Exponential Moving Average) and WMA (Weighted Moving Average). This tool is particularly useful for identifying potential entry points in a trading strategy, marked by distinctive visual signals on the chart.
Key Features:
Customizable Timeframes and Lengths: Users can adjust the lengths of the RSI, EMA, and WMA, making the indicator versatile across various timeframes and trading styles.
RSI Crossover Signals: The script generates signals based on the RSI crossing over the EMA. A green dot signifies a potential buy signal when the RSI crosses above the EMA, while a red dot indicates a potential sell signal when the RSI crosses below the EMA.
Special Conditions Based on WMA: The indicator enhances decision-making by including the WMA in its analysis. Buy signals (green dots) are only shown when the RSI is below the WMA, and sell signals (red dots) are displayed when the RSI is above the WMA. This additional condition helps in filtering out less probable trades.
EMA and WMA Difference Filter: A unique feature of this script is the ability to set a minimum point difference between the EMA and WMA, adding another layer of specificity to the generated signals.
RSI Threshold Filters: The indicator includes optional filters to show signals only when the RSI is above 40 (for buy signals) or below 60 (for sell signals), aiding in avoiding overbought or oversold conditions.
Enhanced Visuals for Significant Events: For more prominent trading events, such as the RSI crossing both the EMA and WMA within a single candle, the script plots larger symbols (triangles), making these significant events stand out on the chart.
Smooth Slow RSIThis is a smoothed rsi indicator. That means that the input for the rsi calculations is smoothed. This results in faster and smoother responses from the rsi! On top of that I have incorporated an advanced formula for rsi that will amplify weak signals. This means you can use longer times with accuracy. For instance if you are on the 3 minute and you want a 30 minute rsi you can just simply multiply your length by 10 and you will get real results. Normally if you do this you wont get the right output. I hope you find this release useful! Here's a recap on how rsi generally works incase this is your first time:
The relative strength index is a technical indicator used in the analysis of financial markets. It is intended to chart the current and historical strength or weakness of a stock or market based on the closing prices of a recent trading period. The indicator should not be confused with relative strength.

Triple RSI Multi-Timeframe (6 Levels)This indicator is a powerful momentum tracking tool designed to give you a bird's-eye view of market conditions by overlaying Three Relative Strength Index (RSI) lines from different timeframes onto a single pane.
Key Features
Multi-Timeframe Analysis: Monitor short-term, medium-term, and long-term momentum simultaneously. This helps identify "confluence," where different timeframes agree on a trend.
Dynamic Data Table: Instead of generic labels, the on-screen table automatically displays the specific timeframe (e.g., 15m, 1H, 4H) and the current value for each RSI line.
6 Customizable Levels: Beyond the standard 70/30 levels, you can plot up to six independent horizontal lines. This is ideal for identifying "extreme" zones (80/20) or "neutral" zones (60/40).
Visual Clarity: Each RSI line and its corresponding table data are color-coded, making it easy to distinguish between timeframes at a glance.

Custom Sector Comparison Index (CSCI)Compare any stock against a custom basket of its true peers.
Most traders compare stocks to broad indexes like the S&P 500 (SPY) or the Nasdaq (QQQ). But if you are analyzing a niche sector—like Residential REITs, Gold Miners, or AI Semis—broad indexes are too noisy.
This indicator allows you to build your own Custom Equal-Weight Index made up of up to 12 specific symbols. It then plots the performance of the stock you are currently viewing against that custom index, starting from a specific "Anchor Date" of your choosing.
Why use this?
Standard relative strength tools force you to compare against a single symbol (like SPY). But if you want to know if Centerspace (CSR) is lagging its direct competitors, comparing it to SPY (which contains Tech and Healthcare) is useless. Comparing it to VNQ (which contains Cell Towers and Malls) is also imperfect.
With this tool, you can create a "Pure Residential REIT" index and see exactly how your stock is performing against the group.
Key Features:
Fully Configurable: Input up to 12 different symbols to build your custom index.
Smart Filtering: Automatically ignores blank slots. You can build a basket of 3 stocks or 12 stocks without breaking the math.
Custom Anchor Date: Set the specific start date for the comparison (e.g., YTD, Q3 start, or a specific market event).
Visual Performance Gap: Green shading indicates your stock is outperforming the basket; Red shading indicates underperformance.
Example Use Case: Residential REITs
I developed this to analyze the "Residential REIT" sector. I wanted to see if Invitation Homes (INVH) was trading at a discount due to fundamentals or if the whole sector was down.
I configured the basket with 9 of its closest peers:
NYSE:VRE, NYSE:UDR, NYSE:MAA
NYSE:EQR, NYSE:CSR, NYSE:ESS
NYSE:CPT, NYSE:AVB, NYSE:AMH
The Result: The indicator draws a gray line representing the average return of those 9 "Big Boys." I can then load CSR on the chart and immediately see if it is lagging the pack (a potential value buy) or leading it.
How to Use:
Add the indicator to your chart.
Open Settings (Double-click the line).
Start Date: Set the date you want the "race" to begin (where all returns reset to 0%).
Symbols: Type in the tickers for your custom basket (e.g., NVDA, AMD, INTC). Leave unused slots blank.
Analyze:
Gray Line: The average performance of your basket.
Blue Line: The performance of the current symbol on your chart.
Pro Tip: You can save different "Presets" in the indicator settings for different sectors (e.g., save one preset as "Semis" and another as "Oil Majors") so you don't have to re-type symbols every time.

HaP D-RSIHaP D-RSI (HaP Dual RSI) This code shares the dual RSI structure and divergences of hakan çift rsi-most indicator as open source. It is designed for simple, understandable, and effective use.
()
HaP D-RSI is a comprehensive oscillator that powerfully enhances the classic Relative Strength Index (RSI) indicator. By adding a 9-period EMA on top of the standard RSI(14), it smooths the momentum for clearer readability, while dynamic area filling between the short RSI(10) and long RSI(14) visually emphasizes trend strength. Its strongest feature is the automatic detection of regular (normal) and hidden positive/negative divergences, marked with clear labels. This provides opportunities to catch both trend reversals and continuations early.The indicator operates in a separate panel and includes overbought/oversold levels (70/30/50). With multi-timeframe support, you can display RSI values from a higher timeframe on your current chart.Main FeaturesDual RSI Calculation: Short-period RSI(10) and long-period RSI(14) are calculated separately.
EMA Smoothing: A 9-period EMA is applied to RSI(14) to reduce noise and clarify signals.
Dynamic Area Filling: Dynamic colored filling between RSI(10) and RSI(14)-EMA (blue tones for bullish, red tones for bearish momentum).
Fixed-intensity area between RSI(10) and RSI(14) (emphasizes trend strength).
Overbought/Oversold Lines: Dashed lines at 70 (overbought), 30 (oversold), and 50 (midline).
Full Divergence Detection:Positive Divergence (pu): Price makes a lower low while RSI makes a higher low → Potential bullish reversal.
Hidden Positive Divergence (gpu): Trend continuation signal (buying opportunity after pullback).
Negative Divergence (nu): Price makes a higher high while RSI makes a lower high → Potential bearish reversal.
Hidden Negative Divergence (gnu): Bearish trend continuation signal.
Customizable Pivot Settings: Adjust divergence sensitivity with lookback left/right and distance range.
Multi-Timeframe Support: Ability to pull RSI data from a different timeframe.
Usage InstructionsAdd to Chart: When added, it opens a separate RSI panel.
Settings: Change the short RSI (default 10) and long RSI (default 14) periods as needed.
Adjust the EMA period (default 9) to suit your needs.
If the timeframe is left blank, it uses the current chart timeframe; otherwise, select a higher timeframe.
You can toggle divergence types (positive/negative, hidden/regular) on/off.
Increase pivot lookback values for stronger (fewer signals) divergences.
Signal InterpretationBuy Opportunity: When "pu" or "gpu" labels appear (especially around the 30 level).
Sell Opportunity: When "nu" or "gnu" labels appear (especially around the 70 level).
Area filling colors support momentum direction: Blue tones indicate bullish pressure, red tones indicate bearish pressure.
For best results, use in combination with support/resistance levels, volume, or trend filters (e.g., EMA).
Why Use This Indicator?Powerful Divergence Detection: Automatically and accurately captures both regular (reversal) and hidden (continuation) divergences – a feature missing in many standard RSI indicators.
Visual Clarity: Dynamic colored areas and labels ensure you don't miss signals.
Flexibility: Suitable for all markets (stocks, forex, crypto) and timeframes.
Early Warning System: Divergences often signal before price reversals, providing high-probability entries.
Add this indicator to your strategies to elevate your momentum-based trading.
This indicator is free. Feel free to leave comments with your feedback and improvement suggestions. If you like it, don't forget to add it to favorites and share! Happy trading!

RSI Divergence bsTzdThis indicator automatically detects bullish and bearish RSI divergences by comparing swing highs and lows in price against momentum shifts on the Relative Strength Index. It identifies both regular divergences, which signal potential trend reversals, and hidden divergences, which often confirm trend continuation.
All divergences are plotted directly on the chart using clean, non-repainting swing-point logic so signals only appear after pivots are confirmed.
The goal of the tool is to help traders quickly spot early momentum shifts that are otherwise difficult to see in real-time—especially during fast intraday moves. By combining price structure with RSI behavior, the indicator offers high-quality signals designed to improve entry timing, stop placement, and overall trend analysis.
Key Features
Automatic bullish & bearish regular divergences
Automatic bullish & bearish hidden divergences
Uses confirmed swing pivots to avoid repainting
Works on all assets and all timeframes
Clean visual markers for fast decision-making
Helps identify momentum exhaustion, trend continuation, and potential reversals
Useful for scalping, day trading, and swing trading setups

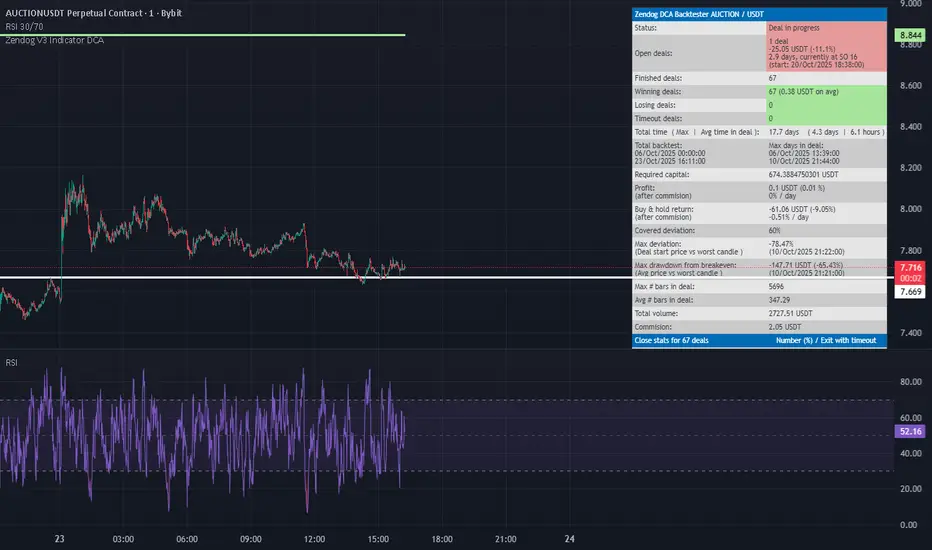
RSI FlipIndicator Description: RSI Flip (30/70 Threshold)
This indicator uses a 7-period Relative Strength Index (RSI) to detect potential market reversals based on classic momentum thresholds:
- RSI < 30 → triggers a Long Deal Signal (1) indicating potential bullish reversal.
- RSI > 70 → triggers a Short Deal Signal (2) indicating potential bearish reversal.
🔧 Features:
- Backtest-compatible output: Hidden plots emit 1 for long and 2 for short, enabling seamless integration with strategy scripts.
- Bias tracking: Internal bias state updates on each trigger, allowing for modular lifecycle logic.
- Background tinting ready: The bias variable can be used to drive visual overlays or downstream automation.
🧩 Integration Notes:
- Designed for symbol-specific use — no external feeds or dependencies.
- Ideal for modular signal stacking, lifecycle-safe deal initiation, or audit-grade strategy mapping.
RSI Bars - OnlyFlowThis indicator applies the RSI (Relative Strength Index) to candle coloring so that bar colors reflect momentum conditions instead of a fixed scheme.
RSI Logic: Bars shift color when RSI values move into overbought or oversold regions, with intensity scaled by how far RSI extends beyond the thresholds.
Gradient / Step Mode: Choose between a smooth gradient or a 3-step palette to visualize strength.
Directional Neutral Colors: Neutral zones can follow candle direction for clearer trend context.
Customization: Overbought/oversold levels and color palettes are user-configurable.
Optional RSI Panel: An RSI plot with overbought/oversold lines can be enabled in a separate pane if desired.
This tool is meant to give traders a more intuitive view of RSI conditions directly on price bars, helping to quickly see momentum extremes without needing to glance away from the chart.

RSI Divergence ProjectionRSI Divergence Projection
Go beyond traditional, lagging indicators with this advanced RSI Divergence tool. It not only identifies four types of confirmed RSI divergence but also introduces a unique, forward-looking engine. This engine spots potential divergences as they form on the current candle and then projects the exact price threshold required to validate them.
Our core innovation is the Divergence Projection Line, a clean, clutter-free visualization that extends this calculated price target into the future, providing a clear and actionable level for your trading decisions.
The Core Logic: Understanding RSI Divergence
For those new to the concept, RSI Divergence is a powerful tool used to spot potential market reversals or continuations. It occurs when the price of an asset is moving in the opposite direction of the Relative Strength Index (RSI). This indicator automatically detects and plots four key types:
Regular Bullish Divergence: Price prints a lower low, but the RSI prints a higher low. This often signals that bearish momentum is fading and a potential reversal to the upside is near.
Hidden Bullish Divergence: Price prints a higher low, but the RSI prints a lower low. This is often seen in an uptrend and can signal a continuation of the bullish move.
Regular Bearish Divergence: Price prints a higher high, but the RSI prints a lower high. This suggests that bullish momentum is weakening and a potential reversal to the downside is coming.
Hidden Bearish Divergence: Price prints a lower high, but the RSI prints a higher high. This is often seen in a downtrend and can signal a continuation of the bearish move.
Confirmed divergences are plotted with solid-colored lines on the price chart and marked with a "B" (Bearish/Bullish) or "HB" (Hidden Bearish/Hidden Bullish) label.
The Core Innovation: The Divergence Projection
This is where the indicator truly shines and sets itself apart. Instead of waiting for a pivot point to be confirmed, our engine analyzes the current, unclosed candle.
Potential Divergence Detection: When the indicator notices that the current price and RSI are setting up for a potential divergence against the last confirmed pivot, it will draw a dashed line on the chart. This gives you a critical head-start before the signal is confirmed.
The Projection Line (Our Innovation): This is the game-changer. Rather than cluttering your chart with messy labels, the indicator calculates the exact closing price the next candle needs to achieve to make the current RSI level equal to the RSI of the last pivot.
It then projects a clean, horizontal dashed line at this price level into the future.
Attached to the end of this line is a single, consolidated label that tells you the type of potential divergence and the exact threshold price.
This unique visualization transforms a vague concept into a precise, actionable price target, completely free of chart clutter.
How to Use This Indicator
1. Trading Confirmed Divergences:
Look for the solid lines and the "B" or "HB" labels that appear after a candle has closed and a pivot is confirmed.
A Regular Bullish divergence can be an entry signal for a long position, often placed after the confirmation candle closes.
A Regular Bearish divergence can be an entry signal for a short position.
Hidden Divergences can be used as confirmation to stay in a trade or to enter a trade in the direction of the prevailing trend.
2. Using the Divergence Projection for a Tactical Advantage:
When a dashed line appears on the current price action, you are seeing a potential divergence in real-time.
Look to the right of the current candle for the Projection Line. The price level of this line is your key level to watch.
Example (Potential Bullish Divergence): You see a dashed green line forming from a previous low to the current lower low. To the right, you see a horizontal line projected with a label: "Potential Bull Div | Thresh: 10,750.50".
Interpretation: This means that if the next candle closes below 10,750.50, the RSI will not be high enough to form a divergence. However, if the price pushes up and the next candle closes above 10,750.50, the bullish divergence remains intact and is more likely to be confirmed. This gives you a concrete price level to monitor for entry or exit decisions.
How the Projection Engine Works: A Deeper Dive
To fully trust this tool, it's helpful to understand the logic behind it. The projection engine is not based on guesswork or repainting; it's based on a precise mathematical reverse-engineering of the RSI formula.
The Concept: The engine calculates the "tipping point." The Threshold Price is the exact closing price at which the new RSI value would be identical to the RSI value of the previous pivot point. It answers the question: "For this potential divergence to remain valid, where does the next candle need to close?"
The Technicals: The script takes the target RSI from the last pivot, reverse-engineers the formula to find the required average gain/loss ratio, and then solves for the one unknown variable: the gain or loss needed on the next candle. This required price change is then added to or subtracted from the previous close to determine the exact threshold price.
This calculation provides the precise closing price needed to hit our target, which is then plotted as the clean and simple Projection Line on your chart.
Features and Customization
- RSI Settings: Adjust the RSI period and source.
- Divergence Detection: Fine-tune the pivot lookback periods and the min/max range for detecting divergences.
- Price Source: Choose whether to detect divergences using candle Wicks or Bodies.
- Display Toggles: Enable or disable any of the four divergence types, as well as the entire projection engine, to keep your chart as clean as you need it.
Summary of Advantages
- Proactive Signals: Get ahead of the market by seeing potential divergences before they are confirmed.
- Unprecedented Clarity: Our unique Projection Line eliminates chart clutter from overlapping labels.
- Actionable Data: The threshold price provides a specific, objective level to watch, removing guesswork.
- Fully Customizable: Tailor the indicator's settings to match any timeframe or trading strategy.
- All-in-One Tool: No need for a separate RSI indicator; everything you need is displayed directly and cleanly on the price action.
We hope this tool empowers you to make more informed and timely trading decisions. Happy trading

True High/Low RSI for DivergenceThis Pine Script creates a highly specialized RSI (Relative Strength Index) indicator designed to provide a more accurate signal for divergence trading. Its official title is "True High/Low RSI for Divergence."
Here is a breakdown of its core features:
1. Dual RSI Calculation based on Highs and Lows:
Unlike a standard RSI that typically uses the closing price of a candle, this indicator calculates two separate RSI lines:
A "High RSI" : This line calculates the RSI based on the high price of each candle. It is intended to track momentum peaks more accurately.
A "Low RSI" : This line calculates the RSI based on the low price of each candle. It is designed to track momentum troughs more accurately.
The main purpose of this separation is to avoid the potential errors that can occur when using an average price (like the close or hl2) during periods of high volatility. By using the true extremes of the price candles, the indicator aims to show a more "true" representation of momentum for identifying divergences between price and the indicator.
2. Dynamic Transparency:
This is a key visual feature. The RSI lines are not always fully visible. They dynamically fade into view as they enter significant overbought or oversold zones:
The Low RSI line (red by default) is invisible when above a value of 50. As it drops from 49 towards 30, it becomes progressively more opaque (more visible). It reaches full opacity at an RSI value of 30, visually alerting the user to strengthening oversold conditions.
The High RSI line (blue by default) is invisible when below a value of 50. As it rises from 51 towards 70, it also becomes progressively more opaque. It is fully opaque at an RSI value of 70, highlighting strengthening overbought conditions.
3. User Customization:
The script allows for user flexibility. You can change:
The colors for both the High and Low RSI lines.
The RSI calculation length (default is 14).
The price source for each RSI line (though they are specifically designed to use high and low).
In summary, this indicator is a purpose-built tool for traders who rely on divergence. It provides a more precise and visually intuitive way to track momentum at its true peaks and troughs, helping to make more informed trading decisions.
RSI mura visionOverview
The Enhanced RSI with Custom 40/60 Zones is a Pine Script™ v6 open-source indicator that builds on the classic Relative Strength Index by adding two additional horizontal levels at 40 and 60, alongside the standard 30/70. These extra zones help you identify early momentum shifts and distinguish trending markets from ranging ones with greater precision.
Key Features & Originality
* Custom Mid-Zones (40/60): Standard RSI signals can be noisy around the 50 midpoint. By marking 40 as a “weak momentum” threshold and 60 as a “strong momentum” confirmation, you get clearer entry and exit cues.
* Color-Coded Zones: The RSI line changes color when crossing 40, 50, 60, 70, and 30, letting you visually spot momentum acceleration or deceleration.
* Configurable Alerts: Built-in alert conditions fire when RSI crosses 40 or 60 in either direction, so you never miss a potential trend onset or exhaustion.
* Lightweight & Clean: No external dependencies, no look-ahead bias, and minimal repainting—ideal for both novice and professional traders.
How It Works
1. Momentum Decomposition: The standard 14-period RSI measures overbought/oversold extremes. Adding 40/60 lets you see when momentum shifts from neutral to bullish (crossing above 60) or bearish (dropping below 40) earlier than the classic 70/30 thresholds.
2. Trend Confirmation vs. Pullbacks: Readings between 40–60 often correspond to healthy pullbacks within a trend. A bounce off 40 suggests continuation; a rejection at 60 warns of a deeper pullback or reversal.
Usage & Inputs
* RSI Length (default 14): Period for calculating RSI.
* Level Inputs: Customize levels for overbought (70), support (60), neutral (50), weak (40), and oversold (30).
* Alert Toggles: Enable/disable alerts on each cross.
Why This Adds Value
* Early Signals: Capture trend beginnings before the market reaches extreme overbought/oversold levels.
* Noise Reduction: Filter sideways chop by watching the 40–60 corridor.
* Flexibility: Works on any timeframe or ticker.
Pine Script™ Version: v6
Open-Source License: MPL-2.0
Feel free to fork, modify, and share.

Trading-Focused RSI with Quality SignalsOverview
Transforms the classic Relative Strength Index into a comprehensive trading system that delivers clear, high-quality signals. Unlike basic RSI indicators that leave interpretation to the trader, TraderRSI filters out noise and highlights only the most promising trading opportunities.
Key Features
Signal Quality Over Quantity
Smart Divergence Detection that identifies only significant, tradable divergences (not every minor oscillation)
Automated Signal Confirmation requiring persistence for multiple bars to eliminate false signals
Clear BUY/SELL Labels appear only on high-probability setups where multiple conditions align
Enhanced Visualization
Color-Coded RSI Line instantly communicates bullish/bearish momentum
Signal Line Crossovers to confirm trend changes early
Trend-Based Background Coloring providing immediate market context
Uncluttered Chart designed specifically for day traders and swing traders
Integrated Market Context
Optional Trend Filter using a 50-period moving average for directional bias
Overbought/Oversold Zones with subtle background highlighting
Divergence Strength Filtering ensures only meaningful divergences are displayed
Trading Applications
For Day Traders
Find precise entry and exit points with clear visual signals. Divergence signals combined with RSI crossovers provide powerful intraday setups.
For Swing Traders
The quality-focused signal system identifies only high-probability trend reversals, perfect for multi-day positions. Background coloring provides immediate trend context.
For Investors
Easily identify overbought or oversold conditions in your watchlist. The trend filter helps distinguish between temporary pullbacks and major reversals.
How to Use
Strong Buy Signal: When a green "BUY" label appears, RSI has crossed above the oversold level with bullish divergence confirmation and (optional) trend alignment
Strong Sell Signal: When a red "SELL" label appears, RSI has crossed below the overbought level with bearish divergence confirmation and (optional) trend alignment
Alert System: Set alerts on any of the eight customizable conditions to never miss a quality trade setup

Smooth Gradient RSIThe RSI READY NO1 is a custom-designed Relative Strength Index (RSI) indicator that visually enhances the classic RSI functionality with modern aesthetics and user-friendly features. Its purpose is to provide smooth and clear insights into price momentum and potential reversal zones.
**Key Features**:
- **Smooth Gradient Line**: The RSI line dynamically changes color from green (low RSI values) to red (high RSI values) through a gradient transition. This visually intuitive representation highlights changes in momentum and overbought/oversold conditions.
- **Customizable Background**: Users can select their preferred background color to enhance visual clarity and suit their personal preferences or chart themes.
- **Precise Levels Marking**: The Overbought Level (default: 70) and Oversold Level (default: 30) are marked with white dashed lines of thickness 2, ensuring clear visibility of critical zones.
**Visual Enhancements**:
- The gradient feature makes the RSI more visually appealing, helping traders quickly identify shifts in market momentum.
- Clean design ensures focus remains on the RSI line, with minimal distractions.
**Usability**:
- Designed for easy integration into charts with parameters customizable directly from the interface.
- Compatible with TradingView platform, leveraging Pine Script Version 5.
This indicator is ideal for traders who prioritize visual clarity and customization, providing enhanced insights into market trends and dynamics.

RSI Alerts – Live & ConfirmedThe RSI Alerts – Live & Confirmed indicator enhances the traditional Relative Strength Index (RSI) by providing real-time alerts and confirmed breakout signals when RSI reaches key levels. It also features a dynamic RSI line color change for better visualization.
Key Features:
✅ Live & Confirmed Alerts:
Live Alert Mode: Triggers when RSI touches overbought (70) or oversold (30).
Confirmed Alert Mode: Triggers only when RSI closes above/below these levels, reducing false signals.
✅ Dynamic RSI Line Coloring:
Above 70: RSI turns green, indicating an overbought condition.
Below 30: RSI turns red, indicating an oversold condition.
Between 30 and 70: RSI remains blue, its normal color, ensuring no color leaks into invalid zones.
✅ Customizable RSI Settings:
Adjustable RSI length, overbought/oversold levels, and alert preferences.
Mid-Level (50) line for trend bias reference.
This indicator is perfect for traders who rely on RSI signals and want clear visual cues and real-time alerts for improved decision-making.

MTF RSI CandlesThis Pine Script indicator is designed to provide a visual representation of Relative Strength Index (RSI) values across multiple timeframes. It enhances traditional candlestick charts by color-coding candles based on RSI levels, offering a clearer picture of overbought, oversold, and sideways market conditions. Additionally, it displays a hoverable table with RSI values for multiple predefined timeframes.
Key Features
1. Candle Coloring Based on RSI Levels:
Candles are color-coded based on predefined RSI ranges for easy interpretation of market conditions.
RSI Levels:
75-100: Strongest Overbought (Green)
65-75: Stronger Overbought (Dark Green)
55-65: Overbought (Teal)
45-55: Sideways (Gray)
35-45: Oversold (Light Red)
25-35: Stronger Oversold (Dark Red)
0-25: Strongest Oversold (Bright Red)
2. Multi-Timeframe RSI Table:
Displays RSI values for the following timeframes:
1 Min, 2 Min, 3 Min, 4 Min, 5 Min
10 Min, 15 Min, 30 Min, 1 Hour, 1 Day, 1 Week
Helps traders identify RSI trends across different time horizons.
3. Hoverable RSI Values:
Displays the RSI value of any candle when hovering over it, providing additional insights for analysis.
Inputs
1. RSI Length:
Default: 14
Determines the calculation period for the RSI indicator.
2. RSI Levels:
Configurable thresholds for RSI zones:
75-100: Strongest Overbought
65-75: Stronger Overbought
55-65: Overbought
45-55: Sideways
35-45: Oversold
25-35: Stronger Oversold
0-25: Strongest Oversold
How It Works:
1. RSI Calculation:
The RSI is calculated for the current timeframe using the input RSI Length.
It is also computed for 11 additional predefined timeframes using request.security.
2. Candle Coloring:
Candles are colored based on their RSI values and the specified RSI levels.
3. Hoverable RSI Values:
Each candle displays its RSI value when hovered over, via a dynamically created label.
Multi-Timeframe Table:
A table at the bottom-left of the chart displays RSI values for all predefined timeframes, making it easy to compare trends.
Usage:
1. Trend Identification:
Use candle colors to quickly assess market conditions (overbought, oversold, or sideways).
2. Timeframe Analysis:
Compare RSI values across different timeframes to determine long-term and short-term momentum.
3. Signal Confirmation:
Combine RSI signals with other indicators or patterns for higher-confidence trades.
Best Practices
Use this indicator in conjunction with volume analysis, support/resistance levels, or trendline strategies for better results.
Customize RSI levels and timeframes based on your trading strategy or market conditions.
Limitations
RSI is a lagging indicator and may not always predict immediate market reversals.
Multi-timeframe analysis can lead to conflicting signals; consider your trading horizon.

RSI Overlay Table with Pivot-Based Divergence and SortingThis script offers an advanced RSI-based overlay table designed to identify and highlight divergences across multiple timeframes (Daily, Weekly, Monthly) for up to 13 tickers. It employs a pivot-based detection mechanism that spots positive and negative divergences, helping traders identify potential trend reversals or continuations.
Key Features
1. Pivot-Based Divergence Detection:
The script uses pivot points to identify both positive and negative divergences using the RSI indicator and price movements.
User-adjustable pivot settings enhance detection sensitivity, providing traders with an opportunity to fine-tune divergence signals for different market conditions.
2. Multi-Timeframe Analysis:
Displays RSI values along with divergence signals for daily, weekly, and monthly timeframes.
Enables traders to monitor short-term, swing, and long-term trends on a single table, providing a comprehensive view.
3. Customizable Alerts and Visual Cues:
The script generates alerts whenever a divergence is detected, ensuring timely notifications.
Overbought and oversold levels are color-coded based on user-defined thresholds, with the "P-" and "N-" prefixes indicating positive and negative divergences, respectively.
4. User-Friendly Interface:
An intuitive table design allows for easy comparison of RSI levels and divergence signals across multiple tickers.
Offers customizable table positioning options (bottom left, center, right, or middle right) for convenient chart integration.
How to Use
Input Your Tickers: Add up to 13 tickers that you wish to monitor.
Adjust Pivot Settings: Fine-tune the 'Pivot Left Bars' and 'Pivot Right Bars' to optimize the pivot detection process.
Set Overbought/Oversold Levels: Define the RSI thresholds according to your trading strategy.
Enable Alerts: Receive notifications for divergence signals detected on any timeframe.
Concepts Underlying the Calculations
The script leverages the RSI (Relative Strength Index), a popular momentum indicator, to measure the velocity and magnitude of price changes. By comparing RSI values with pivot points, the script identifies divergences that suggest potential reversals. This method ensures more reliable signals than simple bar comparisons, as it accounts for broader market movements over time.
Why This Script Is Unique
This RSI overlay script stands out due to its multi-ticker, multi-timeframe divergence analysis and the use of pivot-based detection for higher accuracy. The integration of an alert system, combined with color-coded visual cues, makes it an actionable and comprehensive tool for traders.
Turkish Translation
RSI Overlay Tablosu - Pivot Tabanlı Uyumsuzluk ve Sıralama ile
Bu script, birden fazla zaman diliminde (Günlük, Haftalık, Aylık) 13 adede kadar seçilen hisse senetleri veya varlıklar için RSI tabanlı ayrışmaları belirleyen ve vurgulayan gelişmiş bir overlay tablosu sunar. Pivot tabanlı tespit mekanizması, trend dönüşlerini veya devamlarını belirlemeye yardımcı olacak şekilde pozitif ve negatif ayrışmaları tespit eder.
Özellikler
1. Pivot Tabanlı Uyumsuzluk Tespiti:
Pivot noktalarını kullanarak RSI göstergesi ve fiyat hareketleri arasındaki pozitif ve negatif uyumsuzlukları tespit eder.
Kullanıcı ayarlı pivot ayarları, uyumsuzluk sinyallerinin hassasiyetini artırır ve farklı piyasa koşullarına uygun hale getirir.
2. Çoklu Zaman Dilimi Analizi:
Günlük, haftalık ve aylık zaman dilimlerinde RSI değerlerini ve ayrışma sinyallerini gösterir.
Kısa vadeli, orta vadeli ve uzun vadeli trendleri tek bir tabloda izlemenize olanak tanır.
3. Kullanıcı Dostu Arayüz ve Uyarılar:
Pozitif ve negatif ayrışmaları tespit ettiğinde uyarılar oluşturur.
Kullanıcı tanımlı eşiklere göre aşırı alım ve aşırı satım seviyelerini renk kodlarıyla gösterir.
Nasıl Kullanılır
İzlemek istediğiniz varlıkları ekleyin (en fazla 13 adet).
Pivot ayarlarını yapılandırarak tespit işlemini optimize edin.
RSI eşik seviyelerini belirleyin ve uyarıları etkinleştirin.

RSI Multi-Timeframe PINESCRIPTLABS📈 Use the Relative Strength Index (RSI) calculated across multiple time frames to generate signals
🔹 Intraday: Displays a table with real-time RSI values for the time frames of 5 minutes, 15 minutes, 30 minutes, 1 hour, 4 hours, and 1 day.
🔹 Standard: Displays a table with real-time RSI values for the time frames of 30 minutes, 1 hour, 4 hours, 1 day, 1 week, and 1 month.
The indicator allows you to customize overbought and oversold thresholds, as well as choose between viewing RSI values for intraday or standard time frames, tailoring the analysis to your specific needs. 🔧📊
🔔 Signals are generated when in 4 of the 6 time frames we define below:
Overbought Signal (When RSI indicates overbought conditions):
• Intraday: Activated when the RSI in the time frames of 5 minutes, 15 minutes, 30 minutes, and 1 hour is above the 70 threshold. 📈
• Standard: Activated when the RSI in the time frames of 30 minutes, 1 hour, 4 hours, and 1 day is above the 70 threshold. 📈
Oversold Signal (When RSI indicates oversold conditions):
• Intraday: Activated when the RSI in the time frames of 5 minutes, 15 minutes, 30 minutes, and 1 hour is below the 30 threshold. 📉
• Standard: Activated when the RSI in the time frames of 30 minutes, 1 hour, 4 hours, and 1 day is below the 30 threshold. 📉
Español:
📈 Utiliza el Índice de Fuerza Relativa (RSI) calculado en varios marcos de tiempo para generar señales
🔹 Intraday: Muestra una tabla con los valores del RSI en tiempo real para los marcos de tiempo de 5 minutos, 15 minutos, 30 minutos, 1 hora, 4 horas y 1 día.
🔹 Standard: Muestra una tabla con los valores del RSI en tiempo real para los marcos de tiempo de 30 minutos, 1 hora, 4 horas, 1 día, 1 semana y 1 mes.
El indicador te permite personalizar los umbrales de sobrecompra y sobreventa, así como elegir entre ver los valores RSI para marcos de tiempo intradía o estándar, adaptando el análisis a tus necesidades específicas. 🔧📊
🔔 Las señales se generan cuando en 4 de los 6 marcos de tiempo que definimos a continuación:
Señal de Sobrecompra (Cuando el RSI indica sobrecompra):
• Intraday: Se activa cuando el RSI en los marcos de tiempo de 5 minutos, 15 minutos, 30 minutos y 1 hora está por encima del umbral de 70. 📈
• Standard: Se activa cuando el RSI en los marcos de tiempo de 30 minutos, 1 hora, 4 horas y 1 día están por encima del umbral de 70. 📈
Señal de Sobreventa (Cuando el RSI indica sobreventa):
• Intraday: Se activa cuando el RSI en los marcos de tiempo de 5 minutos, 15 minutos, 30 minutos y 1 hora está por debajo del umbral de 30. 📉
• Standard: Se activa cuando el RSI en los marcos de tiempo de 30 minutos, 1 hora, 4 horas y 1 día están por debajo del umbral de 30. 📉

RSI Buy/Sell SignalsThis Pine Script is designed to plot Buy and Sell signals based on the Relative Strength Index (RSI) for both 15-minute and hourly timeframes. It calculates the RSI values for the current 15-minute chart and requests the hourly RSI data for comparison. Buy signals are generated when the RSI crosses above 60 in either timeframe, while sell signals occur when the RSI crosses below 40. The script also plots visual markers on the chart, indicating buy signals with green labels below the price bars and sell signals with red labels above the price bars. Additionally, it allows for alert conditions, notifying the user when a buy or sell signal is triggered.
