RSI Support & Resistance by DGTRSI Sᴜᴘᴘᴏʀᴛ & Rᴇꜱɪꜱᴛᴀɴᴄᴇ ʙʏ DGT
This experimental study attempts to translate Relative Strength Index (RSI) threshold levels of oversold/overbought and bull/bear zones as probable Price Support and Resistance levels
█ OPTIONS
Support & Resistance Levels , the main aim of the study. Level calculations are based on Relative Strength Index (RSI) threshold levels of oversold/overbought and bull/bear zones, where all threshold values are customizable through the user dialog box. Background of the levels can be colored optionally
RSI Weighted Colored Bars and/or Mark Overbought/Oversold Bars , Bar colors can be painted to better emphasis RSI values. Darker colors when the oscillator is in oversold/overbought zones, light colors when oscillator readings are below/above the bull/bear zone respectively, and remain unchanged otherwise. Besides the colors, with “Display RSI Overbought/Oversold Price Bars” option little triangle shapes can be plotted on top or bottom of the bars when RSI is in oversold/overbought zones
Example usage of the study with explanations
█ OTHERS
More regarding Support & Resistance concept (definition, identifying levels, trading S&R, etc) you are kindly invited to check my previous publication
Price Action - Support & Resistance by DGT
More regarding Relative Strength Index (RSI) and Relative Strength of Volume Indicators , please check Relative Strength of Volume Indicators by DGT
Disclaimer:
Trading success is all about following your trading strategy and the indicators should fit within your trading strategy, and not to be traded upon solely
The script is for informational and educational purposes only. Use of the script does not constitute professional and/or financial advice. You alone have the sole responsibility of evaluating the script output and risks associated with the use of the script. In exchange for using the script, you agree not to hold dgtrd TradingView user liable for any possible claim for damages arising from any decision you make based on use of the script
在腳本中搜尋"Relative"

RVOL + Volume Z-Score (Textbook)This indicator is a relative-volume and “volume anomaly” dashboard designed to help you quickly spot when a ticker is actually in-play versus simply drifting on normal activity. It plots standard volume bars (colored by up/down candles) and overlays multiple optional smoothers of volume (SMA, LSMA/linear-regression MA, HMA, ALMA) so you can see whether participation is expanding or fading across different smoothing styles. It also calculates RVOL (current bar volume divided by the average volume over a user-defined lookback) and displays RVOL (and Z) in a small table for quick reference.
The core feature is a textbook volume z-score: Z=(V−SMA(V,N))/StDev(V,N)
This measures how far the current bar’s volume is from its recent average in standard-deviation units, making it easy to filter for genuinely unusual volume. The script plots mean + 1σ and mean + 2σ threshold bands and can highlight “anomaly” volume bars when Z exceeds your chosen σ thresholds (default 1σ for broader detection, with alerts available for 1σ/2σ). Use it as a participation filter: combine high RVOL / high Z with your price structure (key levels, VWAP, trend) to validate breakouts or identify high-conviction reversal/flush events.

RSI HTF Hardcoded (A/B Presets) + Regimes [CHE]RSI HTF Hardcoded (A/B Presets) + Regimes — Higher-timeframe RSI emulation with acceptance-based regime filter and on-chart diagnostics
Summary
This indicator emulates a higher-timeframe RSI on the current chart by resolving hardcoded “HTF-like” lengths from a time-bucket mapping, avoiding cross-timeframe requests. It computes RSI on a resolved length, smooths it with a resolved moving average, and derives a histogram-style difference (RSI minus its smoother). A four-state regime classifier is gated by a dead-band and an acceptance filter requiring consecutive bars before a regime is considered valid. An on-chart table reports the active preset, resolved mapping tag, resolved lengths, and the current filtered regime.
Pine version: v6
Overlay: false
Primary outputs: RSI line, SMA(RSI) line, RSI–SMA histogram columns, reference levels (30/50/70), regime-change alert, info table
Motivation
Cross-timeframe RSI implementations often rely on `request.security`, which can introduce repaint pathways and additional update latency. This design uses deterministic, on-series computation: it infers a coarse target bucket (or uses a forced bucket) and resolves lengths accordingly. The dead-band reduces noise at the decision boundaries (around RSI 50 and around the RSI–SMA difference), while the acceptance filter suppresses rapid flip-flops by requiring sustained agreement across bars.
Differences
Baseline: Standard RSI with a user-selected length on the same timeframe, or HTF RSI via cross-timeframe requests.
Key differences:
Hardcoded preset families and a bucket-based mapping to resolve “HTF-like” lengths on the current chart.
No `request.security`; all calculations run on the chart’s own series.
Regime classification uses two independent signals (RSI relative to 50 and RSI–SMA difference), gated by a configurable dead-band and an acceptance counter.
Always-on diagnostics via a persistent table (optional), showing preset, mapping tag, resolved lengths, and filtered regime.
Practical effect: The oscillator behaves like a slower, higher-timeframe variant with more stable regime transitions, at the cost of delayed recognition around sharp turns (by design).
How it works
1. Bucket selection: The script derives a coarse “target bucket” from the chart timeframe (Auto) or uses a user-forced bucket.
2. Length resolution: A chosen preset defines base lengths (RSI length and smoothing length). A bucket/timeframe mapping resolves a multiplier, producing final lengths used for RSI and smoothing.
3. Oscillator construction: RSI is computed on the resolved RSI length. A moving average of RSI is computed on the resolved smoothing length. The difference (RSI minus its smoother) is used as the histogram series.
4. Regime classification: Four regimes are defined from:
RSI relative to 50 (bullish above, bearish below), with a dead-band around 50
Difference relative to 0 (positive/negative), with a dead-band around 0
These two axes produce strong/weak bull and bear states, plus a neutral state when inside the dead-band(s).
5. Acceptance filter: The raw regime must persist for `n` consecutive bars before it becomes the filtered regime. The alert triggers when the filtered regime changes.
6. Diagnostics and visualization: Histogram columns change shade based on sign and whether the difference is rising/falling. The table displays preset, mapping tag, resolved lengths, and the filtered regime description.
Parameter Guide
Source — Input series for RSI — Default: Close — Smoother sources reduce noise but add lag.
Preset — Base lengths family — Default: A(14/14) — Switch presets to change RSI and smoothing responsiveness.
Target Bucket — Auto or forced bucket — Default: Auto — Force a bucket to lock behavior across chart timeframe changes.
Table X / Table Y — Table anchor — Default: right / top — Move to avoid covering content.
Table Size — Table text size — Default: normal — Increase for presentations, decrease for dense layouts.
Dark Mode — Table theme — Default: enabled — Match chart background for readability.
Show Table — Toggle diagnostics table — Default: enabled — Disable for a cleaner pane.
Epsilon (dead-band) — Noise gate for decisions — Default: 1.0 — Raise to reduce flips near boundaries; lower to react faster.
Acceptance bars (n) — Bars required to confirm a regime — Default: 3 — Higher reduces whipsaw; lower increases reactivity.
Reading
Histogram (RSI–SMA):
Above zero indicates RSI is above its smoother (positive momentum bias).
Below zero indicates RSI is below its smoother (negative momentum bias).
Darker/lighter shading indicates whether the difference is increasing or decreasing versus the previous bar.
RSI vs SMA(RSI):
RSI’s position relative to 50 provides broad directional bias.
RSI’s position relative to its smoother provides momentum confirmation/contra-signal.
Regimes:
Strong bull: RSI meaningfully above 50 and difference meaningfully above 0.
Weak bull: RSI above 50 but difference below 0 (pullback/transition).
Strong bear: RSI meaningfully below 50 and difference meaningfully below 0.
Weak bear: RSI below 50 but difference above 0 (pullback/transition).
Neutral: inside the dead-band(s).
Table:
Use it to validate the active preset, the mapping tag, the resolved lengths, and the filtered regime output.
Workflows
Trend confirmation:
Favor long bias when strong bull is active; favor short bias when strong bear is active.
Treat weak regimes as pullback/transition context rather than immediate reversals, especially with higher acceptance.
Structure + oscillator:
Combine regimes with swing structure, breakouts, or a baseline trend filter to avoid trading against dominant structure.
Use regime change alerts as a “state change” notification, not as a standalone entry.
Multi-asset consistency:
The bucket mapping helps keep a consistent “feel” across different chart timeframes without relying on external timeframe series.
Behavior/Constraints
Intrabar behavior:
No cross-timeframe requests are used; values can still evolve on the live bar and settle at close depending on your chart/update timing.
Warm-up requirements:
Large resolved lengths require sufficient history to seed RSI and smoothing. Expect a warm-up period after loading or switching symbols/timeframes.
Latency by design:
Dead-band and acceptance filtering reduce noise but can delay regime changes during sharp reversals.
Chart types:
Intended for standard time-based charts. Non-time-based or synthetic chart types (e.g., Heikin-Ashi, Renko, Kagi, Point-and-Figure, Range) can distort oscillator behavior and regime stability.
Tuning
Too many flips near decision boundaries:
Increase Epsilon and/or increase Acceptance bars.
Too sluggish in clean trends:
Reduce Acceptance bars by one, or choose a faster preset (shorter base lengths).
Too sensitive on lower timeframes:
Choose a slower preset (longer base lengths) or force a higher Target Bucket.
Want less clutter:
Disable the table and keep only the alert + plots you need.
What it is/isn’t
This indicator is a regime and visualization layer for RSI using higher-timeframe emulation and stability gates. It is not a complete trading system and does not provide position sizing, risk management, or execution rules. Use it alongside structure, liquidity/volatility context, and protective risk controls.
Disclaimer
The content provided, including all code and materials, is strictly for educational and informational purposes only. It is not intended as, and should not be interpreted as, financial advice, a recommendation to buy or sell any financial instrument, or an offer of any financial product or service. All strategies, tools, and examples discussed are provided for illustrative purposes to demonstrate coding techniques and the functionality of Pine Script within a trading context.
Any results from strategies or tools provided are hypothetical, and past performance is not indicative of future results. Trading and investing involve high risk, including the potential loss of principal, and may not be suitable for all individuals. Before making any trading decisions, please consult with a qualified financial professional to understand the risks involved.
By using this script, you acknowledge and agree that any trading decisions are made solely at your discretion and risk.
Best regards and happy trading
Chervolino.

Relative Valuation OscillatorRelative Valuation Oscillator (RVO) Description
The Valuation_OTC.pine script is a Relative Valuation Oscillator for TradingView that compares the current asset against a reference asset (like Bitcoin, S&P 500, or Gold) to determine if it's relatively overvalued or undervalued.
Key Features:
1. Multiple Calculation Methods:
Simple Ratio - Compares price ratio deviation from average
Percentage Difference - Direct percentage comparison between assets
Ratio Z-Score - Statistical measure (standard deviations from mean)
Rate of Change Comparison - Compares momentum/performance
Normalized Ratio - 0-100 scale centered at zero
2. Customizable Settings:
Reference asset selection (default: BTC/USDT)
Adjustable lookback period (10-500 bars)
Optional smoothing with configurable period
Overbought/oversold level thresholds (default: ±1.5)
3. Trading Signals:
Overvalued - Oscillator above overbought level (red zone)
Undervalued - Oscillator below oversold level (green zone)
Neutral - Between thresholds
Crossover alerts for key levels
Divergence detection (bullish/bearish)
4. Visual Components:
Color-coded oscillator line (green when positive, red when negative)
Optional signal line for additional smoothing
Background shading for valuation zones
Information table showing current metrics and status
Shape markers for crossovers and divergences
5. Alert Conditions:
Overvalued/undervalued alerts
Zero-line crossovers
Divergence signals
This indicator is useful for pairs trading, relative strength analysis, and identifying when an asset is trading at extremes relative to a benchmark asset.

Fusion MFI RSIHello fellas,
This superb indicator summons two monsters called Relative Strength Index (RSI) and Money Flow Index (MFI) and plays the Yu-Gi-Oh! card "Polymerization" to combine them.
Overview
The Fusion MFI RSI Indicator is an advanced analytical tool designed to provide a nuanced understanding of market dynamics by combining the Relative Strength Index (RSI) and the Money Flow Index (MFI). Enhanced with sophisticated smoothing techniques and the Inverse Fisher Transform (IFT), this indicator excels in identifying key market conditions such as overbought and oversold states, trends, and potential reversal points.
Key Features (Brief Overview)
Fusion of RSI and MFI: Integrates momentum and volume for a comprehensive market analysis.
Advanced Smoothing Techniques: Employs Hann Window, Jurik Moving Average (JMA), T3 Smoothing, and Super Smoother to refine signals.
Inverse Fisher Transform (IFT) Enhances the clarity and distinctiveness of indicator outputs.
Detailed Feature Analysis
Fusion of RSI and MFI
RSI (Relative Strength Index): Developed by J. Welles Wilder Jr., the RSI measures the speed and magnitude of directional price movements. Wilder recommended using a 14-day period and identified overbought conditions above 70 and oversold conditions below 30.
MFI (Money Flow Index): Created by Gene Quong and Avrum Soudack, the MFI combines price and volume to measure trading pressure. It is typically calculated using a 14-day period, with over 80 considered overbought and under 20 as oversold.
Application in Fusion: By combining RSI and MFI, the indicator leverages RSI's sensitivity to price changes with MFI's volume-weighted confirmation, providing a robust analysis tool. This combination is particularly effective in confirming the strength behind price movements, making the signals more reliable.
Advanced Smoothing Techniques
Hann Window: Traditionally used to reduce the abrupt data discontinuities at the edges of a sample, it is applied here to smooth the price data.
Jurik Moving Average (JMA): Known for preserving the timing and smoothness of the data, JMA reduces market noise effectively without significant lag.
T3 Smoothing: Developed to respond quickly to market changes, T3 provides a smoother response to price fluctuations.
Super Smoother: Filters out high-frequency noise while retaining important trends.
Application in Fusion: These techniques are chosen to refine the output of the combined RSI and MFI values, ensuring the indicator remains responsive yet stable, providing clearer and more actionable signals.
Inverse Fisher Transform (IFT):
Developed by John Ehlers, the IFT transforms oscillator outputs to enhance the clarity of extreme values. This is particularly useful in this fusion indicator to make critical turning points more distinct and actionable.
Mathematical Calculations for the Fusion MFI RSI Indicator
RSI (Relative Strength Index)
The RSI is calculated using the following steps:
Average Gain and Average Loss: First, determine the average gain and average loss over the specified period (typically 14 days). This is done by summing all the gains and losses over the period and then dividing each by the period.
Average Gain = (Sum of Gains over the past 14 periods) / 14
Average Loss = (Sum of Losses over the past 14 periods) / 14
Relative Strength (RS): This is the ratio of average gain to average loss.
RS = Average Gain / Average Loss
RSI: Finally, the RSI is calculated using the RS value:
RSI = 100 - (100 / (1 + RS))
MFI (Money Flow Index)
The MFI is calculated using several steps that incorporate both price and volume:
Typical Price: Calculate the typical price for each period.
Typical Price = (High + Low + Close) / 3
Raw Money Flow: Multiply the typical price by the volume for the period.
Raw Money Flow = Typical Price * Volume
Positive and Negative Money Flow: Compare the typical price of the current period to the previous period to determine if the money flow is positive or negative.
If today's Typical Price > Yesterday's Typical Price, then Positive Money Flow = Raw Money Flow; Negative Money Flow = 0
If today's Typical Price < Yesterday's Typical Price, then Negative Money Flow = Raw Money Flow; Positive Money Flow = 0
Money Flow Ratio: Calculate the ratio of the sum of Positive Money Flows to the sum of Negative Money Flows over the past 14 periods.
Money Flow Ratio = (Sum of Positive Money Flows over 14 periods) / (Sum of Negative Money Flows over 14 periods)
MFI: Finally, calculate the MFI using the Money Flow Ratio.
MFI = 100 - (100 / (1 + Money Flow Ratio))
Fusion of RSI and MFI
The final Fusion MFI RSI value could be calculated by averaging the IFT-transformed values of RSI and MFI, providing a single oscillator value that reflects both momentum and volume-weighted price action:
Fusion MFI RSI = (MFI weight * MFI) + (RSI weight * RSI)
Suggested Settings and Trading Rules
Original Usage
RSI: Wilder suggested buying when the RSI moves above 30 from below (enter long) and selling when the RSI moves below 70 from above (enter short). He recommended exiting long positions when the RSI reaches 70 or higher and exiting short positions when the RSI falls below 30.
MFI: Quong and Soudack recommended buying when the MFI is below 20 and starts rising (enter long), and selling when it is above 80 and starts declining (enter short). They suggested exiting long positions when the MFI reaches 80 or higher and exiting short positions when the MFI falls below 20.
Fusion Application
Settings: Use a 14-day period for this indicator's calculations to maintain consistency with the original settings suggested by the inventors.
Trading Rules:
Enter Long Signal: Consider entering a long position when both RSI and MFI are below their respective oversold levels and begin to rise. This indicates strong buying pressure supported by both price momentum and volume.
Exit Long Signal: Exit the long position when either RSI or MFI reaches its respective overbought threshold, suggesting a potential reversal or decrease in buying pressure.
Enter Short Signal: Consider entering a short position when both indicators are above their respective overbought levels and begin to decline, suggesting that selling pressure is mounting.
Exit Short Signal: Exit the short position when either RSI or MFI falls below its respective oversold threshold, indicating diminishing selling pressure and a potential upward reversal.
How to Use the Indicator
Select Source and Timeframe: Choose the data source and the timeframe for analysis.
Configure Fusion Settings: Adjust the weights for RSI and MFI.
Choose Smoothing Technique: Select and configure the desired smoothing method to suit the market conditions and personal preference.
Enable Fisherization: Optionally apply the Inverse Fisher Transform to enhance signal clarity.
Customize Visualization: Set up gradient coloring, background plots, and bands according to your preferences.
Interpret the Indicator: Use the Fusion value and visual cues to identify market conditions and potential trading opportunities.
Conclusion
The Fusion MFI RSI Indicator integrates classical and modern technical analysis concepts to provide a comprehensive tool for market analysis. By combining RSI and MFI with advanced smoothing techniques and the Inverse Fisher Transform, this indicator offers enhanced insights, aiding traders in making more informed and timely trading decisions. Customize the settings to align with your trading strategy and leverage this powerful tool to navigate financial markets effectively.
Best regards,
simwai
---
Credits to:
@loxx – T3
@everget – JMA
@cheatcountry – Hann Window

PresentTrend RMI Synergy - Strategy [presentTrading] █ Introduction and How it is Different
The "PresentTrend RMI Synergy Strategy" is the combined power of the Relative Momentum Index (RMI) and a custom presentTrend indicator. This strategy introduces a multifaceted approach, integrating momentum analysis with trend direction to offer traders a more nuanced and responsive trading mechanism.
BTCUSD 6h L/S Performance
Local
█ Strategy, How It Works: Detailed Explanation
The "PresentTrend RMI Synergy Strategy" intricately combines the Relative Momentum Index (RMI) and a custom SuperTrend indicator to create a powerful tool for traders.
🔶 Relative Momentum Index (RMI)
The RMI is a variation of the Relative Strength Index (RSI), but instead of using price closes against itself, it measures the momentum of up and down movements in price relative to previous prices over a given period. The RMI for a period length `N` is calculated as follows:
RMI = 100 - 100/ (1 + U/D)
where:
- `U` is the average upward price change over `N` periods,
- `D` is the average downward price change over `N` periods.
The RMI oscillates between 0 and 100, with higher values indicating stronger upward momentum and lower values suggesting stronger downward momentum.
RMI = 21
RMI = 42
For more information - RMI Trend Sync - Strategy :
🔶 presentTrend Indicator
The presentTrend indicator combines the Average True Range (ATR) with a moving average to determine trend direction and dynamic support or resistance levels. The presentTrend for a period length `M` and a multiplier `F` is defined as:
- Upper Band: MA + (ATR x F)
- Lower Band: MA - (ATR x F)
where:
- `MA` is the moving average of the close price over `M` periods,
- `ATR` is the Average True Range over the same period,
- `F` is the multiplier to adjust the sensitivity.
The trend direction switches when the price crosses the presentTrend bands, signaling potential entry or exit points.
presentTrend length = 3
presentTrend length = 10
For more information - PresentTrend - Strategy :
🔶 Strategy Logic
Entry Conditions:
- Long Entry: Triggered when the RMI exceeds a threshold, say 60, indicating a strong bullish momentum, and when the price is above the presentTrend, confirming an uptrend.
- Short Entry: Occurs when the RMI drops below a threshold, say 40, showing strong bearish momentum, and the price is below the present trend, indicating a downtrend.
Exit Conditions with Dynamic Trailing Stop:
- Long Exit: Initiated when the price crosses below the lower presentTrend band or when the RMI falls back towards a neutral level, suggesting a weakening of the bullish momentum.
- Short Exit: Executed when the price crosses above the upper presentTrend band or when the RMI rises towards a neutral level, indicating a reduction in bearish momentum.
Equations for Dynamic Trailing Stop:
- For Long Positions: The exit price is set at the lower SuperTrend band once the entry condition is met.
- For Short Positions: The exit price is determined by the upper SuperTrend band post-entry.
These dynamic trailing stops adjust as the market moves, providing a method to lock in profits while allowing room for the position to grow.
This strategy's strength lies in its dual analysis approach, leveraging RMI for momentum insights and presentTrend for trend direction and dynamic stops. This combination offers traders a robust framework to navigate various market conditions, aiming to capture trends early and exit positions strategically to maximize gains and minimize losses.
█ Trade Direction
The strategy provides flexibility in trade direction selection, offering "Long," "Short," or "Both" options to cater to different market conditions and trader preferences. This adaptability ensures that traders can align the strategy with their market outlook, risk tolerance, and trading goals.
█ Usage
To utilize the "PresentTrend RMI Synergy Strategy," traders should input their preferred settings in the Pine Script™ and apply the strategy to their charts. Monitoring RMI for momentum shifts and adjusting positions based on SuperTrend signals can optimize entry and exit points, enhancing potential returns while managing risk.
█ Default Settings
1. RMI Length: 21
The 21-period RMI length strikes a balance between capturing momentum and filtering out market noise, offering a medium-term outlook on market trends.
2. Super Trend Length: 7
A SuperTrend length of 7 periods is chosen for its responsiveness to price movements, providing a dynamic framework for trend identification without excessive sensitivity.
3. Super Trend Multiplier: 4.0
The multiplier of 4.0 for the SuperTrend indicator widens the trend bands, focusing on significant market moves and reducing the impact of minor fluctuations.
---
The "PresentTrend RMI Synergy Strategy" represents a significant step forward in trading strategy development, blending momentum and trend analysis in a unique way. By providing a detailed framework for understanding market dynamics, this strategy empowers traders to make more informed decisions.

Global & local RSI / Flowly IndicatorsAs the terms global and local imply, global RSI describes broad relative strength, whereas local RSI describes local relative strength within the broad moves. A macro and micro view of relative strength so to speak. Global and local RSI are simply regular RSI and stochastic RSI. Local RSI extremes ( stochastic RSI oversold/overbought) often mark a pivot in RSI which naturally reflects to price. Local RSI extremes are visualized inside the global RSI bands (upper band for overbought, lower band for oversold) in a "heat map" style.
By default:
Stochastic RSI >= 75 = yellow
Stochastic RSI >= 87 = orange
Stochastic RSI >= 100 = pink
Users also have the ability smooth the RSI with their preferred smoothing method ( SMA , EMA , HMA , RMA, WMA ) and length. This leads to different behavior in RSI, rendering the typical RSI extremes (> 70 or < 30) suboptimal or even useless. By enabling adaptive bands, the extremes are readjusted based on typical RSI pivot points (median pivots ), which gives much more relevant reference points for oversold/overbought conditions in both global and local RSI. This feature can be used without smoothing, but it rarely provides a meaningful difference, unless the RSI calculation length is messed with.
Global RSI can be plotted as candles, bars or a line. Candles and bars can be useful for detecting rejections (wicks) in relative strength, the same you would with OHLC data. Sometimes there are "hidden rejections" that are visible in relative strength but not on OHLC data, which naturally gives an advantage. All colors can be adjusted in the input menu. You also have a real-time view of the current RSI states in top right corner. Available alerts are the following: global RSI overbought, global RSI oversold, local RSI overbought and local RSI oversold.

Relative Volume IndicatorA simple indicator showing the relation of volume to highest volume for a define number of bars. Helps to differentiate periods of low and high volume.
Define the number of bars to find the highest volume used as a basis.
Apply a simple moving average to smoothen the volume. Set it to 1 to disable smoothing.
Define a threshold differentiating low and high volume.

Relative Bandwidth FilterThis is a very simple script which can be used as measure to define your trading zones based on volatility.
Concept
This script tries to identify the area of low and high volatility based on comparison between Bandwidth of higher length and ATR of lower length.
Relative Bandwidth = Bandwidth / ATR
Bandwidth can be based on either Bollinger Band, Keltner Channel or Donchian Channel. Length of the bandwidth need to be ideally higher.
ATR is calculated using built in ATR method and ATR length need to be ideally lower than that used for calculating Bandwidth.
Once we got Relative Bandwidth, the next step is to apply Bollinger Band on this to measure how relatively high/low this value is.
Overall - If relative bandwidth is higher, then volatility is comparatively low. If relative bandwidth is lower, then volatility is comparatively high.
Usage
This can be used with your own strategy to filter out your non-trading zones based on volatility. Script plots a variable called "Signal" - which is not shown on chart pane. But, it is available in the data window. This can be used in another script as external input and apply logic.
Signal values can be
1 : Allow only Long
-1 : Allow only short
0 : Do not allow any trades
2 : Allow both Long and Short

RVOL - Final on 814 for 3m Candles ONLYRelative Volume for 3 minute charts ONLY.
Lookback 20 days.
Historical and average values are used to formulate the ratio.
Thank you to R4Rocket for the initial code.
I also researched the RVOL output in Trade Ideas to align the final ratio as close as possible.
The colors change at different levels:
<0.5 ; Red
0.5 > and <=.65 ; Orange
0.65 > and <=1 ; Dark Yellow
1 > and <=1.25 ; Bright Yellow
1.25 < and <=1.5 ; Dark Green
1.5 < and <=2 ; Brighter Green
Above 2 ; Very Bright Green

Uptrick: Smart BoundariesThis script is an indicator that combines the RSI (Relative Strength Index) and Bollinger Bands to highlight potential points where price momentum and volatility may both be at extreme levels. Below is a detailed explanation of its components, how it calculates signals, and why these two indicators have been merged into one tool. This script is intended solely for educational purposes and for traders who want to explore the combined use of momentum and volatility measures. Please remember that no single indicator guarantees profitable results.
Purpose of This Script
This script is designed to serve as a concise, all-in-one tool for traders seeking to track both momentum and volatility extremes in real time. By overlaying RSI signals with Bollinger Band boundaries, it helps users quickly identify points on a chart where price movement may be highly stretched. The goal is to offer a clearer snapshot of potential overbought or oversold conditions without requiring two separate indicators. Additionally, its optional pyramiding feature enables users to manage how many times they initiate trades when signals repeat in the same direction. Through these combined functions, the script aims to streamline technical analysis by consolidating two popular measures—momentum via RSI and volatility via Bollinger Bands—into a single, manageable interface.
1. Why Combine RSI and Bollinger Bands
• RSI (Relative Strength Index): This is a momentum oscillator that measures the speed and magnitude of recent price changes. It typically ranges between 0 and 100. Traders often watch for RSI crossing into “overbought” or “oversold” levels because it may indicate a potential shift in momentum.
• Bollinger Bands: These bands are plotted around a moving average, using a standard deviation multiplier to create an upper and lower boundary. They help illustrate how volatile the price has been relative to its recent average. When price moves outside these boundaries, some traders see it as a sign the price may be overstretched and could revert closer to the average.
Combining these two can be useful because it blends two different perspectives on market movement. RSI attempts to identify momentum extremes, while Bollinger Bands track volatility extremes. By looking for moments when both conditions agree, the script tries to highlight points where price might be unusually stretched in terms of both momentum and volatility.
2. How Signals Are Generated
• Buy Condition:
- RSI dips below a specified “oversold” level (for example, 30 by default).
- Price closes below the lower Bollinger Band.
When these occur together, the script draws a label indicating a potential bullish opportunity. The underlying reasoning is that momentum (RSI) suggests a stronger-than-usual sell-off, and price is also stretched below the lower Bollinger Band.
• Sell Condition:
- RSI rises above a specified “overbought” level (for example, 70 by default).
- Price closes above the upper Bollinger Band.
When these occur together, a label is plotted for a potential bearish opportunity. The rationale is that momentum (RSI) may be overheated, and the price is trading outside the top of its volatility range.
3. Pyramiding Logic and Trade Count Management
• Pyramiding refers to taking multiple positions in the same direction when signals keep firing. While some traders prefer just one position per signal, others like to scale into a trade if the market keeps pushing in their favor.
• This script uses variables that keep track of how many recent buy or sell signals have fired. If the count reaches a user-defined maximum, no more signals of that type will trigger additional labels. This protects traders from over-committing to one direction if the market conditions remain “extreme” for a prolonged period.
• If you disable the pyramiding feature, the script will only plot one label per side until the condition resets (i.e., until RSI and price conditions are no longer met).
4. Labels and Visual Feedback
• Whenever a buy or sell condition appears, the script plots a label directly on the chart:
- Buy labels under the price bar.
- Sell labels above the price bar.
These labels make it easier to review where both RSI and Bollinger Band conditions align. It can be helpful for visually scanning the chart to see if the signals show any patterns related to market reversals or trend continuations.
• The Bollinger Bands themselves are plotted so traders can see when the price is approaching or exceeding the upper or lower band. Watching the RSI and Bollinger Band plots simultaneously can give traders more context for each signal.
5. Originality and Usefulness
This script provides a distinct approach by merging two well-established concepts—RSI and Bollinger Bands—within a single framework, complemented by optional pyramiding controls. Rather than using each indicator separately, it attempts to uncover moments when momentum signals from RSI align with volatility extremes highlighted by Bollinger Bands. This combined perspective can aid in spotting areas of possible overextension in price. Additionally, the built-in pyramiding mechanism offers a method to manage multiple signals in the same direction, allowing users to adjust how aggressively they scale into trades. By integrating these elements together, the script aims to deliver a tool that caters to diverse trading styles while remaining straightforward to configure and interpret.
6. How to Use the Indicator
• Configure the Inputs:
- RSI Length (the lookback period used for the RSI calculation).
- RSI Overbought and Oversold Levels.
- Bollinger Bands Length and Multiplier (defines the moving average period and the degree of deviation).
- Option to reduce pyramiding.
• Set Alerts (Optional):
- You can create TradingView alerts for when these conditions occur, so you do not have to monitor the chart constantly. Choose the buy or sell alert conditions in your alert settings.
• Integration in a Trading Plan:
- This script alone is not a complete trading system. Consider combining it with other forms of analysis, such as support and resistance, volume profiles, or candlestick patterns. Thorough research, testing on historical data, and risk management are always recommended.
7. No Performance Guarantees
• This script does not promise any specific trading results. It is crucial to remember that no single indicator can accurately predict future market movements all the time. The script simply tries to highlight moments when two well-known indicators both point to an extreme condition.
• Actual trading decisions should factor in a range of market information, including personal risk tolerance and broader market conditions.
8. Purpose and Limitations
• Purpose:
- Provide a combined view of momentum (RSI) and volatility (Bollinger Bands) in a single script.
- Assist in spotting times when price may be at an extreme.
- Offer a configurable system for labeling potential buy or sell points based on these extremes.
• Limitations:
- Overbought and oversold conditions can persist for an extended period in trending markets.
- Bollinger Band breakouts do not always result in immediate reversals. Sometimes price keeps moving in the same direction.
- The script does not include a built-in exit strategy or risk management rules. Traders must handle these themselves.
Additional Disclosures
This script is published open-source and does not rely on any external or private libraries. It does not use lookahead methods or repaint signals; all calculations are performed on the current bar without referencing future data. Furthermore, the script is designed for standard candlestick or bar charts rather than non-standard chart types (e.g., Heikin Ashi, Renko). Traders should keep in mind that while the script can help locate potential momentum and volatility extremes, it does not include an exit strategy or account for factors like slippage or commission. All code comes from built-in Pine Script functions and standard formulas for RSI and Bollinger Bands. Anyone reviewing or modifying this script should exercise caution and incorporate proper risk management when applying it to their own trading.
Calculation Details
The script computes RSI by examining a user-defined number of prior bars (the RSI Length) and determining the average of up-moves relative to the average of down-moves over that period. This ratio is then scaled to a 0–100 range, so lower values typically indicate stronger downward momentum, while higher values suggest stronger upward momentum. In parallel, Bollinger Bands are generated by first calculating a simple moving average (SMA) of the closing price for the user-specified length. The script then measures the standard deviation of closing prices over the same period and multiplies it by the chosen factor (the Bollinger Bands Multiplier) to form the upper and lower boundaries around the SMA. These two measures are checked in tandem: if the RSI dips below a certain oversold threshold and price trades below the lower Bollinger Band, a condition is met that may imply a strong short-term sell-off; similarly, if the RSI surpasses the overbought threshold and price rises above the upper Band, it may indicate an overextended move to the upside. The pyramiding counters track how many of these signals occur in sequence, preventing excessive stacking of labels on the chart if conditions remain extreme for multiple bars.
Conclusion
This indicator aims to provide a more complete view of potential market extremes by overlaying the RSI’s momentum readings on top of Bollinger Band volatility signals. By doing so, it attempts to help traders see when both indicators suggest that the market might be oversold or overbought. The optional reduced pyramiding logic further refines how many signals appear, giving users the choice of a single entry or multiple scaling entries. It does not claim any guaranteed success or predictive power, but rather serves as a tool for those wanting to explore this combined approach. Always be cautious and consider multiple factors before placing any trades.

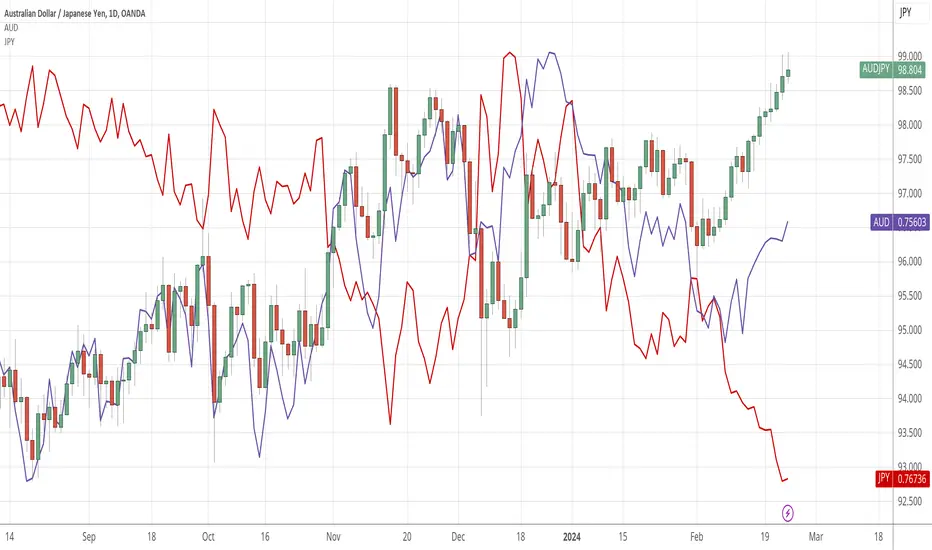
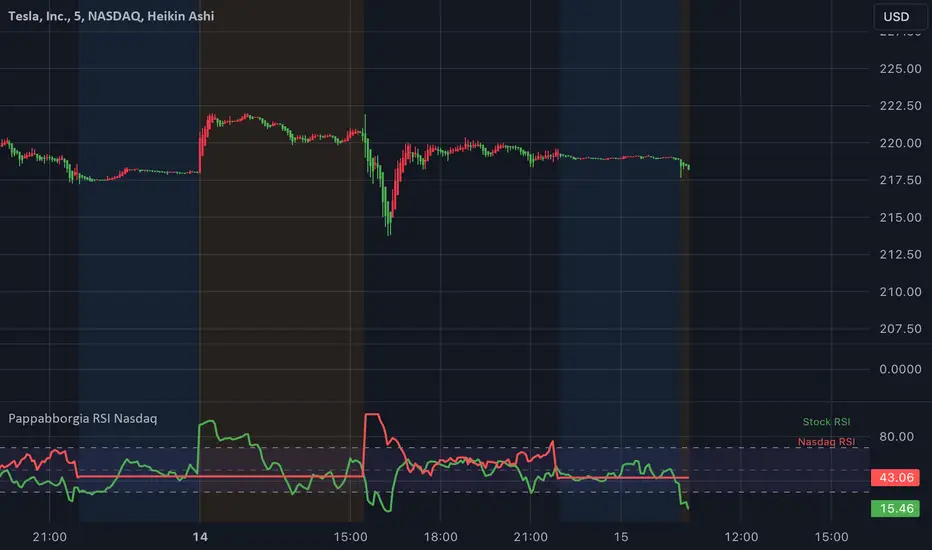
Pappabborgia Nasdaq RSI This script provides a custom Relative Strength Index (RSI) indicator that plots both the RSI of the selected stock and the Nasdaq (IXIC) on the same chart.
It offers a clear, side-by-side view to help traders better understand the stock's momentum relative to the overall market.
Key Features:
RSI Calculation for the Stock:
The script calculates the RSI for the chosen stock, with a default period of 14, adjustable to fit different timeframes.
The stock’s RSI is displayed in green 🟢, providing a direct view of its strength and momentum 📈.
RSI of the Nasdaq:
The script fetches the Nasdaq’s closing prices and calculates its RSI, which is shown in red for clear comparison 🔴.
Legend for Clarity:
A simple legend in the top-right corner identifies the green line as the stock’s RSI and the red line as the Nasdaq’s RSI, making it easy to interpret 📊.
Why Comparing the Stock's RSI to the Nasdaq Matters:
Broader Market Context:
Viewing both RSIs on the same chart helps you see whether the stock is moving in sync with the broader market or behaving independently. This provides valuable context for decision-making 📉.
Relative Strength Insights:
Comparing the stock’s RSI to the Nasdaq’s RSI highlights whether the stock is outperforming or underperforming the overall market, helping identify potential opportunities or risks 🟢🔴.
Improved Risk Management:
Monitoring overbought or oversold conditions in both the stock and Nasdaq RSIs can signal broader market trends and help avoid risky trades ⚠️.
Overall Benefit:
By tracking the RSI of both the stock and the Nasdaq, this script offers a powerful tool for understanding a stock's relative strength, providing essential context for smarter trading decisions 🎯.
WaveTrend With Divs & RSI(STOCH) Divs by WeloTradesWaveTrend with Divergences & RSI(STOCH) Divergences by WeloTrades
Overview
The "WaveTrend With Divergences & RSI(STOCH) Divergences" is an advanced Pine Script™ indicator designed for TradingView, offering a multi-dimensional analysis of market conditions. This script integrates several technical indicators—WaveTrend, Money Flow Index (MFI), RSI, and Stochastic RSI—into a cohesive tool that identifies both regular and hidden divergences across these indicators. These divergences can indicate potential market reversals and provide critical trading opportunities.
This indicator is not just a simple combination of popular tools; it offers extensive customization options, organized data presentation, and valuable trading signals that are easy to interpret. Whether you're a day trader or a long-term investor, this script enhances your ability to make informed decisions.
Originality and Usefulness
The originality of this script lies in its integration and the synergy it creates among the indicators used. Rather than merely combining multiple indicators, this script allows them to work together, enhancing each other's strengths. For example, by identifying divergences across WaveTrend, RSI, and Stochastic RSI simultaneously, the script provides multiple layers of confirmation, which reduces the likelihood of false signals and increases the reliability of trading signals.
The usefulness of this script is apparent in its ability to offer a consolidated view of market dynamics. It not only simplifies the analytical process by combining different indicators but also provides deeper insights through its divergence detection features. This comprehensive approach is designed to help traders identify potential market reversals, confirm trends, and ultimately make more informed trading decisions.
How the Components Work Together
1. Cross-Validation of Signals
WaveTrend: This indicator is primarily used to identify overbought and oversold conditions, as well as potential buy and sell signals. WaveTrend's ability to smooth price data and reduce noise makes it a reliable tool for identifying trend reversals.
RSI & Stochastic RSI: These momentum oscillators are used to measure the speed and change of price movements. While RSI identifies general overbought and oversold conditions, Stochastic RSI offers a more granular view by tracking the RSI’s level relative to its high-low range over a period of time. When these indicators align with WaveTrend signals, it adds a layer of confirmation that enhances the reliability of the signals.
Money Flow Index (MFI): This volume-weighted indicator assesses the inflow and outflow of money in an asset, giving insights into buying and selling pressure. By analyzing the MFI alongside WaveTrend and RSI indicators, the script can cross-validate signals, ensuring that buy or sell signals are supported by actual market volume.
Example Bullish scenario:
When a bullish divergence is detected on the RSI and confirmed by a corresponding bullish signal on the WaveTrend, along with an increasing Money Flow Index, the probability of a successful trade setup increases. This cross-validation minimizes the risk of acting on false signals, which might occur when relying on a single indicator.
Example Bearish scenario:
When a bearish divergence is detected on the RSI and confirmed by a corresponding bearish signal on the WaveTrend, along with an decreasing Money Flow Index, the probability of a successful trade setup increases. This cross-validation minimizes the risk of acting on false signals, which might occur when relying on a single indicator.
2. Divergence Detection and Market Reversals
Regular Divergences: Occur when the price action and an indicator (like RSI or WaveTrend) move in opposite directions. Regular bullish divergence signals a potential upward reversal when the price makes a lower low while the indicator makes a higher low. Conversely, regular bearish divergence suggests a downward reversal when the price makes a higher high, but the indicator makes a lower high.
Hidden Divergences: These occur when the price action and indicator move in the same direction, but with different momentum. Hidden bullish divergence suggests the continuation of an uptrend, while hidden bearish divergence suggests the continuation of a downtrend. By detecting these divergences across multiple indicators, the script identifies potential trend reversals or continuations with greater accuracy.
Example: The script might detect a regular bullish divergence on the WaveTrend while simultaneously identifying a hidden bullish divergence on the RSI. This combination suggests that while a trend reversal is possible, the overall market sentiment remains bullish, providing a nuanced view of the market.
A Regular Bullish Divergence Example:
A Hidden Bullish Divergence Example:
A Regular Bearish Divergence Example:
A Hidden Bearish Divergence Example:
3. Trend Strength and Sentiment Analysis
WaveTrend: Measures the strength and direction of the trend. By identifying the extremes of market sentiment (overbought and oversold levels), WaveTrend provides early signals for potential reversals.
Money Flow Index (MFI): Assesses the underlying sentiment by analyzing the flow of money. A rising MFI during an uptrend confirms strong buying pressure, while a falling MFI during a downtrend confirms selling pressure. This helps traders assess whether a trend is likely to continue or reverse.
RSI & Stochastic RSI: Offer a momentum-based perspective on the trend’s strength. High RSI or Stochastic RSI values indicate that the asset may be overbought, suggesting a potential reversal. Conversely, low values indicate oversold conditions, signaling a possible upward reversal.
Example:
During a strong uptrend, the WaveTrend & RSI's might signal overbought conditions, suggesting caution. If the MFI also shows decreasing buying pressure and the RSI reaches extreme levels, these indicators together suggest that the trend might be weakening, and a reversal could be imminent.
Example:
During a strong downtrend, the WaveTrend & RSI's might signal oversold conditions, suggesting caution. If the MFI also shows increasing buying pressure and the RSI reaches extreme levels, these indicators together suggest that the trend might be weakening, and a reversal could be imminent.
Conclusion
The "WaveTrend With Divergences & RSI(STOCH) Divergences" script offers a powerful, integrated approach to technical analysis by combining trend, momentum, and sentiment indicators into a single tool. Its unique value lies in the cross-validation of signals, the ability to detect divergences, and the comprehensive view it provides of market conditions. By offering traders multiple layers of analysis and customization options, this script is designed to enhance trading decisions, reduce false signals, and provide clearer insights into market dynamics.
WAVETREND
Display of WaveTrend:
Display of WaveTrend Setting:
WaveTrend Indicator Explanation
The WaveTrend indicator helps identify overbought and oversold conditions, as well as potential buy and sell signals. Its flexibility allows traders to adapt it to various strategies, making it a versatile tool in technical analysis.
WaveTrend Input Settings:
WT MA Source: Default: HLC3
What it is: The data source used for calculating the WaveTrend Moving Average.
What it does: Determines the input data to smooth price action and filter noise.
Example: Using HLC3 (average of High, Low, Close) provides a smoother data representation compared to using just the closing price.
Length (WT MA Length): Default: 3
What it is: The period used to calculate the Moving Average.
What it does: Adjusts the sensitivity of the WaveTrend indicator, where shorter lengths respond more quickly to price changes.
Example: A length of 3 is ideal for short-term analysis, providing quick reactions to price movements.
WT Channel Length & Average: Default: WT Channel Length = 9, Average = 12
What it is: Lengths used to calculate the WaveTrend channel and its average.
What it does: Smooths out the WaveTrend further, reducing false signals by averaging over a set period.
Example: Higher values reduce noise and help in identifying more reliable trends.
Channel: Style, Width, and Color:
What it is: Customization options for the WaveTrend channel's appearance.
What it does: Adjusts how the channel is displayed, including line style, width, and color.
Example: Choosing an area style with a distinct color can make the WaveTrend indicator clearly visible on the chart.
WT Buy & Sell Signals:
What it is: Settings to enable and customize buy and sell signals based on WaveTrend.
What it does: Allows for the display of buy/sell signals and customization of their shapes and colors.
When it gives a Buy Signal: Generated when the WaveTrend line crosses below an oversold level and then rises back, indicating a potential upward price movement.
When it gives a Sell Signal: Triggered when the WaveTrend line crosses above an overbought level and then declines, suggesting a possible downward trend.
Example: The script identifies these signals based on mean reversion principles, where prices tend to revert to the mean after reaching extremes. Traders can use these signals to time their entries and exits effectively.
WAVETREND OVERBOUGTH AND OVERSOLD LEVELS
Display of WaveTrend with Overbought & Oversold Levels:
Display of WaveTrend Overbought & Oversold Levels Settings:
WaveTrend Overbought & Oversold Levels Explanation
WT OB & OS Levels: Default: OB Level 1 = 53, OB Level 2 = 60, OS Level 1 = -53, OS Level 2 = -60
What it is: The default overbought and oversold levels used by the WaveTrend indicator to signal potential market reversals.
What it does: When the WaveTrend crosses above the OB levels, it indicates an overbought condition, potentially signaling a reversal or selling opportunity. Conversely, when it crosses below the OS levels, it indicates an oversold condition, potentially signaling a reversal or buying opportunity.
Example: A trader might use these levels to time entry or exit points, such as selling when the WaveTrend crosses into the overbought zone or buying when it crosses into the oversold zone.
Show OB/OS Levels: Default: True
What it is: Toggle options to show or hide the overbought and oversold levels on your chart.
What it does: When enabled, these levels will be visually represented on your chart, helping you to easily identify when the market reaches these critical thresholds.
Example: Displaying these levels can help you quickly see when the WaveTrend is approaching or has crossed into overbought or oversold territory, allowing for more informed trading decisions.
Line Style, Width, and Color for OB/OS Levels:
What it is: Options to customize the appearance of the OB and OS levels on your chart, including line style (solid, dotted, dashed), line width, and color.
What it does: These settings allow you to adjust how prominently these levels are displayed on your chart, which can help you better visualize and respond to overbought or oversold conditions.
Example: Setting a thicker, dashed line in a contrasting color can make these levels stand out more clearly, aiding in quick visual identification.
Example of Use:
Scenario: A trader wants to identify potential selling points when the market is overbought. They set the OB levels at 53 and 60, choosing a solid, red line style to make these levels clear on their chart. As the WaveTrend crosses above 53, they monitor for further price action, and upon crossing 60, they consider initiating a sell order.
WAVETREND DIVERGENCES
Display of WaveTrend Divergence:
Display of WaveTrend Divergence Setting:
WaveTrend Divergence Indicator Explanation
The WaveTrend Divergence feature helps identify potential reversal points in the market by highlighting divergences between the price and the WaveTrend indicator. Divergences can signal a shift in market momentum, indicating a possible trend reversal. This component allows traders to visualize and customize divergence detection on their charts.
WaveTrend Divergence Input Settings:
Potential Reversal Range: Default: 28
What it is: The number of bars to look back when detecting potential tops and bottoms.
What it does: Sets the range for identifying possible reversal points based on historical data.
Example: A setting of 28 looks back across the last 28 bars to find reversal points, offering a balance between responsiveness and reliability.
Reversal Minimum LVL OB & OS: Default: OB = 35, OS = -35
What it is: The minimum overbought and oversold levels required for detecting potential reversals.
What it does: Adjusts the thresholds that trigger a reversal signal based on the WaveTrend indicator.
Example: A higher OB level reduces the sensitivity to overbought conditions, potentially filtering out false reversal signals.
Lookback Bar Left & Right: Default: Left = 10, Right = 1
What it is: The number of bars to the left and right used to confirm a top or bottom.
What it does: Helps determine the position of peaks and troughs in the price action.
Example: A larger left lookback captures more extended price action before the peak, while a smaller right lookback focuses on the immediate past.
Lookback Range Min & Max: Default: Min = 5, Max = 60
What it is: The minimum and maximum range for the lookback period when identifying divergences.
What it does: Fine-tunes the detection of divergences by controlling the range over which the indicator looks back.
Example: A wider range increases the chances of detecting divergences across different market conditions.
R.Div Minimum LVL OB & OS: Default: OB = 53, OS = -53
What it is: The threshold levels for detecting regular divergences.
What it does: Adjusts the sensitivity of the regular divergence detection.
Example: Higher thresholds make the detection more conservative, identifying only stronger divergence signals.
H.Div Minimum LVL OB & OS: Default: OB = 20, OS = -20
What it is: The threshold levels for detecting hidden divergences.
What it does: Similar to regular divergence settings but for hidden divergences, which can indicate potential reversals that are less obvious.
Example: Lower thresholds make the hidden divergence detection more sensitive, capturing subtler market shifts.
Divergence Label Options:
What it is: Options to display and customize labels for regular and hidden divergences.
What it does: Allows users to visually differentiate between regular and hidden divergences using customizable labels and colors.
Example: Using different colors and symbols for regular (R) and hidden (H) divergences makes it easier to interpret signals on the chart.
Text Size and Color:
What it is: Customization options for the size and color of divergence labels.
What it does: Adjusts the readability and visibility of divergence labels on the chart.
Example: Larger text size may be preferred for charts with a lot of data, ensuring divergence labels stand out clearly.
FAST & SLOW MONEY FLOW INDEX
Display of Fast & Slow Money Flow:
Display of Fast & Slow Money Flow Setting:
Fast Money Flow Indicator Explanation
The Fast Money Flow indicator helps traders identify the flow of money into and out of an asset over a shorter time frame. By tracking the volume-weighted average of price movements, it provides insights into buying and selling pressure in the market, which can be crucial for making timely trading decisions.
Fast Money Flow Input Settings:
Fast Money Flow: Length: Default: 9
What it is: The period used for calculating the Fast Money Flow.
What it does: Determines the sensitivity of the Money Flow calculation. A shorter length makes the indicator more responsive to recent price changes, while a longer length provides a smoother signal.
Example: A length of 9 is suitable for traders looking to capture quick shifts in market sentiment over a short period.
Fast MFI Area Multiplier: Default: 5
What it is: A multiplier applied to the Money Flow area calculation.
What it does: Adjusts the size of the Money Flow area on the chart, effectively amplifying or reducing the visual impact of the indicator.
Example: A higher multiplier can make the Money Flow more prominent on the chart, aiding in the quick identification of significant money flow changes.
Y Position (Y Pos): Default: 0
What it is: The vertical position adjustment for the Fast Money Flow plot on the chart.
What it does: Allows you to move the Money Flow plot up or down on the chart to avoid overlap with other indicators.
Example: Adjusting the Y Position can be useful if you have multiple indicators on the chart and need to maintain clarity.
Fast MFI Style, Width, and Color:
What it is: Customization options for how the Fast Money Flow is displayed on the chart.
What it does: Enables you to choose between different plot styles (line or area), set the line width, and select colors for positive and negative money flow.
Example: Using different colors for positive (green) and negative (red) money flow helps to visually distinguish between periods of buying and selling pressure.
Slow Money Flow Indicator Explanation
The Slow Money Flow indicator tracks the flow of money into and out of an asset over a longer time frame. It provides a broader perspective on market sentiment, smoothing out short-term fluctuations and highlighting longer-term trends.
Slow Money Flow Input Settings:
Slow Money Flow: Length: Default: 12
What it is: The period used for calculating the Slow Money Flow.
What it does: A longer period smooths out short-term fluctuations, providing a clearer view of the overall money flow trend.
Example: A length of 12 is often used by traders looking to identify sustained trends rather than short-term volatility.
Slow MFI Area Multiplier: Default: 5
What it is: A multiplier applied to the Slow Money Flow area calculation.
What it does: Adjusts the size of the Money Flow area on the chart, helping to emphasize the indicator’s significance.
Example: Increasing the multiplier can help highlight the Money Flow in markets with less volatile price action.
Y Position (Y Pos): Default: 0
What it is: The vertical position adjustment for the Slow Money Flow plot on the chart.
What it does: Allows for vertical repositioning of the Money Flow plot to maintain chart clarity when used with other indicators.
Example: Adjusting the Y Position ensures that the Slow Money Flow indicator does not overlap with other key indicators on the chart.
Slow MFI Style, Width, and Color:
What it is: Customization options for the visual display of the Slow Money Flow on the chart.
What it does: Allows you to choose the plot style (line or area), set the line width, and select colors to differentiate positive and negative money flow.
Example: Customizing the colors for the Slow Money Flow allows traders to quickly distinguish between buying and selling trends in the market.
RSI
Display of RSI:
Display of RSI Setting:
RSI Indicator Explanation
The Relative Strength Index (RSI) is a momentum oscillator that measures the speed and change of price movements. It is typically used to identify overbought or oversold conditions in the market, providing traders with potential signals for buying or selling.
RSI Input Settings:
RSI Source: Default: Close
What it is: The data source used for calculating the RSI.
What it does: Determines which price data (e.g., close, open) is used in the RSI calculation, affecting how the indicator reflects market conditions.
Example: Using the closing price is standard practice, as it reflects the final agreed-upon price for a given time period.
MA Type (Moving Average Type): Default: SMA
What it is: The type of moving average applied to the RSI for smoothing purposes.
What it does: Changes the smoothing technique of the RSI, impacting how quickly the indicator responds to price movements.
Example: Using an Exponential Moving Average (EMA) will make the RSI more sensitive to recent price changes compared to a Simple Moving Average (SMA).
RSI Length: Default: 14
What it is: The period over which the RSI is calculated.
What it does: Adjusts the sensitivity of the RSI. A shorter length (e.g., 7) makes the RSI more responsive to recent price changes, while a longer length (e.g., 21) smooths out the indicator, reducing the number of signals.
Example: A 14-period RSI is commonly used for identifying overbought and oversold conditions, providing a balance between sensitivity and reliability.
RSI Plot Style, Width, and Color:
What it is: Options to customize the appearance of the RSI line on the chart.
What it does: Allows you to adjust the visual representation of the RSI, including the line width and color.
Example: Setting a thicker line width and a bright color like yellow can make the RSI more visible on the chart, aiding in quick analysis.
Display of RSI with RSI Moving Average:
RSI Moving Average Explanation
The RSI Moving Average adds a smoothing layer to the RSI, helping to filter out noise and provide clearer signals. It is particularly useful for confirming trend strength and identifying potential reversals.
RSI Moving Average Input Settings:
MA Length: Default: 14
What it is: The period over which the Moving Average is calculated on the RSI.
What it does: Adjusts the smoothing of the RSI, helping to reduce false signals and provide a clearer trend indication.
Example: A 14-period moving average on the RSI can smooth out short-term fluctuations, making it easier to spot genuine overbought or oversold conditions.
MA Plot Style, Width, and Color:
What it is: Customization options for how the RSI Moving Average is displayed on the chart.
What it does: Allows you to adjust the line width and color, helping to differentiate the Moving Average from the main RSI line.
Example: Using a contrasting color for the RSI Moving Average (e.g., magenta) can help it stand out against the main RSI line, making it easier to interpret the indicator.
STOCHASTIC RSI
Display of Stochastic RSI:
Display of Stochastic RSI Setting:
Stochastic RSI Indicator Explanation
The Stochastic RSI (Stoch RSI) is a momentum oscillator that measures the level of the RSI relative to its high-low range over a set period of time. It is used to identify overbought and oversold conditions, providing potential buy and sell signals based on momentum shifts.
Stochastic RSI Input Settings:
Stochastic RSI Length: Default: 14
What it is: The period over which the Stochastic RSI is calculated.
What it does: Adjusts the sensitivity of the Stochastic RSI. A shorter length makes the indicator more responsive to recent price changes, while a longer length smooths out the fluctuations, reducing noise.
Example: A length of 14 is commonly used to identify momentum shifts over a medium-term period, providing a balanced view of potential overbought or oversold conditions.
Display of Stochastic RSI %K Line:
Stochastic RSI %K Line Explanation
The %K line in the Stochastic RSI is the main line that tracks the momentum of the RSI over the chosen period. It is the faster-moving component of the Stochastic RSI, often used to identify entry and exit points.
Stochastic RSI %K Input Settings:
%K Length: Default: 3
What it is: The period used for smoothing the %K line of the Stochastic RSI.
What it does: Smoothing the %K line helps reduce noise and provides a clearer signal for potential market reversals.
Example: A smoothing length of 3 is common, offering a balance between responsiveness and noise reduction, making it easier to spot significant momentum shifts.
%K Plot Style, Width, and Color:
What it is: Customization options for the visual representation of the %K line.
What it does: Allows you to adjust the appearance of the %K line on the chart, including line width and color, to fit your visual preferences.
Example: Setting a blue color and a medium width for the %K line makes it stand out clearly on the chart, helping to identify key points of momentum change.
%K Fill Color (Above):
What it is: The fill color that appears above the %K line on the chart.
What it does: Adds visual clarity by shading the area above the %K line, making it easier to interpret the direction and strength of momentum.
Example: Using a light blue fill color above the %K line can help emphasize bullish momentum, making it visually prominent.
Display of Stochastic RSI %D Line:
Stochastic RSI %D Line Explanation
The %D line in the Stochastic RSI is a moving average of the %K line and acts as a signal line. It is slower-moving compared to the %K line and is often used to confirm signals or identify potential reversals when it crosses the %K line.
Stochastic RSI %D Input Settings:
%D Length: Default: 3
What it is: The period used for smoothing the %D line of the Stochastic RSI.
What it does: Smooths out the %D line, making it less sensitive to short-term fluctuations and more reliable for identifying significant market signals.
Example: A length of 3 is often used to provide a smoothed signal line that can help confirm trends or reversals indicated by the %K line.
%D Plot Style, Width, and Color:
What it is: Customization options for the visual representation of the %D line.
What it does: Allows you to adjust the appearance of the %D line on the chart, including line width and color, to match your preferences.
Example: Setting an orange color and a thicker line width for the %D line can help differentiate it from the %K line, making crossover points easier to spot.
%D Fill Color (Below):
What it is: The fill color that appears below the %D line on the chart.
What it does: Adds visual clarity by shading the area below the %D line, making it easier to interpret bearish momentum.
Example: Using a light orange fill color below the %D line can highlight bearish conditions, making it visually easier to identify.
RSI & STOCHASTIC RSI OVERBOUGHT AND OVERSOLD LEVELS
Display of RSI & Stochastic with Overbought & Oversold Levels:
Display of RSI & Stochastic Overbought & Oversold Settings:
RSI & Stochastic Overbought & Oversold Levels Explanation
The Overbought (OB) and Oversold (OS) levels for RSI and Stochastic RSI indicators are key thresholds that help traders identify potential reversal points in the market. These levels are used to determine when an asset is likely overbought or oversold, which can signal a potential trend reversal.
RSI & Stochastic Overbought & Oversold Input Settings:
RSI & Stochastic Level 1 Overbought (OB) & Oversold (OS): Default: OB Level = 170, OS Level = 130
What it is: The first set of thresholds for determining overbought and oversold conditions for both RSI and Stochastic RSI indicators.
What it does: When the RSI or Stochastic RSI crosses above the overbought level, it suggests that the asset might be overbought, potentially signaling a sell opportunity. Conversely, when these indicators drop below the oversold level, it suggests the asset might be oversold, potentially signaling a buy opportunity.
Example: If the RSI crosses above 170, traders might look for signs of a potential trend reversal to the downside, while a cross below 130 might indicate a reversal to the upside.
RSI & Stochastic Level 2 Overbought (OB) & Oversold (OS): Default: OB Level = 180, OS Level = 120
What it is: The second set of thresholds for determining overbought and oversold conditions for both RSI and Stochastic RSI indicators.
What it does: These levels provide an additional set of reference points, allowing traders to differentiate between varying degrees of overbought and oversold conditions, potentially leading to more refined trading decisions.
Example: When the RSI crosses above 180, it might indicate an extreme overbought condition, which could be a stronger signal for a sell, while a cross below 120 might indicate an extreme oversold condition, which could be a stronger signal for a buy.
RSI & Stochastic Overbought (OB) Band Customization:
OB Level 1: Width, Style, and Color:
What it is: Customization options for the visual appearance of the first overbought band on the chart.
What it does: Allows you to set the line width, style (solid, dotted, dashed), and color for the first overbought band, enhancing its visibility on the chart.
Example: A dashed red line with medium width can clearly indicate the first overbought level, helping traders quickly identify when this threshold is crossed.
OB Level 2: Width, Style, and Color:
What it is: Customization options for the visual appearance of the second overbought band on the chart.
What it does: Allows you to set the line width, style, and color for the second overbought band, providing a clear distinction from the first band.
Example: A dashed red line with a slightly thicker width can represent a more significant overbought level, making it easier to differentiate from the first level.
RSI & Stochastic Oversold (OS) Band Customization:
OS Level 1: Width, Style, and Color:
What it is: Customization options for the visual appearance of the first oversold band on the chart.
What it does: Allows you to set the line width, style (solid, dotted, dashed), and color for the first oversold band, making it visually prominent.
Example: A dashed green line with medium width can highlight the first oversold level, helping traders identify potential buying opportunities.
OS Level 2: Width, Style, and Color:
What it is: Customization options for the visual appearance of the second oversold band on the chart.
What it does: Allows you to set the line width, style, and color for the second oversold band, providing an additional visual cue for extreme oversold conditions.
Example: A dashed green line with a thicker width can represent a more significant oversold level, offering a stronger visual cue for potential buying opportunities.
RSI DIVERGENCES
Display of RSI Divergence Labels:
Display of RSI Divergence Settings:
RSI Divergence Lookback Explanation
The RSI Divergence settings allow traders to customize the parameters for detecting divergences between the RSI (Relative Strength Index) and price action. Divergences occur when the price moves in the opposite direction to the RSI, potentially signaling a trend reversal. These settings help refine the accuracy of divergence detection by adjusting the lookback period and range. ( NOTE: This setting only imply to the RSI. This doesn't effect the STOCHASTIC RSI. )
RSI Divergence Lookback Input Settings:
Lookback Left: Default: 10
What it is: The number of bars to look back from the current bar to detect a potential divergence.
What it does: Defines the left-side lookback period for identifying pivot points in the RSI, which are used to spot divergences. A longer lookback period may capture more significant trends but could also miss shorter-term divergences.
Example: A setting of 10 bars means the script will consider pivot points up to 10 bars before the current bar to check for divergence patterns.
Lookback Right: Default: 1
What it is: The number of bars to look forward from the current bar to complete the divergence pattern.
What it does: Defines the right-side lookback period for confirming a potential divergence. This setting helps ensure that the identified divergence is valid by allowing the script to check subsequent bars for confirmation.
Example: A setting of 1 bar means the script will look at the next bar to confirm the divergence pattern, ensuring that the signal is reliable.
Lookback Range Min: Default: 5
What it is: The minimum range of bars required to detect a valid divergence.
What it does: Sets a lower bound on the range of bars considered for divergence detection. A lower minimum range might capture more frequent but possibly less significant divergences.
Example: Setting the minimum range to 5 ensures that only divergences spanning at least 5 bars are considered, filtering out very short-term patterns.
Lookback Range Max: Default: 60
What it is: The maximum range of bars within which a divergence can be detected.
What it does: Sets an upper bound on the range of bars considered for divergence detection. A larger maximum range might capture more significant divergences but could also include less relevant long-term patterns.
Example: Setting the maximum range to 60 bars allows the script to detect divergences over a longer timeframe, capturing more extended divergence patterns that could indicate major trend reversals.
RSI Divergence Explanation
RSI divergences occur when the RSI indicator and price action move in opposite directions, signaling potential trend reversals. This section of the settings allows traders to customize the appearance and detection of both regular and hidden bullish and bearish divergences.
RSI Divergence Input Settings:
R. Bullish Div Label: Default: True
What it is: An option to display labels for regular bullish divergences.
What it does: Enables or disables the visibility of labels that mark regular bullish divergences, where the price makes a lower low while the RSI makes a higher low, indicating a potential upward reversal.
Example: A trader might use this to spot buying opportunities in a downtrend when a bullish divergence suggests the trend may be reversing.
Bullish Label Color, Line Width, and Line Color:
What it is: Settings to customize the appearance of regular bullish divergence labels.
What it does: Allows you to choose the color of the labels, adjust the width of the divergence lines, and select the color for these lines.
Example: Selecting a green label color and a distinct line width makes bullish divergences easily recognizable on your chart.
R. Bearish Div Label: Default: True
What it is: An option to display labels for regular bearish divergences.
What it does: Enables or disables the visibility of labels that mark regular bearish divergences, where the price makes a higher high while the RSI makes a lower high, indicating a potential downward reversal.
Example: A trader might use this to spot selling opportunities in an uptrend when a bearish divergence suggests the trend may be reversing.
Bearish Label Color, Line Width, and Line Color:
What it is: Settings to customize the appearance of regular bearish divergence labels.
What it does: Allows you to choose the color of the labels, adjust the width of the divergence lines, and select the color for these lines.
Example: Choosing a red label color and a specific line width makes bearish divergences clearly stand out on your chart.
H. Bullish Div Label: Default: False
What it is: An option to display labels for hidden bullish divergences.
What it does: Enables or disables the visibility of labels that mark hidden bullish divergences, where the price makes a higher low while the RSI makes a lower low, indicating potential continuation of an uptrend.
Example: A trader might use this to confirm an existing uptrend when a hidden bullish divergence signals continued buying strength.
Hidden Bullish Label Color, Line Width, and Line Color:
What it is: Settings to customize the appearance of hidden bullish divergence labels.
What it does: Allows you to choose the color of the labels, adjust the width of the divergence lines, and select the color for these lines.
Example: A softer green color with a thinner line width might be chosen to subtly indicate hidden bullish divergences, keeping the chart clean while providing useful information.
H. Bearish Div Label: Default: False
What it is: An option to display labels for hidden bearish divergences.
What it does: Enables or disables the visibility of labels that mark hidden bearish divergences, where the price makes a lower high while the RSI makes a higher high, indicating potential continuation of a downtrend.
Example: A trader might use this to confirm an existing downtrend when a hidden bearish divergence signals continued selling pressure.
Hidden Bearish Label Color, Line Width, and Line Color:
What it is: Settings to customize the appearance of hidden bearish divergence labels.
What it does: Allows you to choose the color of the labels, adjust the width of the divergence lines, and select the color for these lines.
Example: A muted red color with a thinner line width might be selected to indicate hidden bearish divergences without overwhelming the chart.
Divergence Text Size and Color: Default: S (Small)
What it is: Settings to adjust the size and color of text labels for RSI divergences.
What it does: Allows you to customize the size and color of text labels that display the divergence information on the chart.
Example: Choosing a small text size with a bright white color can make divergence labels easily readable without taking up too much space on the chart.
STOCHASTIC DIVERGENCES
Display of Stochastic RSI Divergence Labels:
Display of Stochastic RSI Divergence Settings:
Stochastic RSI Divergence Explanation
Stochastic RSI divergences occur when the Stochastic RSI indicator and price action move in opposite directions, signaling potential trend reversals. These settings allow traders to customize the detection and visual representation of both regular and hidden bullish and bearish divergences in the Stochastic RSI.
Stochastic RSI Divergence Input Settings:
R. Bullish Div Label: Default: True
What it is: An option to display labels for regular bullish divergences in the Stochastic RSI.
What it does: Enables or disables the visibility of labels that mark regular bullish divergences, where the price makes a lower low while the Stochastic RSI makes a higher low, indicating a potential upward reversal.
Example: A trader might use this to spot buying opportunities in a downtrend when a bullish divergence in the Stochastic RSI suggests the trend may be reversing.
Bullish Label Color, Line Width, and Line Color:
What it is: Settings to customize the appearance of regular bullish divergence labels in the Stochastic RSI.
What it does: Allows you to choose the color of the labels, adjust the width of the divergence lines, and select the color for these lines.
Example: Selecting a blue label color and a distinct line width makes bullish divergences in the Stochastic RSI easily recognizable on your chart.
R. Bearish Div Label: Default: True
What it is: An option to display labels for regular bearish divergences in the Stochastic RSI.
What it does: Enables or disables the visibility of labels that mark regular bearish divergences, where the price makes a higher high while the Stochastic RSI makes a lower high, indicating a potential downward reversal.
Example: A trader might use this to spot selling opportunities in an uptrend when a bearish divergence in the Stochastic RSI suggests the trend may be reversing.
Bearish Label Color, Line Width, and Line Color:
What it is: Settings to customize the appearance of regular bearish divergence labels in the Stochastic RSI.
What it does: Allows you to choose the color of the labels, adjust the width of the divergence lines, and select the color for these lines.
Example: Choosing an orange label color and a specific line width makes bearish divergences in the Stochastic RSI clearly stand out on your chart.
H. Bullish Div Label: Default: False
What it is: An option to display labels for hidden bullish divergences in the Stochastic RSI.
What it does: Enables or disables the visibility of labels that mark hidden bullish divergences, where the price makes a higher low while the Stochastic RSI makes a lower low, indicating potential continuation of an uptrend.
Example: A trader might use this to confirm an existing uptrend when a hidden bullish divergence in the Stochastic RSI signals continued buying strength.
Hidden Bullish Label Color, Line Width, and Line Color:
What it is: Settings to customize the appearance of hidden bullish divergence labels in the Stochastic RSI.
What it does: Allows you to choose the color of the labels, adjust the width of the divergence lines, and select the color for these lines.
Example: A softer blue color with a thinner line width might be chosen to subtly indicate hidden bullish divergences, keeping the chart clean while providing useful information.
H. Bearish Div Label: Default: False
What it is: An option to display labels for hidden bearish divergences in the Stochastic RSI.
What it does: Enables or disables the visibility of labels that mark hidden bearish divergences, where the price makes a lower high while the Stochastic RSI makes a higher high, indicating potential continuation of a downtrend.
Example: A trader might use this to confirm an existing downtrend when a hidden bearish divergence in the Stochastic RSI signals continued selling pressure.
Hidden Bearish Label Color, Line Width, and Line Color:
What it is: Settings to customize the appearance of hidden bearish divergence labels in the Stochastic RSI.
What it does: Allows you to choose the color of the labels, adjust the width of the divergence lines, and select the color for these lines.
Example: A muted orange color with a thinner line width might be selected to indicate hidden bearish divergences without overwhelming the chart.
Divergence Text Size and Color: Default: S (Small)
What it is: Settings to adjust the size and color of text labels for Stochastic RSI divergences.
What it does: Allows you to customize the size and color of text labels that display the divergence information on the chart.
Example: Choosing a small text size with a bright white color can make divergence labels easily readable without taking up too much space on the chart.
Alert System:
Custom Alerts for Divergences and Reversals:
What it is: The script includes customizable alert conditions to notify you of detected divergences or potential reversals based on WaveTrend, RSI, and Stochastic RSI.
What it does: Helps you stay informed of key market movements without constantly monitoring the charts, enabling timely decisions.
Example: Setting an alert for regular bearish divergence on the WaveTrend could notify you of a potential sell opportunity as soon as it is detected.
How to Use Alerts:
Set up custom alerts in TradingView based on these conditions to be notified of potential trading opportunities. Alerts are triggered when the indicator detects conditions that match the selected criteria, such as divergences or potential reversals.
By following the detailed guidelines and examples above, you can effectively use and customize this powerful indicator to suit your trading strategy.
For further understanding and customization, refer to the input settings within the script and adjust them to match your trading style and preferences.
How Components Work Together
Synergy and Cross-Validation: The indicator combines multiple layers of analysis to validate trading signals. For example, a WaveTrend buy signal that coincides with a bullish divergence in RSI and positive fast money flow is likely to be more reliable than any single indicator’s signal. This cross-validation reduces the likelihood of false signals and enhances decision-making.
Comprehensive Market Analysis: Each component plays a role in analyzing different aspects of the market. WaveTrend focuses on trend strength, Money Flow indicators assess market sentiment, while RSI and Stochastic RSI offer detailed views of price momentum and potential reversals.
Ideal For
Traders who require a reliable, multifaceted tool for detecting market trends and reversals.
Investors seeking a deeper understanding of market dynamics across different timeframes and conditions, whether in forex, equities, or cryptocurrency markets.
This script is designed to provide a comprehensive tool for technical analysis, combining multiple indicators and divergence detection into one versatile and customizable script. It is especially useful for traders who want to monitor various indicators simultaneously and look for convergence or divergence signals across different technical tools.
Acknowledgements
Special thanks to these amazing creators for inspiration and their creations:
I want to thank these amazing creators for creating there amazing indicators , that inspired me and also gave me a head start by making this indicator! Without their amazing indicators it wouldn't be possible!
vumanchu: VuManChu Cipher B Divergences.
MisterMoTa: RSI + Divergences + Alerts .
DevLucem: Plain Stochastic Divergence.
Note
This indicator is designed to be a powerful tool in your trading arsenal. However , it is essential to backtest and adjust the settings according to your trading strategy before applying it to live trading . If you have any questions or need further assistance, feel free to reach out.

RSI Divergences on price chart - Open Source CodeHello Traders,
I have some exciting news to share with you all! Recently, I came across an incredible RSI divergences indicator developed by Socrate_FR. This indicator, in my opinion has an exceptional accuracy in detecting RSI divergences. However, during my exploration of other indicators in the TradingView library that display signals on the price chart, I found that many of them were often unreliable and missed out on important divergences.One such example is the Prices / RSI Divergences Detector by vtllr. Although vtllr did an amazing job with the indicator, I noticed that it didn't capture several relevant divergences accurately.
This observation inspired me to enhance the most accurate RSI divergences indicator available by showcasing the signals directly on the price chart. By doing so, I aimed to address the issue of unreliable and missed divergences in other price chart indicators. With this enhanced version, you can now effortlessly identify and track RSI regular divergences on the price chart itself:
-Regular bullish divergence occurs when the price forms lower lows while the RSI indicator forms higher lows. It suggests a potential bullish reversal (green line plot)
-Regular bearish divergence occurs when the price forms higher highs while the RSI indicator forms lower highs. It suggests a potential bearish reversal (red line plot)
Another key mofication:
This Indicator introduces a simpler approach compared to the original Socrate indicator. While Socrate differentiated divergences into eight types for both bullish and bearish scenarios, our enhanced version focuses on two distinct categories: small and big divergences. This decision was made to provide a clearer and more user-friendly experience. By condensing the divergence types into two groups, traders can easily identify and analyze the significance of the divergences without getting overwhelmed by excessive variations. The small divergences represent relatively minor divergences, while the big divergences indicate stronger and more significant signals.
-Small divergences represent relatively minor divergences (plotshape small circle)
-Big divergences indicate stronger signals (plotshape big circle)
I firmly believe that this enhanced RSI Divergences Indicator will be an invaluable tool for traders who rely on RSI analysis in their trading strategies. It combines the accuracy of Socrate_FR's original indicator with the enhanced visibility of signals on the price chart, ensuring you never miss any important divergences.
If you're interested in trying out this enhanced version of the indicator, please feel free to access the open-source code. If you want to visit and try the original version of the code visit Socrate_FR profile.
www.tradingview.com
Keep attention!
It is important to note that no trading indicator or strategy is foolproof, and there is always a risk of losses in trading. While this indicator may provide useful information for making conclusions, it should not be used as the sole basis for making trading decisions. Traders should always use proper risk management techniques and consider multiple factors when making trading decisions.
Support us:)
If you find this new indicator helpful in your trading analysis, I would greatly appreciate your support! Please consider to follow, giving it a like, leaving feedback, or sharing it with your trading network. Your engagement will not only help me improve this tool but will also help other traders discover it and benefit from its features. Thank you for your support!

IT-Dual Relative StrengthOne can use this indicator to compare two security i.e. (Nifty and stock with its own sector) how it is performing in compare with preferred index ( Nifty 50 by default).
> 0 outperforming
< 0 underperforming
Works best for Daily TF, but can be applied to Weekly and monthly charts .
Can be use on smaller time frame as well, as per the number of hour you want to calculate.
Apply it to Nifty 50 , industry index, sector index or other security in similar sector
I have Added the Box table as well which shows the performance agents Nifty and selected sector.

Relative Andean ScalpingThis is an experimental signal providing script for scalper that uses 2 of open source indicators.
First one provides the signals for us called Andean Oscillator by @alexgrover . We use it to create long signals when bull line crosses over signal line while being above the bear line. And reverse is true for shorts where bear line crosses over signal line while being above bull line.
Second one is used for filtering out low volatility areas thanks to great idea by @HeWhoMustNotBeNamed called Relative Bandwidth Filter . We use it to filter out signals and create signals only when the Relative Bandwith Line below middle line.
The default values for both indicators changed a bit, especially used linreg values to create relatively better signals. These can be changed in settings. Please be aware that i did not do extensive testing with this indicator in different market conditions so it should be used with caution.

Vix FIX / Stochastic Weights StrategyThis script is based off of Chris Moody's Vix Fix Indicator modified by OskarGallard and BigBitsIO's Stochastic Weights.
This script is a compilation of several different stochastic indicators (and RSI ) where the K value of each indicator is equally weighted. The purpose of the indicator is to combine many indicators together in a fashion that weights them easier. By default, the Stochastic and Stochastic RSI are both enabled - the idea is to speed up the relatively slower Stochastic and to slow down the relatively fast Stochastic RSI . BigBitsIO's Stochastics are also available that can also be added to the weighted calculation. Only the K value is weighted, as the D value is just a moving average of the weighted K.
- Why is this modifed stochastic useful?
- To weight multiple indicators together so that you can attempt to find optimal values shared amongst the indicators. Ex: If Stochastic RSI is 100 and Stochastic is 50, K would be 75 and not particularly high. If you add in a 50 RSI , the K would be 67 in this example. If we weight indicators together that all have a high value they could potentially help find elements that align together to produce a stronger signal.
In this script we have the red "S" triangles which are Exits (overbought stochastic crosses).
Added alerts for stochastic exit signals. Alerts are Pre-Set to only Alert on Bar Close.
The "Williams Vix Fix" is one of the most reliable indicators in history for finding market bottoms. The Vix Fix is simply a code from Larry Williams creating almost identical results for creating the same ability the Vix has to all assets.
The VIX has always been much better at signaling bottoms than tops. Simple reason is when market falls retail traders panic and increase volatility , and professionals come in and capitalize on the situation. At market tops there is no one panicking... just liquidity drying up.
The FE green triangles are "Filtered Entries".
The AE green triangles are "Aggressive Filtered Entries".
Added Alerts to Williams Vix Fix (Aggressive Entry and Filtered Entry). Alerts are Pre-Set to only Alert on Bar Close.
Added "Ehlrers StochCCI" indicator of user @glaz
The Ehlrers StochCCI is a variation of Ehlers Stochastic RSI replaced with CCI.
The John Ehlers' article in August, 2006, "Modeling The Market = Building Trading Strategies," describes a process for extracting trend and cyclic elements from market data, then recombining them for trading purposes. He used the Stochastic RSI denoted the cyclic elements.
Added ability to show Dots when StochCCI Crosses.
Sell: fuchsia dots.
Buy: green dots.
Added alerts for (Buy / Sell) StochCCI. Alerts are Pre-Set to only Alert on Bar Close.
DISCLAIMER: For educational and entertainment purposes only. Nothing in this content should be interpreted as financial advice or a recommendation to buy or sell any sort of security or investment including all types of crypto. DYOR, TYOB.

Candlestick RSThis is a candlestick charted Relative Strength indicator. It compares the chosen stock's progress compared to that of the SPY ETF ... ( SPY is used so it should hopefully update intraday). I use this indicator to see which stocks are outperforming the market.
Input Variable Descriptions:
Ratio: this variable is a float (0 to 1) that is basically how close the Candlestick RS is to the actual price action of the chart. (1.0 being right on top of it, 0.0 being as far away as possible from it)
Ballpark SPY price: this variable has to be constant, and due to the way pinescript works, you have to manually put in a ballpark of what SPY is at.
Neither of these variables influences the actual data of the indicator, but rather how it is shown on screen. It's difficult to describe, so I recommend you messing around with the variables and see what changes.
Hope this helps, I find this useful, so I figured I'd publish this... This is my first pine script so forgive me for any errors, just want to help :)
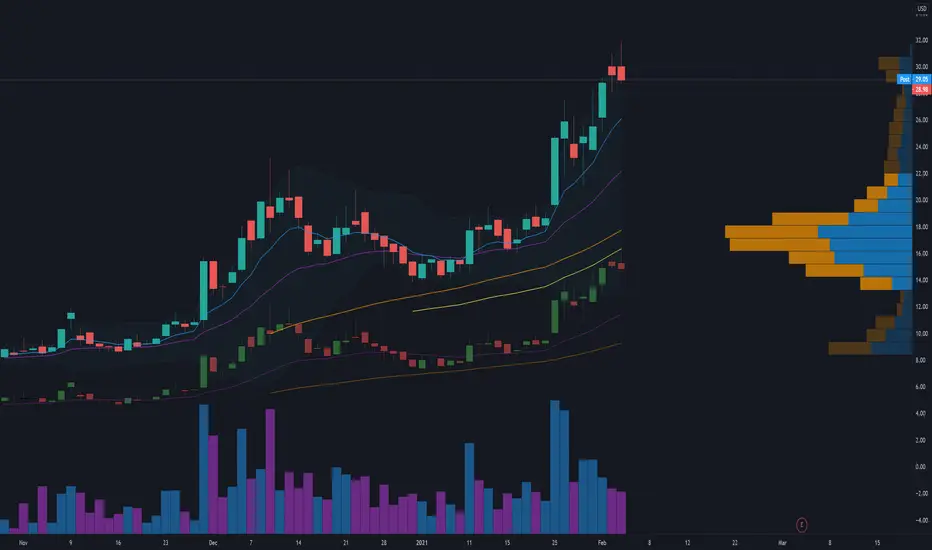
SPY RelativeShows an instrument's sentiment in a day (or week) compared to the market (SPY default). The Red line shows bearish sentiment compared to the market and the green is bullish. Technically this works like a proxy for Alpha/Beta factor.

FX Currency Strength IndicatorFX Currency strength indicator is a visual guide that demonstrates which currencies are currently strong, and which ones are weak.
FX Currency strength indicators include multiple calculation to choose from
1. Relative Strength Index (RSI)
2. True Strength Index (TSI)
3. Absolute Strength Index (ASI)
4. Linear Regression Slope (LRS)
5. Rate of Change (ROC)
6. Z-Score
Three display modes
1. Lines
2. Columns
3. Areas

NZD RSCNZD Relative Strength Comparison to the basket of other major currencies.
nzd = (nzdusd + nzdjpy/100 + nzdcad + 1/gbpnzd + 1/eurnzd + nzdchf + 1/audnzd)/7

EUR RSCEUR Relative Strength Comparison to the basket of other major currencies.
eur = (eurusd + eurgbp + eurjpy/100 + eurcad + eurchf + euraud + eurnzd)/7

AUD RSCAUD Relative Strength Comparison to the basket of other major currencies.
aud = (audusd + audjpy/100 + audcad + audchf + 1/euraud + 1/gbpaud + audnzd)/7