MACD+RSI Indicator Moving Average Convergence/Divergence or MACD is a momentum indicator that shows the relationship between two Exponential Moving Averages (EMAs) of a stock price. Convergence happens when two moving averages move toward one another, while divergence occurs when the moving averages move away from each other. This indicator also helps traders to know whether the stock is being extensively bought or sold. Its ability to identify and assess short-term price movements makes this indicator quite useful.
The Moving Average Convergence/Divergence indicator was invented by Gerald Appel in 1979.
Moving Average Convergence/Divergence is calculated using a 12-day EMA and 26-day EMA. It is important to note that both the EMAs are based on closing prices. The convergence and divergence (CD) values have to be calculated first. The CD value is calculated by subtracting the 26-day EMA from the 12-day EMA.
---------------------------------------------------------------------------------------------------------------------
The relative strength index (RSI) is a momentum indicator used in technical analysis. RSI measures the speed and magnitude of a security's recent price changes to detect overbought or oversold conditions in the price of that security.
The RSI is displayed as an oscillator (a line graph) on a scale of zero to 100. The indicator was developed by J. Welles Wilder Jr. and introduced in his seminal 1978 book, New Concepts in Technical Trading Systems.
In addition to identifying overbought and oversold securities, the RSI can also indicate securities that may be primed for a trend reversal or a corrective pullback in price. It can signal when to buy and sell. Traditionally, an RSI reading of 70 or above indicates an overbought condition. A reading of 30 or below indicates an oversold condition.
---------------------------------------------------------------------------------------------------------------------
By combining them, you can create a MACD/RSI strategy. You can go ahead and search for MACD/RSI strategy on any social platform. It is so powerful that it is the most used indicator in TradingView. It is best for trending market. Our indicator literally let you customize MACD/RSI settings. Explore our indicator by applying to your chart and start trading now!
在腳本中搜尋"Relative"

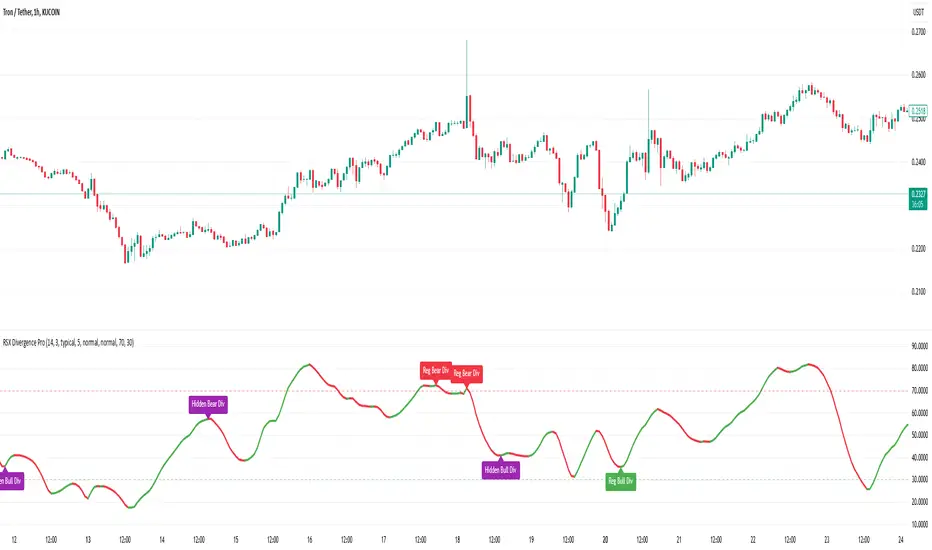
RSX Divergence ProRSX Divergence Pro detects regular and hidden divergences using a smoothed Relative Strength Xtra (RSX) oscillator. It helps traders identify trend reversals and trend continuation signals with clear visual labels. Users can enable/disable divergences, adjust RSX length, customize label colors/sizes, and choose different price types. The indicator also includes dynamic RSX coloration and adjustable overbought/oversold levels for better market insights. Perfect for traders seeking precision in divergence detection and smoother signals than traditional RSI. 🚀
Smart Market Bias [PhenLabs]📊 Smart Market Bias Indicator (SMBI)
Version: PineScript™ v6
Description
The Smart Market Bias Indicator (SMBI) is an advanced technical analysis tool that combines multiple statistical approaches to determine market direction and strength. It utilizes complexity analysis, information theory (Kullback Leibler divergence), and traditional technical indicators to provide a comprehensive market bias assessment. The indicator features adaptive parameters based on timeframe and trading style, with real-time visualization through a sophisticated dashboard.
🔧 Components
Complexity Analysis: Measures price movement patterns and trend strength
KL Divergence: Statistical comparison of price distributions
Technical Overlays: RSI and Bollinger Bands integration
Filter System: Volume and trend validation
Visual Dashboard: Dynamic color-coded display of all components
Simultaneous current timeframe + higher time frame analysis
🚨Important Explanation Feature🚨
By hovering over each individual cell in this comprehensive dashboard, you will get a thorough and in depth explanation of what each cells is showing you
Visualization
HTF Visualization
📌 Usage Guidelines
Based on your own trading style you should alter the timeframe length that you would like to be analyzing with your dashboard
The longer the term of the position you are planning on entering the higher timeframe you should have your dashboard set to
Bias Interpretation:
Values > 50% indicate bullish bias
Values < 50% indicate bearish bias
Neutral zone: 45-55% suggests consolidation
✅ Best Practices:
Use appropriate timeframe preset for your trading style
Monitor all components for convergence/divergence
Consider filter strength for signal validation
Use color intensity as confidence indicator
⚠️ Limitations
Requires sufficient historical data for accurate calculations
Higher computational complexity on lower timeframes
May lag during extremely volatile conditions
Best performance during regular market hours
What Makes This Unique
Multi-Component Analysis: Combines complexity theory, statistical analysis, and traditional technical indicators
Adaptive Parameters: Automatically optimizes settings based on timeframe
Triple-Layer Filtering: Uses trend, volume, and minimum strength thresholds
Visual Confidence System: Color intensity indicates signal strength
Multi-Timeframe Capabilities: Allowing the trader to analyze not only their current time frame but also the higher timeframe bias
🔧 How It Works
The indicator processes market data through four main components:
Complexity Score (40% weight): Analyzes price returns and pattern complexity
Kullback Leibler Divergence (30% weight): Compares current and historical price distributions
RSI Analysis (20% weight): Momentum and oversold/overbought conditions
Bollinger Band Position (10% weight): Price position relative to volatility
Underlying Method
Maintains rolling windows of price data for multiple calculations
Applies custom normalization using hyperbolic tangent function
Weights component scores based on reliability and importance
Generates final bias percentage with confidence visualization
💡 Note: For optimal results, use in conjunction with price action analysis and consider multiple timeframe confirmation. The indicator performs best when all components show alignment.

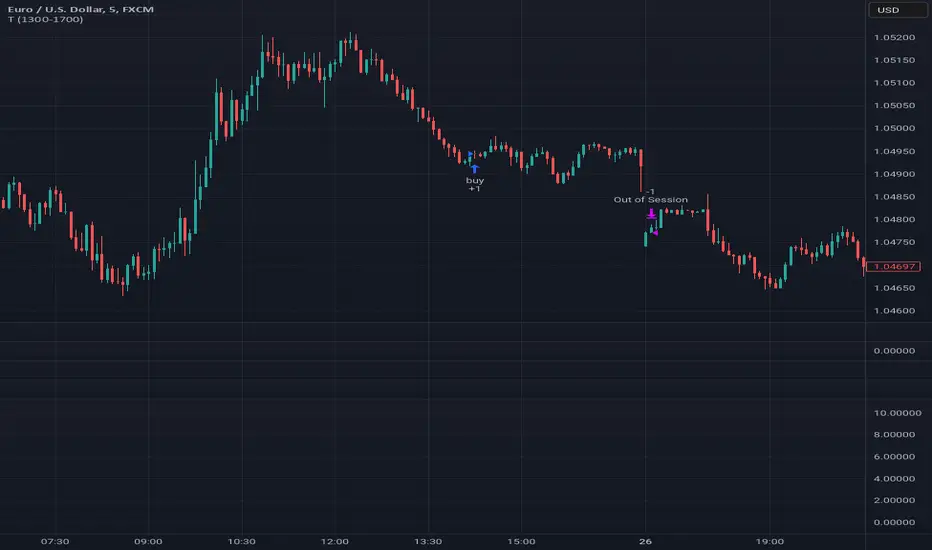
Tutorial - Adding sessions to strategiesA simple script to illustrate how to add sessions to trading strategies.
In this interactive tutorial, you'll learn how to add trading sessions to your strategies using Pine Script. By the end of this session (pun intended!), you'll be able to create custom trading windows that adapt to changing market conditions.
What You'll Learn:
Defining Trading Sessions: Understand how to set up specific time frames for buying and selling, tailored to your unique trading style.
RSI-Based Entry Signals: Discover how to use the Relative Strength Index (RSI) as a trigger for buy and sell signals, helping you capitalize on market trends.
Combining Session Logic with Trading Decisions: Learn how to integrate session-based logic into your strategy, ensuring that trades are executed only during designated times.
By combining these elements, we create an interactive strategy that:
1. Generates buy and sell signals based on RSI levels.
2. Checks if the market is open during a specific trading session (e.g., 1300-1700).
3. Executes trades only when both conditions are met.
**Tips & Variations:**
* Experiment with different RSI periods, thresholds, and sessions to optimize your strategy for various markets and time frames.
* Consider adding more advanced logic, such as stop-losses or position sizing, to further refine your trading approach.
Get ready to take your Pine Script skills to the next level!
~Description partially generated with Llama3_8B
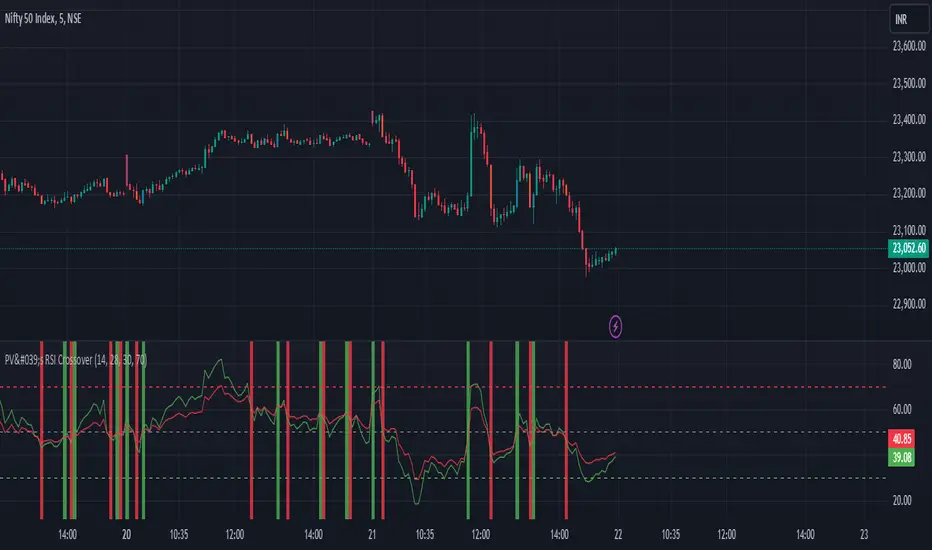
PV's Dual RSI Crossover StrategyIntroduction to the Dual RSI Two-Cross Indicator
The Relative Strength Index (RSI) is a widely used technical indicator in finance that measures the magnitude of recent price changes to determine overbought or oversold conditions. The RSI Two-Cross indicator takes this concept a step further by introducing a unique twist: it plots two RSI lines with different lengths and generates alerts based on their crossovers.
Key Features:
Dual RSI Lines: The indicator plots two RSI lines with user-defined lengths, allowing traders to compare the short-term and long-term momentum of an asset.
Crossover Alerts: The indicator generates alerts when the shorter RSI line crosses above or below the longer RSI line, indicating potential trend reversals or continuations.
Customizable Parameters: Users can adjust the lengths of the RSI lines, oversold and overbought levels, and other parameters to suit their trading strategy and asset of choice.
Visual Aids: The indicator features colored bars and backgrounds to highlight crossover events, making it easy to identify trading opportunities at a glance.
Trading Applications:
Trend Reversal Detection: The RSI Two-Cross indicator can help traders identify potential trend reversals by monitoring crossovers between the two RSI lines.
Momentum Confirmation: The indicator can be used to confirm momentum shifts in an asset's price, helping traders to filter out false signals and make more informed trading decisions.
Scalping and Day Trading: The indicator's short-term focus makes it suitable for scalping and day trading strategies, where traders aim to capitalize on small price movements.
By combining the versatility of the RSI with the power of crossover analysis, the RSI Two-Cross indicator offers a unique perspective on market momentum and trend dynamics. Whether you're a seasoned trader or just starting out, this indicator can help you navigate the markets with greater confidence and precision.
Multi-Feature IndicatorThe Multi-Feature Indicator combines three popular technical analysis tools — RSI, Moving Averages (MA), and MACD — into a single indicator to provide unified buy and sell signals. This script is designed for traders who want to filter out noise and focus on signals confirmed by multiple criteria.
Features:
RSI (Relative Strength Index):
Measures momentum and identifies overbought (70) and oversold (30) conditions.
A signal is triggered when RSI crosses these thresholds.
Moving Averages (MA):
Uses a short-term moving average (default: 9 periods) and a long-term moving average (default: 21 periods).
Buy signals occur when the short-term MA crosses above the long-term MA, indicating an uptrend.
Sell signals occur when the short-term MA crosses below the long-term MA, indicating a downtrend.
MACD (Moving Average Convergence Divergence):
A trend-following momentum indicator that shows the relationship between two moving averages of an asset's price.
Signals are based on the crossover of the MACD line and its signal line.
Unified Buy and Sell Signals:
Buy Signal: Triggered when:
RSI crosses above 30 (leaving oversold territory).
Short-term MA crosses above the long-term MA.
MACD line crosses above the signal line.
Sell Signal: Triggered when:
RSI crosses below 70 (leaving overbought territory).
Short-term MA crosses below the long-term MA.
MACD line crosses below the signal line.
Visualization:
The indicator plots the short-term and long-term moving averages on the price chart.
Green "BUY" labels appear below price bars when all buy conditions are met.
Red "SELL" labels appear above price bars when all sell conditions are met.
Parameters:
RSI Length: Default is 14. This controls the sensitivity of the RSI.
Short MA Length: Default is 9. This determines the short-term trend.
Long MA Length: Default is 21. This determines the long-term trend.
Use Case:
The Multi-Feature Indicator is ideal for traders seeking higher confirmation before entering or exiting trades. By combining momentum (RSI), trend (MA), and momentum shifts (MACD), it reduces false signals and enhances decision-making.
How to Use:
Apply the indicator to your chart in TradingView.
Look for "BUY" or "SELL" signals, which appear when all conditions align.
Use this tool in conjunction with other analysis techniques for best results.
Note:
The default settings are suitable for many assets, but you may need to adjust them for different timeframes or market conditions.
This indicator is meant to assist in trading decisions and should not be used as the sole basis for trading.

RSI BB StdDev SignalOverview
The RSI BB StdDev Signal Indicator is a powerful tool designed to enhance your trading strategy by combining the Relative Strength Index (RSI) with Bollinger Bands (BB). This unique combination allows traders to identify potential buy and sell signals more accurately by leveraging the strengths of both indicators. The RSI helps in identifying overbought and oversold conditions, while the Bollinger Bands provide a dynamic range to assess volatility and potential price reversals.
Key Features
— RSI Calculation: The indicator calculates the RSI based on user-defined parameters, allowing for customization to fit different trading styles.
— Bollinger Bands Integration: The RSI values are smoothed using a moving average, and Bollinger Bands are applied to this smoothed RSI to generate buy and sell signals.
— Divergence Detection: The indicator includes an optional feature to detect and alert on bullish and bearish divergences between the RSI and price action.
— Customizable Alerts: Users can set up alerts for buy and sell signals, as well as for divergences, ensuring they never miss a trading opportunity.
— Visual Aids: The indicator plots the RSI, Bollinger Bands, and signals on the chart, making it easy to visualize and interpret the data.
How It Works
1. RSI Calculation:
— The RSI is calculated using the change in the source input (default is close price) over a specified period.
— The RSI values are then plotted on the chart with customizable overbought and oversold levels.
2. Smoothing and Bollinger Bands:
— The RSI values are smoothed using a moving average (SMA, EMA, SMMA, WMA, VWMA) selected by the user.
— Bollinger Bands are applied to the smoothed RSI to create dynamic upper and lower bands.
3. Signal Generation:
—Buy signals are generated when the RSI crosses above the lower Bollinger Band.
—Sell signals are generated when the RSI crosses below the upper Bollinger Band.
—These signals are plotted on both the RSI pane and the main price chart for easy reference.
4. Divergence Detection:
— The indicator can detect and alert on regular bullish and bearish divergences between the RSI and price action.
— Bullish divergences occur when the price makes a lower low, but the RSI makes a higher low.
— Bearish divergences occur when the price makes a higher high, but the RSI makes a lower high.
Usage
1. Setting Up:
— Add the indicator to your TradingView chart.
— Customize the RSI length, source, and other parameters in the settings panel.
— Enable or disable the divergence detection based on your trading strategy.
2. Interpreting Signals:
— Use the buy and sell signals generated by the RSI crossing the Bollinger Bands as potential entry and exit points.
— Pay attention to divergences for additional confirmation of trend reversals.
3. Alerts:
— Set up alerts for buy and sell signals to receive notifications in real-time.
— Enable divergence alerts to be notified of potential trend reversals.
Conclusion
The RSI BB StdDev Signal Indicator is a comprehensive tool that combines the strengths of the RSI and Bollinger Bands to provide traders with more accurate and reliable signals. Whether you are a beginner or an experienced trader, this indicator can enhance your trading strategy by offering clear visual cues and customizable alerts.
Note
This indicator is provided with open-source code, allowing users to understand its logic and customize it further if needed. The detailed description and customizable settings ensure that traders of all levels can benefit from its unique features.

Dynamic RSI with Overbought/Oversold LinesDynamic RSI with Overbought/Oversold Lines
This indicator enhances the traditional RSI (Relative Strength Index) by dynamically adjusting the overbought and oversold levels based on the highest and lowest RSI values over a user-defined period. The indicator plots these levels as horizontal lines, allowing traders to visually identify when the market is "overbought" or "oversold."
Features:
Dynamic Overbought/Oversold Levels: Automatically adjusts the overbought and oversold levels based on the highest and lowest RSI values within the defined period, ensuring more accurate signals tailored to the current market conditions.
Customizable RSI Period: Choose your preferred RSI period to suit your trading strategy.
Signal Alerts: Visual signals are displayed when the RSI crosses into the overbought or oversold zone, indicating potential reversal points.
Background Color Alerts: The background changes color when the RSI exceeds overbought or oversold levels, making it easier to spot these important zones at a glance.
Clean and Simple: A minimalist design focusing on the key elements, making it suitable for all traders.
How to Use:
Overbought Zone: When the RSI moves above the overbought line (red), it may indicate that the asset is overbought, signaling a potential price reversal or pullback.
Oversold Zone: When the RSI moves below the oversold line (green), it may indicate that the asset is oversold, signaling a potential price bounce or reversal.
This dynamic RSI indicator is perfect for those looking to capture market extremes and improve their trading decisions. It's especially useful for timeframes like 30-minute and 1-hour charts, where market conditions tend to shift more rapidly.

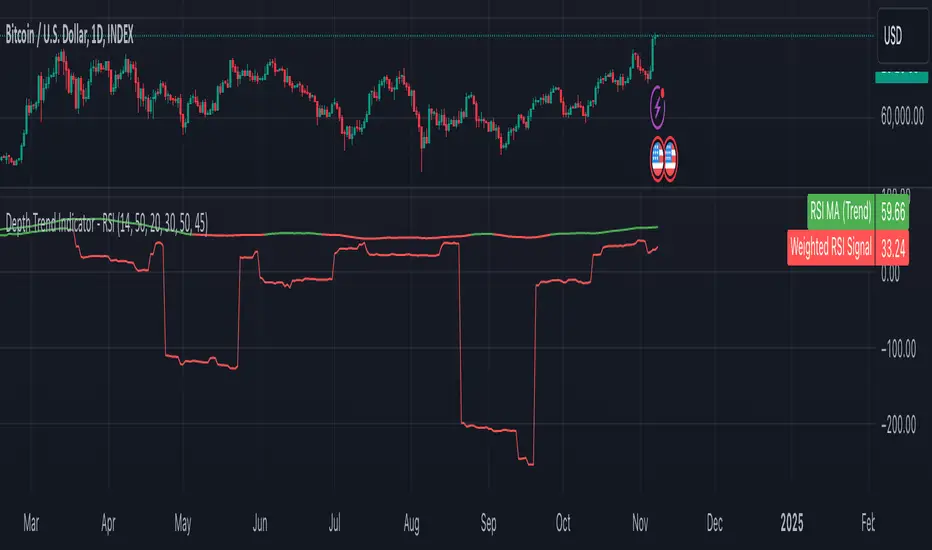
Depth Trend Indicator - RSIDepth Trend Indicator - RSI
This indicator is designed to identify trends and gauge pullback strength by combining the power of RSI and moving averages with a depth-weighted calculation. The script was created by me, Nathan Farmer and is based on a multi-step process to determine trend strength and direction, adjusted by a "depth" factor for more accurate signal analysis.
How It Works
Trend Definition Using RSI: The RSI Moving Average ( rsiMa ) is calculated to assess the current trend, using customizable parameters for the RSI Period and MA Period .
Trends are defined as follows:
Uptrend : RSI MA > Critical RSI Value
Downtrend : RSI MA < Critical RSI Value
Pullback Depth Calculation: To measure pullback strength relative to the current trend, the indicator calculates a Depth Percentage . This is defined as the portion of the gap between the moving average and the price covered by a pullback.
Depth-Weighted RSI Calculation: The Depth Percentage is then applied as a weighting factor on the RSI Moving Average , giving us a Weighted RSI line that adjusts to the depth of pullbacks. This line is rather noisy, and as such we take a moving average to smooth out some of the noise.
Key Parameters
RSI Period : The period for RSI calculation.
MA Period : The moving average period applied to RSI.
Price MA Period : Determines the SMA period for price, used to calculate pullback depth.
Smoothing Length : Length of smoothing applied to the weighted RSI, creating a more stable signal.
RSI Critical Value : The critical value (level) used in determining whether we're in an uptrend or a downtrend.
Depth Critical Value : The critical value (level) used in determining whether or not the depth weighted value confirms the state of a trend.
Notes:
As always, backtest this indicator and modify the parameters as needed for your specific asset, over your specific timeframe. I chose these defaults as they worked well on the assets I look at, but it is likely you tend to look at a different group of assets over a different timeframe than what I do.
Large pullbacks can create large downward spikes in the weighted line. This isn't graphically pleasing, but I have tested it with various methods of normalization and smoothing and found the simple smoothing used in the indicator to be best despite this.
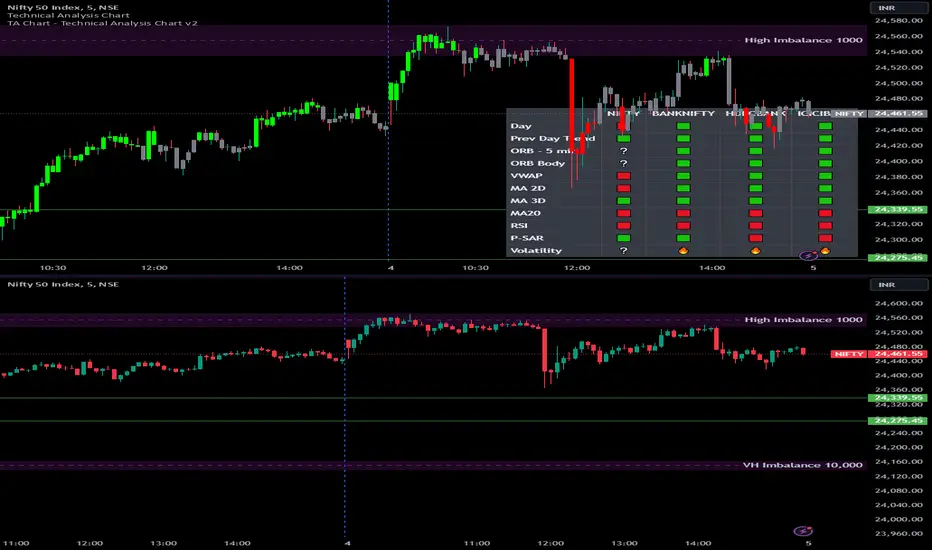
Options Series - Technical Analysis Chart➤ Simple Technical Chart Only:
➤ With MA-20 Overlay and Volatility background bars:
➤ With RSI Candles:
⭐ Overview and How It Works:
This script provides a multi-asset analysis tool to assess various market conditions across four symbols simultaneously. It combines several indicators such as daily price change, Moving Averages (MA), Bollinger Bands (BB), Parabolic SAR, RSI, and VWAP to generate buy/sell signals and trend indicators. Its strength lies in the layered use of indicators to enhance signal reliability, making it valuable for traders needing cross-validation in decision-making.
⭐ Key Features and Functionality:
The script evaluates each symbol's price against various indicators and conditions:
Daily Price Conditions: It checks if each symbol’s close price is above or below the previous day’s open, close, and intra-day ranges, forming a foundational bullish/bearish condition.
Range Breakout 1st 5min Candle (ORB): Opening Range Breakout levels are calculated and compared with current close prices, detecting breakout/breakdown conditions.
ORB Body: This basically calculates the previous day Daily candle body size, if todays Daily candle body size is greater than previous day, then we can say that we are having good momentum else its likely to be in-sidebar trading.
Moving Averages (MA): It leverages EMA-20, 2-day, and 3-day exponential moving averages to gauge short to medium-term trends.
RSI and VWAP: Relative Strength Index (RSI) determines overbought or oversold conditions, while VWAP compares prices to volume-weighted levels.
Bollinger Bands and Trend Analysis: Detects volatility and potential breakout conditions.
Concept of ORB Body:
Current_PrevDay_Body = (math.max(var_Current_PrevD_Open, var_Current_PrevD_Close) - math.min(var_Current_PrevD_Open, var_Current_PrevD_Close))
Current_Upper_ORB = var_Current_D_Open + Current_PrevDay_Body
Current_Lower_ORB = var_Current_D_Open - Current_PrevDay_Body
Current_TodayDay_Body = math.max(var_Current_D_Open, var_Current_Close) - math.min(var_Current_D_Open, var_Current_Close)
Current_ORBBody = Current_TodayDay_Body > Current_PrevDay_Body
Current_Upper_ORB_bull = (var_Current_Close > Current_Upper_ORB)
Current_Lower_ORB_bear = (var_Current_Close < Current_Lower_ORB)
🎨 Visualizations and User Experience:
The script can dynamically display colored backgrounds indicating trends when conditions are met. For example, the bgcolor function changes the background when certain trend-based criteria are satisfied, offering visual cues to users. Additionally, the checkbox input toggles trend bar visualizations, enhancing user experience by providing a quick visual reference without needing to interpret individual data points manually.
RSI-Based Candle Coloring:
➤ The script customizes candle colors based on RSI thresholds, specifically defining upper (60) and lower (40) RSI levels. When the RSI value exceeds the upper threshold, candles are colored as bullish (green), and if it falls below the lower threshold, candles are colored as bearish (red). Neutral RSI values result in a default color (gray).
➤ This setup offers a visually intuitive way to identify potential trend directions based on RSI levels, making it ideal for traders looking to gauge momentum visually.
⭐ Settings and Customization:
With multiple user-configurable inputs, the script allows for tailored analysis. Customizable parameters, such as enabling/disabling trend bars and setting various look-back periods for indicators like Bollinger Bands and Moving Averages, make it adaptable to various trading styles and preferences. It also allows users to modify visual elements like colors and styles, improving flexibility.
⭐ Uniqueness of the Concept:
The unique aspect of this script is its multi-symbol approach combined with complex conditions. By comparing not only one but four symbols simultaneously, it provides a broader market view and allows traders to correlate signals across different assets, offering a potential edge for diversified or comparative strategies. Additionally, the incorporation of ORB and multi-timeframe MAs gives it a robustness often lacking in simpler single-symbol scripts.
🚀 Conclusion:
This script is a powerful multi-indicator tool suited for traders looking for a comparative, multi-symbol analysis. With features like ORB, Bollinger Band-based trend detection, and MA cross-verification, it can assist traders in identifying and validating trend signals across assets. The user-friendly visualizations and customizable settings further enhance its usability, making it versatile for various trading strategies and preferences.
ATR Adjusted RSIATR Adjusted RSI Indicator
By Nathan Farmer
The ATR Adjusted RSI Indicator is a versatile indicator designed primarily for trend-following strategies, while also offering configurations for overbought/oversold (OB/OS) signals, making it suitable for mean-reversion setups. This tool combines the classic Relative Strength Index (RSI) with a unique Average True Range (ATR)-based smoothing mechanism, allowing traders to adjust their RSI signals according to market volatility for more reliable entries and exits.
Key Features:
ATR Weighted RSI:
At the core of this indicator is the ATR-adjusted RSI line, where the RSI is smoothed based on volatility (measured by the ATR). When volatility increases, the smoothing effect intensifies, resulting in a more stable and reliable RSI reading. This makes the indicator more responsive to market conditions, which is especially useful in trend-following systems.
Multiple Signal Types:
This indicator offers a variety of signal-generation methods, adaptable to different market environments and trading preferences:
RSI MA Crossovers: Generates signals when the RSI crosses above or below its moving average, with the flexibility to choose between different moving average types (SMA, EMA, WMA, etc.).
Midline Crossovers: Provides trend confirmation when either the RSI or its moving average crosses the 50 midline, signaling potential trend reversals.
ATR-Inversely Weighted RSI Variations: Uses the smoothed, ATR-adjusted RSI for a more refined and responsive trend-following signal. There are variations both for the MA crossover and the midline crossover.
Overbought/Oversold Conditions: Ideal for mean reversion setups, where signals are triggered when the RSI or its moving average crosses over overbought or oversold levels.
Flexible Customization:
With a wide range of customizable options, you can tailor the indicator to fit your personal trading style. Choose from various moving average types for the RSI, modify the ATR smoothing length, and adjust overbought/oversold levels to optimize your signals.
Usage:
While this indicator is primarily designed for trend-following, its OB/OS configurations make it highly effective for mean-reverting setups as well. Depending on your selected signal type, the relevant indicator line will change color between green and red to visually signal long or short opportunities. This flexibility allows traders to switch between trending and sideways market strategies seamlessly.
A Versatile Tool:
The ATR Adjusted RSI Indicator is a valuable component of any trading system, offering enhanced signals that adapt to market volatility. However, it is not recommended to rely on this indicator alone, especially without thorough backtesting. Its performance varies across different assets and timeframes, so it’s essential to experiment with the parameters to ensure consistent results before applying it in live trading.
Recommendation:
Before incorporating this indicator into live trading, backtest it extensively. Given its flexibility and wide range of signal-generation methods, backtesting allows you to optimize the settings for your preferred assets and timeframes. Only consider using it on it's own if you are confident in its performance based on your own backtest results, and even then, it is not recommended.

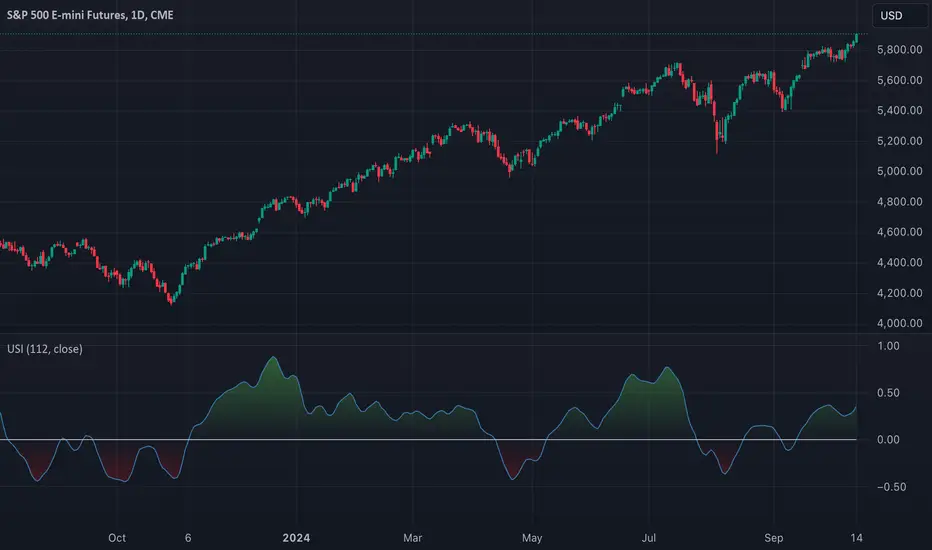
TASC 2024.11 Ultimate Strength Index█ OVERVIEW
This script implements the Ultimate Strength Index (USI) indicator, introduced by John Ehlers in his article titled "Ultimate Strength Index (USI)" from the November 2024 edition of TASC's Traders' Tips . The USI is a modified version of Wilder's original Relative Strength Index (RSI) that incorporates Ehlers' UltimateSmoother lowpass filter to produce an output with significantly reduced lag.
█ CONCEPTS
Many technical indicators, including the RSI, lag due to their heavy reliance on historical data. John Ehlers reformulated the RSI to substantially reduce lag by applying his UltimateSmoother filter to upward movements ( strength up - SU ) and downward movements ( strength down - SD ) in the time series, replacing the standard process of smoothing changes with rolling moving averages (RMAs). Ehlers' recent works, covered in our recent script publications, have shown that the UltimateSmoother is an effective alternative to other classic averages, offering notably less lag in its response.
Ehlers also modified the RSI formula to produce an index that ranges from -1 to +1 instead of 0 to 100. As a result, the USI indicates bullish conditions when its value moves above 0 and bearish conditions when it falls below 0.
The USI retains many of the strengths of the traditional RSI while offering the advantage of reduced lag. It generally uses a larger lookback window than the conventional RSI to achieve similar behavior, making it suitable for trend trading with longer data lengths. When applied with shorter lengths, the USI's peaks and valleys tend to align closely with significant turning points in the time series, making it a potentially helpful tool for timing swing trades.
█ CALCULATIONS
The first step in the USI's calculation is determining each bar's strength up (SU) and strength down (SD) values. If the current bar's close exceeds the previous bar's, the calculation assigns the difference to SU. Otherwise, SU is zero. Likewise, if the current bar's close is below the previous bar's, it assigns the difference to SD. Otherwise, SD is zero.
Next, instead of the RSI's typical smoothing process, the USI's calculation applies the UltimateSmoother to the short-term average SU and SD values, reducing high-frequency chop in the series with low lag.
Finally, this formula determines the USI value:
USI = ( Ult (SU) − Ult (SD)) / ( Ult (SU) + Ult (SD)),
where Ult (SU) and Ult (SD) are the smoothed average strength up and strength down values.
RSI (Kernel Optimized) | Flux Charts💎 GENERAL OVERVIEW
Introducing our new KDE Optimized RSI Indicator! This indicator adds a new aspect to the well-known RSI indicator, with the help of the KDE (Kernel Density Estimation) algorithm, estimates the probability of a candlestick will be a pivot or not. For more information about the process, please check the "HOW DOES IT WORK ?" section.
Features of the new KDE Optimized RSI Indicator :
A New Approach To Pivot Detection
Customizable KDE Algorithm
Realtime RSI & KDE Dashboard
Alerts For Possible Pivots
Customizable Visuals
❓ HOW TO INTERPRET THE KDE %
The KDE % is a critical metric that reflects how closely the current RSI aligns with the KDE (Kernel Density Estimation) array. In simple terms, it represents the likelihood that the current candlestick is forming a pivot point based on historical data patterns. a low percentage suggests a lower probability of the current candlestick being a pivot point. In these cases, price action is less likely to reverse, and existing trends may continue. At moderate levels, the possibility of a pivot increases, indicating potential trend shifts or consolidations.Traders should start monitoring closely for confirmation signals. An even higher KDE % suggests a strong likelihood that the current candlestick could form a pivot point, which could lead to a reversal or significant price movement. These points often align with overbought or oversold conditions in traditional RSI analysis, making them key moments for potential trade entry or exit.
📌 HOW DOES IT WORK ?
The RSI (Relative Strength Index) is a widely used oscillator among traders. It outputs a value between 0 - 100 and gives a glimpse about the current momentum of the price action. This indicator then calculates the RSI for each candlesticks, and saves them into an array if the candlestick is a pivot. The low & high pivot RSIs' are inserted into two different arrays. Then the a KDE array is calculated for both of the low & high pivot RSI arrays. Explaining the KDE might be too much for this write-up, but for a brief explanation, here are the steps :
1. Define the necessary options for the KDE function. These are : Bandwidth & Nº Steps, Array Range (Array Max - Array Min)
2. After that, create a density range array. The array has (steps * 2 - 1) elements and they are calculated by (arrMin + i * stepCount), i being the index.
3. Then, define a kernel function. This indicator has 3 different kernel distribution modes : Uniform, Gaussian and Sigmoid
4. Then, define a temporary value for the current element of KDE array.
5. For each element E in the pivot RSI array, add "kernel(densityRange.get(i) - E, 1.0 / bandwidth)" to the temporary value.
6. Add 1.0 / arrSize * to the KDE array.
Then the prefix sum array of the KDE array is calculated. For each candlestick, the index closest to it's RSI value in the KDE array is found using binary search. Then for the low pivot KDE calculation, the sum of KDE values from found index to max index is calculated. For the high pivot KDE, the sum of 0 to found index is used. Then if high or low KDE value is greater than the activation threshold determined in the settings, a bearish or bullish arrow is plotted after bar confirmation respectively. The arrows are drawn as long as the KDE value of current candlestick is greater than the threshold. When the KDE value is out of the threshold, a less transparent arrow is drawn, indicating a possible pivot point.
🚩 UNIQUENESS
This indicator combines RSI & KDE Algorithm to get a foresight of possible pivot points. Pivot points are important entry, confirmation and exit points for traders. But to their nature, they can be only detected after more candlesticks are rendered after them. The purpose of this indicator is to alert the traders of possible pivot points using KDE algorithm right away when they are confirmed. The indicator also has a dashboard for realtime view of the current RSI & Bullish or Bearish KDE value. You can fully customize the KDE algorithm and set up alerts for pivot detection.
⚙️ SETTINGS
1. RSI Settings
RSI Length -> The amount of bars taken into account for RSI calculation.
Source -> The source value for RSI calculation.
2. Pivots
Pivot Lengths -> Pivot lengths for both high & low pivots. For example, if this value is set to 21; 21 bars before AND 21 bars after a candlestick must be higher for a candlestick to be a low pivot.
3. KDE
Activation Threshold -> This setting determines the amount of arrows shown. Higher options will result in more arrows being rendered.
Kernel -> The kernel function as explained in the upper section.
Bandwidth -> The bandwidth variable as explained in the upper section. The smoothness of the KDE function is tied to this setting.
Nº Bins -> The Nº Steps variable as explained in the upper section. It determines the precision of the KDE algorithm.

Color Coded RSI [Phantom]Color Coded RSI
The Color Coded RSI enhances the standard RSI (Relative Strength Index) by applying dynamic color coding to the price bars, making it easier to visualize RSI levels directly on the chart.
Key Feature:
RSI-Based Color Coding: Price bars change color based on RSI values. High RSI values (above 70) show warm colors (red/orange), signaling potential overbought conditions, while low RSI values (below 30) display cool colors (blue), indicating possible oversold levels.
How to Trade with Color Coded RSI:
Overbought (Red/Orange Bars):
When the bars turn red or orange (RSI above 70), the market might be overbought. This could be a signal to sell or exit long positions, expecting a pullback.
Oversold (Blue Bars):
Blue bars (RSI below 30) suggest the market is oversold. Look for buying opportunities or consider exiting short positions, anticipating a rebound.
Neutral (Gray/Green Bars):
Gray or green bars (RSI near 50) indicate neutral conditions. You may want to wait for a clearer trend before taking action.
RSI is best used with other indicators to provide confirmations.

HMA Smoothed RSI [Pinescriptlabs]This indicator uses a modified version of the RSI (Relative Strength Index) weighted by volume. This means it not only takes into account the price but also the amount of volume supporting those price movements, making the indicator more sensitive to real market fluctuations.
Hull Moving Average (HMA) Applied to RSI: To smooth the volume-weighted RSI, a Hull Moving Average (HMA) is applied. The HMA is known for its ability to reduce market "noise" and quickly react to trend changes. This process helps better identify when an asset is overbought or oversold.
Overbought and Oversold Regions: The indicator sets clear overbought and oversold levels, which are adjustable. By default, the overbought level is set at 20 and the oversold level at -20, but you can customize these values. Additionally, there are extreme overbought and oversold levels to help identify more extreme market conditions where a price reversal is more likely.
Buy and Sell Signals:
Buy Signal: This is generated when the modified RSI crosses above the oversold level. This indicates that the price has dropped enough and may be about to rise.
Sell Signal: This occurs when the RSI crosses below the overbought level. This suggests that the price has risen too much and could be about to fall.
Dynamic Visualization and Colors: The indicator is displayed with different colors based on its behavior:
When the RSI is within normal levels, the color is neutral.
If it is above the overbought level, the color turns red (sell alert).
If it is below the oversold level, the color turns green (buy alert).
Alerts: This indicator also allows you to set up alerts. You will receive automatic notifications when buy or sell signals are generated, helping you make decisions without constantly monitoring the chart.
Español:
Este indicador utiliza una versión modificada del RSI (Índice de Fuerza Relativa), ponderado por volumen. Esto significa que no solo tiene en cuenta el precio, sino también la cantidad de volumen que respalda esos movimientos de precios, haciendo que el indicador sea más sensible a las fluctuaciones reales del mercado.
Media Móvil Hull (HMA) aplicada al RSI: Para suavizar el RSI ponderado por volumen, se le aplica una Media Móvil Hull (HMA). La HMA es conocida por su capacidad para reducir el "ruido" del mercado y reaccionar rápidamente a los cambios de tendencia. Este proceso ayuda a identificar mejor cuándo un activo está sobrecomprado o sobrevendido.
Regiones de sobrecompra y sobreventa: El indicador establece niveles claros de sobrecompra y sobreventa que son ajustables. Por defecto, el nivel de sobrecompra está en 20 y el de sobreventa en -20, pero puedes personalizar estos valores. Además, hay niveles extremos de sobrecompra y sobreventa que te ayudan a identificar condiciones más extremas del mercado, donde una reversión de precio es más probable.
Señales de compra y venta:
Señal de compra: Se genera cuando el RSI modificado cruza hacia arriba el nivel de sobreventa. Esto indica que el precio ha bajado lo suficiente y puede estar a punto de subir.
Señal de venta: Se produce cuando el RSI cruza hacia abajo el nivel de sobrecompra. Esto indica que el precio ha subido demasiado y podría estar a punto de bajar.
Visualización y colores dinámicos: El indicador se muestra con diferentes colores según su comportamiento:
Cuando el RSI está dentro de los niveles normales, el color es neutro.
Si está por encima del nivel de sobrecompra, el color se vuelve rojo (señal de alerta de venta).
Si está por debajo del nivel de sobreventa, el color se vuelve verde (señal de alerta de compra).
Alertas: Este indicador también te permite configurar alertas. Así, recibirás notificaciones automáticas cuando se generen señales de compra o venta, ayudándote a tomar decisiones sin estar constantemente monitoreando el gráfico.

Pulse Oscillator [UAlgo]The "Pulse Oscillator " is a trading tool designed to capture market momentum and trend changes by combining the strengths of multiple well-known technical indicators. By integrating the RSI (Relative Strength Index), CCI (Commodity Channel Index), and Stochastic Oscillator, this indicator provides traders with a comprehensive view of market conditions, offering both trend filtering and precise buy/sell signals. The oscillator is customizable, allowing users to fine-tune its parameters to match different trading strategies and timeframes. With its built-in smoothing techniques and level adjustments, the Pulse Oscillator aims to be a reliable tool for both trend-following and counter-trend trading strategies.
🔶 Key Features
Multi-Indicator Integration: Combines RSI, CCI, and Stochastic Oscillator to create a weighted momentum oscillator.
Why Use Multi-Indicator Integration?
Script uses Multi-Indicator Integration to combine the strengths of different technical indicators—such as RSI, CCI, and Stochastic Oscillator—into a single tool. This approach helps to reduce the weaknesses of individual indicators, providing a more comprehensive and reliable analysis of market conditions. By integrating multiple indicators, we can generate more accurate signals, filter out noise, and enhance our trading decisions.
Customizable Parameters: Allows users to adjust weights, periods, and smoothing techniques, providing flexibility to adapt the indicator to various market conditions.
Trend Filtering Option: An optional trend filter is available to enhance the accuracy of buy and sell signals, reducing the risk of false signals in choppy markets.
Dynamic Levels: The indicator dynamically calculates multiple levels of support and resistance, adjusting to market conditions with customizable decay factors and offsets.
Visual Clarity: The indicator visually represents different levels and trends with color-coded plots and fills, making it easier for traders to interpret market conditions at a glance.
Alerts: Configurable alerts for buy and sell signals, as well as trend changes, enabling traders to stay informed of key market movements without constant monitoring.
🔶 Interpreting the Indicator
Buy Signal: A buy signal is generated when the Slow Line crosses under the Fast Line during an uptrend or when the trend filter is disabled. This indicates a potential bullish reversal or continuation of an upward trend.
Sell Signal: A sell signal occurs when the Slow Line crosses above the Fast Line during a downtrend or when the trend filter is disabled, signaling a potential bearish reversal or continuation of a downward trend.
Trend Change: The indicator detects trend changes when the Fast Line shifts from increasing to decreasing or vice versa, providing early warning of possible market reversals.
Dynamic Levels: The indicator calculates upper and lower levels based on the Fast Line's values. These levels can be used to identify overbought or oversold conditions and potential areas of support or resistance.
🔶 Disclaimer
Use with Caution: This indicator is provided for educational and informational purposes only and should not be considered as financial advice. Users should exercise caution and perform their own analysis before making trading decisions based on the indicator's signals.
Not Financial Advice: The information provided by this indicator does not constitute financial advice, and the creator (UAlgo) shall not be held responsible for any trading losses incurred as a result of using this indicator.
Backtesting Recommended: Traders are encouraged to backtest the indicator thoroughly on historical data before using it in live trading to assess its performance and suitability for their trading strategies.
Risk Management: Trading involves inherent risks, and users should implement proper risk management strategies, including but not limited to stop-loss orders and position sizing, to mitigate potential losses.
No Guarantees: The accuracy and reliability of the indicator's signals cannot be guaranteed, as they are based on historical price data and past performance may not be indicative of future results.

RSI Divergence and GradientThe RSI Divergence and Gradient Indicator simplifies the process of identifying the relationship between price action and the Relative Strength Index (RSI). By integrating RSI data directly into the price chart, traders no longer need to open a separate pane to monitor RSI or manually compare price action and RSI.
This indicator allows traders to easily spot overbought or oversold conditions and detect divergences between price and RSI. These signals can help identify potential reversal points and more effectively assess trend strength.
Features
RSI Divergences: The script identifies and plots bullish and bearish RSI divergences, which can signal potential reversals. Bullish divergences are indicated by an upward triangle below the price bars, while bearish divergences are indicated by a downward triangle above the price bars.
Overbought/Oversold Gradient: The script uses a color gradient to highlight overbought and oversold conditions on the chart, helping traders visualize momentum and trend strength. The gradient dynamically adjusts based on RSI values, transitioning through different colors to represent the intensity of overbought or oversold conditions.
Customizable Gradient: The gradient is customizable, allowing traders to set their own thresholds for overbought and oversold levels, and to choose the colors that best suit their trading style. This flexibility ensures the indicator can be tailored to individual preferences.
How It Works
RSI Calculation: The indicator calculates RSI using the standard 14-period length by default, but this can be adjusted to suit the trader's needs.
Divergence Detection: The script identifies divergences by comparing the highest and lowest points of the RSI with the corresponding price levels over the RSI period length. When a divergence is detected, it is plotted on the chart to indicate a potential reversal.
Gradient Coloring: The gradient coloring system changes the bar colors based on RSI levels. The color transitions from a neutral tone to specified start and end colors as RSI approaches overbought or oversold thresholds, providing a visual cue for potential overextended market conditions.
Intended Use
This indicator is particularly useful for traders who want to combine momentum analysis with divergence signals to identify potential reversal points or confirm trend strength. The visual gradient aids in quickly assessing market conditions, making it easier to spot high-probability trading opportunities.

Trend and RSI Bias FusionTrend and RSI Bias Fusion Indicator
This is my first ever indicator. I created this indicator for myself. I was inspired by the indicators created by Bjorgum, Duyck and QuantTherapy and decided to create multiple indicators that either work well combined with their indicators or something new that applies some of their indicator concepts. I decided to share this because I believe in learning and earing together as a community. I will later share the rest of the indicators I have created. This is my first time ever sharing any indicator so if you guys have any questions or suggestions write them.
Overview
The "Trend and RSI Bias Fusion" indicator is a versatile tool designed to help traders identify key market trends, potential reversals, momentum shifts, and RSI-based pullbacks. This indicator fuses trend analysis and RSI bias into a single, comprehensive visual, making it easier to make informed trading decisions across various timeframes and market conditions.
Features
Dual Timeframe Analysis: Combines trend analysis on a higher timeframe (e.g., Daily) with RSI analysis on a lower timeframe (e.g., 4-Hour), providing a more granular view of market conditions. You can, however, choose any timeframe you want for instance 12hr with trend and 2hr RSI analysis.
Trend and Momentum Visualization: The indicator uses Exponential Moving Averages (EMAs) to determine trend direction and colors the chart background to reflect bullish or bearish trends, along with momentum strength.
RSI Bias Detection: Automatically identifies overbought and oversold conditions using the RSI, providing a clear indication of potential market reversals or continuations.
Color-Coded Bars: Optionally color codes bars based on either trend direction or RSI bias, giving you a quick visual cue of the market's state.
Reversal Markers: Displays trend reversal markers on the chart when the short-term EMA crosses over or under the long-term EMA.
Calculation Details
Exponential Moving Averages (EMAs): The indicator calculates short-term and long-term EMAs using the closing prices.
The crossover between these EMAs is used to determine the trend direction:
Short-Term EMA: Typically a 14-period EMA.
Long-Term EMA: Typically a 50-period EMA.
Momentum: Calculated using the RSI and then centered around zero by subtracting 50. This allows the indicator to distinguish between positive and negative momentum.
RSI Bias: The RSI is calculated on a lower timeframe to detect overbought (above 60) and oversold (below 40) conditions, which are used to determine the bias:
RSI Above 60: Indicates potential overbought conditions (bearish bias).
RSI Below 40: Indicates potential oversold conditions (bullish bias).
How to Use the Indicator
Select Your Timeframes: Choose your preferred trend timeframe (e.g., Daily) and RSI timeframe (e.g., 4-2 Hour) in the indicator settings. These should match your trading strategy and the asset class you're analyzing.
Interpret Trend and Momentum
Background Color: The background color reflects the current trend direction:
Green/Lime: Uptrend, with lime indicating positive momentum.
Red/Maroon: Downtrend, with maroon indicating positive momentum within a downtrend.
Momentum Histogram: The histogram plot shows momentum, color-coded by the trend. A histogram above zero with green/lime indicates bullish momentum, while below zero with red/maroon indicates bearish momentum.
Image above: Both RSI and Trend are set to daily, uses RSI bar color
Read RSI Bias:
The RSI bias line helps identify the current market state relative to overbought or oversold levels. The RSI value is plotted on the chart, with lines at 60 and 40 to mark these levels.
When the RSI crosses above 60, it suggests a bearish bias; crossing below 40 suggests a bullish bias.
Use Reversal Markers: The indicator places small circles on the chart at points where the short-term EMA crosses the long-term EMA, signaling potential trend reversals.
Bar Color Customization:
You can choose to color the bars based on either the trend or the RSI bias in the indicator settings. In the Images below I have changed the colors to fit my personal style , Blue for uptrend and Pink for downtrend:
Trend-Based: Bars will reflect the trend direction (green for uptrend or in this case blue, red for downtrend or in this case pink).
RSI-Based: Bars will reflect RSI conditions (yellow for overbought, maroon for oversold).
Image above: RSI is set to 4hr and Trend is set to daily, uses RSI bar color
Image above: RSI is set to 4hr and Trend is set to daily, uses Trend bar color
Image above: Both RSI and Trend are set to daily, uses RSI bar color
Image above: Both RSI and Trend are set to daily, uses Trend bar color
Image above: Both RSI and Trend are set to daily, without bar color
Image above: Both RSI and Trend are set to daily, how it looks on a clean chart
Example Use Case Swing Traders:
For instance, if you're trading a 4-hour chart of USDCHF:
Set the trend timeframe to Daily and the RSI timeframe to 4-Hour.
Watch for background color shifts and reversal markers to determine trend direction.
Use RSI bias to time your entries and exits, especially around overbought/oversold levels.
Enable bar coloring to quickly see when conditions favor either trend continuation or reversal.
This indicator is particularly effective for swing traders and those who want to align their trades with higher timeframe trends while using momentum and RSI for entry and exit signals.
For Day Traders
Timeframe Selection:
Trend Timeframe: Set to a higher intraday timeframe such as the 1 or 2 Hour chart.
RSI Timeframe: Set to a shorter timeframe like 15-10 Minutes or 5-Minutes to capture finer details of intraday momentum shifts.
Using the Indicator:
Trend Identification: Day traders can use the background color to quickly identify whether the market is in a bullish or bearish trend on the 1-Hour chart. A green background suggests looking for long opportunities, while a red background suggests short opportunities.
Momentum Analysis: The histogram can help day traders gauge the strength of the current trend. For example, if the histogram is green and above zero, the trader may consider buying pullbacks within the trend.
RSI Bias: Monitor RSI levels on the lower timeframe (e.g., 15-Minutes). If the RSI crosses below 40, it indicates an oversold condition, potentially signaling a buying opportunity, especially if it aligns with a bullish trend on the higher timeframe.
Trade Execution:
Look for entries when the RSI shows a reversal or pullback in the direction of the higher timeframe trend.
Use the trend reversal markers to confirm potential intraday reversals, adding extra confidence to trade setups.
For Scalpers
Timeframe Selection:
Trend Timeframe: Set to a short intraday timeframe like 15-Minutes or 5-Minutes.
RSI Timeframe: Use an even shorter timeframe, such as 1-Minute, to capture rapid price movements.
Final Notes:
The "Trend and RSI Bias Fusion" indicator is a powerful tool that combines trend analysis, momentum assessment, and RSI insights into one cohesive package. By integrating these different aspects, the indicator helps traders navigate complex market environments with greater clarity and confidence. Customize the settings to fit your specific trading style and market and use it to stay ahead of market trends and potential reversals.
My Scripts/Indicators/Ideas /Systems that I share are only for educational purposes!

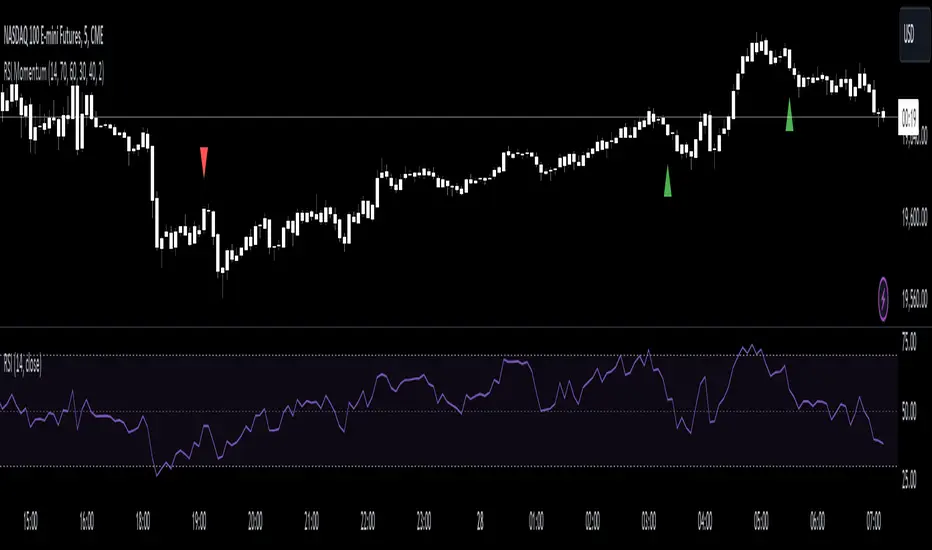
RSI Momentum [CrossTrade]The RSI Momentum indicator generates buy and sell signals based on the Relative Strength Index (RSI) crossing specific thresholds. The Key difference is that we're using RSI overbought and oversold readings as the foundation for finding continuation signals in the same direction of that momentum. This solves the issue of trying to buy the bottom or sell the top and offsets any oscillators main weakness, divergence and false signals in a strong trend.
Key Parameters:
RSI Length: Determines the calculation period for the RSI.
Overbought Threshold: The RSI level above which the asset is considered overbought.
Momentum Loss Threshold for Buy: The RSI level below which a loss in upward momentum is indicated, triggering a potential buy signal.
Oversold Threshold: The RSI level below which the asset is considered oversold.
Momentum Loss Threshold for Sell: The RSI level above which a loss in downward momentum is indicated, triggering a potential sell signal.
Allow Additional Retracement Signals: A toggle to allow more than one signal within a certain number of bars after the first signal.
Max Additional Signals: The maximum number of additional signals allowed after the first signal.
Buy Signal Logic:
Initial Signal: Generated when the RSI first exceeds the overbought threshold and then falls below the momentum loss buy threshold. Defaults are 70 for the overbought threshold and 60 for the retracement level.
Additional Signals for Deeper Retracements: If enabled, the script shows additional buy signals within the maximum limit set by Max Additional Signals. These additional signals are shown only if each new signal's bar has a lower low than the previous signal's bar.
Sell Signal Logic:
Initial Signal: Similar to the buy signal, a sell signal is generated when the RSI first drops below the oversold threshold and then rises above the momentum loss sell threshold. Defaults are 30 for the oversold threshold and 40 for the retracement level.
Additional Signals for Deeper Retracements: If enabled, additional sell signals are shown, limited by Max Additional Signals, and only if each new signal's bar has a higher high than the previous signal's bar.
Continuation Signals in Strong Trends:
The script allows for a new series of signals (starting with the first signal again) when the RSI pattern repeats. For buy signals, this means going above the overbought and then below the momentum loss buy threshold. For sell signals, it's dropping below oversold and then above the momentum loss sell threshold.
Alerts:
The script includes alert conditions for both buy and sell signals, which can be configured in the TradingView alerts.
Lockin Strength Indicator (LSI)How It Works:
RSI Calculation: The standard RSI is calculated using a 14-period by default.
Volume Weighting: If enabled, the LSI modifies the RSI by weighting it based on the volume relative to its moving average. This emphasizes periods of high or low volume, which can be particularly useful for Solana-based assets that might have unique volume profiles.
Plotting: The LSI is plotted with standard overbought and oversold levels, and background highlighting makes these areas visually distinct.
Customization:
RSI Length: You can adjust the length of the RSI period.
Overbought/Oversold Levels: You can modify the levels for overbought and oversold signals.
Volume Weighting: You can toggle volume weighting on or off.
This indicator is designed to give you a more nuanced view of Solana cryptocurrencies by combining RSI with volume dynamics.

TechniTrend RSI (11TF)Multi-Timeframe RSI Indicator
Overview
The Multi-Timeframe RSI Indicator is a sophisticated tool designed to provide comprehensive insights into the Relative Strength Index (RSI) across 11 different timeframes simultaneously. This indicator is essential for traders who wish to monitor RSI trends and their moving averages (MA) to make informed trading decisions.
Features
Multiple Timeframes: Displays RSI and RSI MA values for 11 different timeframes, allowing traders to have a holistic view of the market conditions.
RSI vs. MA Comparison: Indicates whether the RSI value is above or below its moving average for each timeframe, helping traders to identify bullish or bearish momentum.
Overbought/Oversold Signals:
Marks "OS" (OverSell) when RSI falls below 25, indicating a potential oversold condition.
Marks "OB" (OverBuy) when RSI exceeds 75, signaling a potential overbought condition.
Real-Time Updates: Continuously updates in real-time to provide the most current market information.
Usage
This indicator is invaluable for traders who utilize RSI as part of their technical analysis strategy. By monitoring multiple timeframes, traders can:
Identify key overbought and oversold levels to make entry and exit decisions.
Observe the momentum shifts indicated by RSI crossing above or below its moving average.
Enhance their trading strategy by integrating multi-timeframe analysis for better accuracy and confirmation.
How to Interpret the Indicator
RSI Above MA: Indicates a potential bullish trend. Traders may consider looking for long positions.
RSI Below MA: Suggests a potential bearish trend. Traders may look for short positions.
OS (OverSell): When RSI < 25, the market may be oversold, presenting potential buying opportunities.
OB (OverBuy): When RSI > 75, the market may be overbought, indicating potential selling opportunities.

Advanced Gold Scalping Strategy with RSI Divergence# Advanced Gold Scalping Strategy with RSI Divergence
## Overview
This Pine Script implements an advanced scalping strategy for gold (XAUUSD) trading, primarily designed for the 1-minute timeframe. The strategy utilizes the Relative Strength Index (RSI) indicator along with its moving average to identify potential trade setups based on divergences between price action and RSI movements.
## Key Components
### 1. RSI Calculation
- Uses a customizable RSI length (default: 60)
- Allows selection of the source for RSI calculation (default: close price)
### 2. Moving Average of RSI
- Supports multiple MA types: SMA, EMA, SMMA (RMA), WMA, VWMA, and Bollinger Bands
- Customizable MA length (default: 3)
- Option to display Bollinger Bands with adjustable standard deviation multiplier
### 3. Divergence Detection
- Implements both bullish and bearish divergence identification
- Uses pivot high and pivot low points to detect divergences
- Allows for customization of lookback periods and range for divergence detection
### 4. Entry Conditions
- Long Entry: Bullish divergence when RSI is below 40
- Short Entry: Bearish divergence when RSI is above 60
### 5. Trade Management
- Stop Loss: Customizable, default set to 11 pips
- Take Profit: Customizable, default set to 33 pips
### 6. Visualization
- Plots RSI line and its moving average
- Displays horizontal lines at 30, 50, and 70 RSI levels
- Shows Bollinger Bands when selected
- Highlights divergences with "Bull" and "Bear" labels on the chart
## Input Parameters
- RSI Length: Adjusts the period for RSI calculation
- RSI Source: Selects the price source for RSI (close, open, high, low, hl2, hlc3, ohlc4)
- MA Type: Chooses the type of moving average applied to RSI
- MA Length: Sets the period for the moving average
- BB StdDev: Adjusts the standard deviation multiplier for Bollinger Bands
- Show Divergence: Toggles the display of divergence labels
- Stop Loss: Sets the stop loss distance in pips
- Take Profit: Sets the take profit distance in pips
## Strategy Logic
1. **RSI Calculation**:
- Computes RSI using the specified length and source
- Calculates the chosen type of moving average on the RSI
2. **Divergence Detection**:
- Identifies pivot points in both price and RSI
- Checks for higher lows in RSI with lower lows in price (bullish divergence)
- Checks for lower highs in RSI with higher highs in price (bearish divergence)
3. **Trade Entry**:
- Enters a long position when a bullish divergence is detected and RSI is below 40
- Enters a short position when a bearish divergence is detected and RSI is above 60
4. **Position Management**:
- Places a stop loss order at the entry price ± stop loss pips (depending on the direction)
- Sets a take profit order at the entry price ± take profit pips (depending on the direction)
5. **Visualization**:
- Plots the RSI and its moving average
- Draws horizontal lines for overbought/oversold levels
- Displays Bollinger Bands if selected
- Shows divergence labels on the chart for identified setups
## Usage Instructions
1. Apply the script to a 1-minute XAUUSD (Gold) chart in TradingView
2. Adjust the input parameters as needed:
- Increase RSI Length for less frequent but potentially more reliable signals
- Modify MA Type and Length to change the sensitivity of the RSI moving average
- Adjust Stop Loss and Take Profit levels based on current market volatility
3. Monitor the chart for Bull (long) and Bear (short) labels indicating potential trade setups
4. Use in conjunction with other analysis and risk management techniques
## Considerations
- This strategy is designed for short-term scalping and may not be suitable for all market conditions
- Always backtest and forward test the strategy before using it with real capital
- The effectiveness of divergence-based strategies can vary depending on market trends and volatility
- Consider using additional confirmation signals or filters to improve the strategy's performance
Remember to adapt the strategy parameters to your risk tolerance and trading style, and always practice proper risk management.

Enhanced Reversal DetectionScript Description:
The "Enhanced Reversal Detection" indicator is a powerful tool designed to identify potential market reversals across various financial instruments. It incorporates a sophisticated algorithm that analyzes price action along with key technical indicators such as the Relative Strength Index (RSI), Bollinger Bands, and Moving Average (MA).
How to Use:
Adjustable Parameters: The indicator offers a range of adjustable parameters to cater to different trading preferences and market conditions.
RSI Length: Adjusts the length of the RSI calculation to fine-tune sensitivity.
Overbought Level: Sets the threshold for identifying overbought conditions on the RSI scale.
Oversold Level: Sets the threshold for identifying oversold conditions on the RSI scale.
Bollinger Bands Length: Determines the length of the Bollinger Bands calculation.
Bollinger Bands Multiplier: Adjusts the standard deviation multiplier for the Bollinger Bands, influencing band width.
Moving Average Length: Defines the length of the Moving Average calculation to capture trend direction.
Min Bars Between Signals: Sets the minimum number of bars required between consecutive reversal signals.
ADX Length: Adjusts the length of the Average Directional Index (ADX) calculation.
ADX Threshold: Defines the threshold value for ADX, serving as a filter for reversal signals.
Signal Generation: The indicator generates signals for both bullish and bearish reversals based on predefined criteria. A bullish reversal signal is triggered when the closing price exceeds the lower Bollinger Band and RSI falls below the oversold threshold. Conversely, a bearish reversal signal occurs when the closing price falls below the upper Bollinger Band and RSI surpasses the overbought threshold.
Alerts: Traders can opt to receive alerts for bullish and bearish reversal signals, enabling them to stay informed of potential trading opportunities even when away from the platform.
Publication Readiness:
To ensure readiness for publication in the TradingView public library, the script has been meticulously crafted and documented:
The code is extensively commented to provide clear explanations of parameters, calculations, and signal generation logic.
Best coding practices have been followed to enhance readability and maintainability.
Rigorous testing has been conducted to validate the accuracy and reliability of signal generation across various market conditions.
The script adheres to TradingView's guidelines and policies for script publication, ensuring compliance with platform standards and user expectations.
With its comprehensive features and user-friendly design, the "Enhanced Reversal Detection" indicator is poised to become a valuable asset for traders seeking to identify high-probability reversal opportunities in the financial markets.
