RSI Multi Symbol/Time Frame DetectorThis code is an implementation of the Relative Strength Index (RSI) indicator, which is a popular momentum indicator used in technical analysis. The RSI measures the strength of an asset's price action and provides information on whether the asset is overbought or oversold. The code also calculates a moving average of the RSI and allows the user to choose the type of moving average to be calculated (SMA, EMA, SMMA, WMA, or VWMA).
The user can select from different time frames (5, 15, 60, or 240), symbols (SP:SPX, OANDA:EURUSD, or OANDA:NZDUSD), RSI lengths, and moving average types and lengths.
The code starts by defining a function called "ma" for calculating different types of moving averages. This function takes as input the source data for the moving average calculation (the RSI), the length of the moving average, and the type of moving average. The function uses a switch statement to return the appropriate calculation based on the inputted moving average type.
Next, the code calculates the RSI and its moving average. The RSI is calculated using the well-known formula for the RSI, which involves calculating the average gains and losses over a specified period of time and then dividing the average gains by the average losses. The moving average is calculated using the "ma" function defined earlier.
Finally, the code allows the user to choose the symbol and time frame to be used in the RSI calculation, as well as the length of the RSI and the moving average, and the type of moving average. The user can choose from three symbols (SP:SPX, OANDA:EURUSD, OANDA:NZDUSD) and four time frames (5, 15, 60, and 240 minutes). The code then uses the "request.security" function to retrieve the RSI calculation for the selected symbol and time frame.
Note: This code is example for you to use multi timeframe/symbol in your indicator or Strategy , also prevent Repainting Calculation
在腳本中搜尋"Relative"

RSI Dashboard Monitor [Skiploss]RSI Dashboard Monitor is indicator for scanner Relative Strength Index ( RSI ) for 4 symbols and 10 Timeframe, detached from the main chart.
You can choose to display all 4 symbols or just 1 symbol, also can choose resolution (TF). Still, these 10 timeframes should be enough to use. Default is set to 14 but you can modify it from settings.
How it work??
RSI >= 75 : Fill color maximum overbought
RSI >= 65 : Fill color medium overbought
RSI >= 55 : Fill color minimum overbought
RSI >= 45 : Fill color minimum overbought
RSI >= 35 : Fill color medium overbought
RSI >= 25 : Fill color maximum overbought
** Values level and color style can modify it from settings

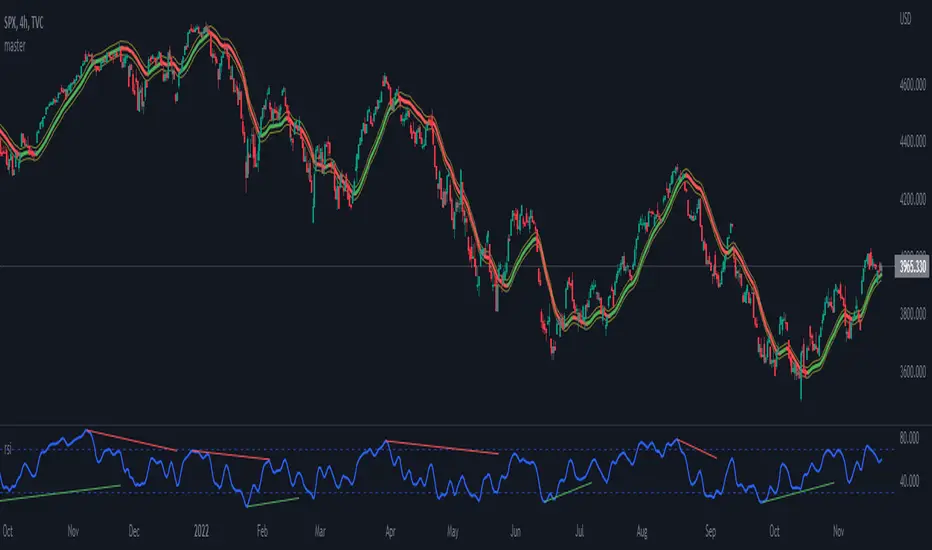
I11L - Meanreverter 4h---Overview---
The system buys fear and sells greed.
Its relies on a Relative Strength Index (RSI) and moving averages (MA) to find oversold and overbought states.
It seems to work best in market conditions where the Bond market has a negative Beta to Stocks.
Backtests in a longer Timeframe will clearly show this.
---Parameter---
Frequency: Smothens the RSI curve, helps to "remember" recent highs better.
RsiFrequency: A Frequency of 40 implies a RSI over the last 40 Bars.
BuyZoneDistance: Spacing between the different zones. A wider spacing reduces the amount of signals and icnreases the holding duration. Should be finetuned with tradingcosts in mind.
AvgDownATRSum: The multiple of the Average ATR over 20 Bars * amount of opentrades for your average down. I choose the ATR over a fixed percent loss to find more signals in low volatility environments and less in high volatility environments.
---Some of my thoughts---
Be very careful about the good backtesting performance in many US-Stocks because the System had a favourable environment since 1970.
Be careful about the survivorship bias as well.
52% of stocks from the S&P500 were removed since 2000.
I discount my Annual Results by 5% because of this fact.
You will find yourself quite often with very few signals because of the high market correlation.
My testing suggests that there is no expected total performance difference between a signal from a bad and a signal from a good market condition but a higher volatility.
I am sharing this strategy because i am currently not able to implement it as i want to and i think that meanreversion is starting to be taken more serious by traders.
The challange in implementing this strategy is that you need to be invested 100% of the time to retrieve the expected annual performance and to reduce the fat tail risk by market crashes.

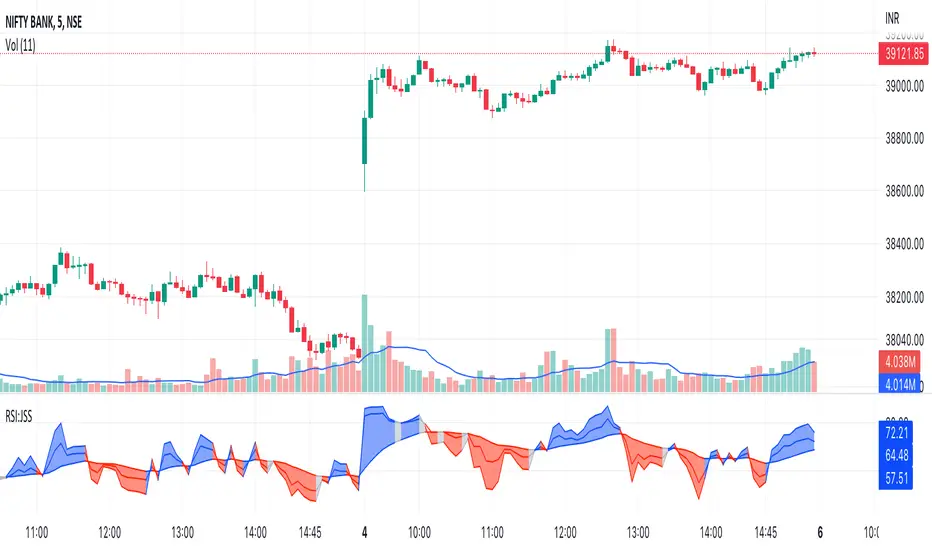
JSS:Relative Strength Index//Date: 5-Oct-22
//Author: Jatinder Sodhi
RSI Indicator with colour coding.
Blue - Long
Red - Short
Gray - Stay Out
Best used for Intraday on 5 minute charts. Works well on other timeframes as well.
@Inspired from Asit Baran's RankDelta-RSI Indicator.

smoothed_rsi
Description:
A well-known and vastly used momentum indicator, a Relative Strength Index (RSI) by J. Welles Wilder Jr., aims to evaluate the current price to its oversold/overbought area while giving an overview of bearish/bullish momentum. In this indicator, simply adding the super-smoother function (John F. Ehlers) was applied to the RSI line to create a more smoothed line and reduce its noise.
RSI:
RSI = 100 - 100/(1+RS)
RS = AvgUp/AvgDown
super_smoother(rsi)
Notes:
RSI > 70 indicates overbought
RSI < 30 indicates oversold
direction of the RSI line
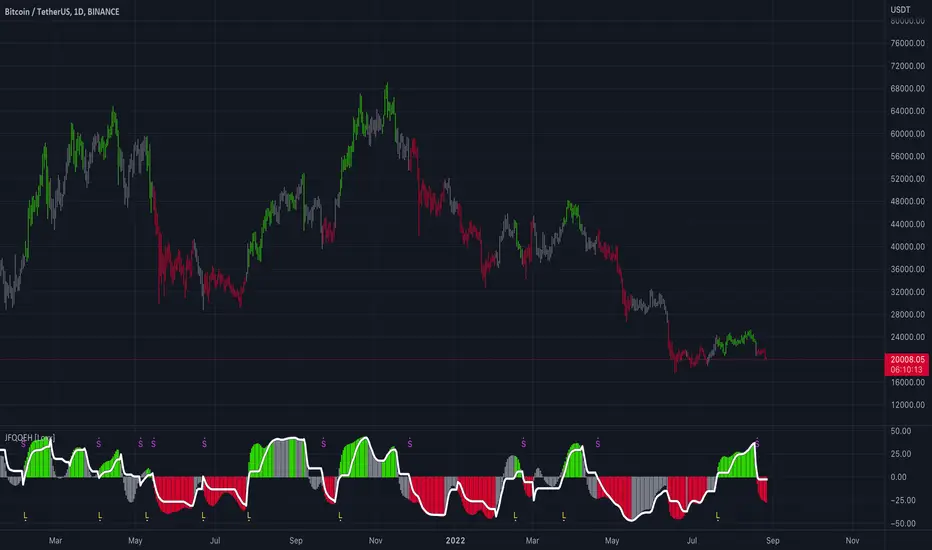
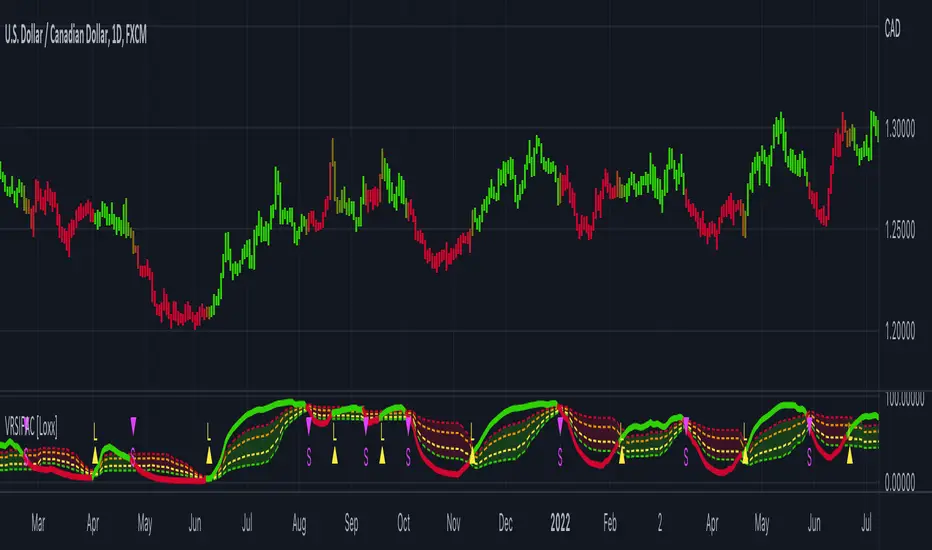
Juirk-Filtered QQE Histogram [Loxx]Juirk-Filtered QQE Histogram is a QQE indicator with 7 different RSI types, Jurik-Filtering with the option of double filtering. 2 types of signals, and Loxx's Expanded Source types. These additions are useful to filter out noise.
What is Qualitative Quantitative Estimation (QQE)?
The Qualitative Quantitative Estimation (QQE) indicator works like a smoother version of the popular Relative Strength Index ( RSI ) indicator. QQE expands on RSI by adding two volatility based trailing stop lines. These trailing stop lines are composed of a fast and a slow moving Average True Range (ATR).
There are many indicators for many purposes. Some of them are complex and some are comparatively easy to handle. The QQE indicator is a really useful analytical tool and one of the most accurate indicators. It offers numerous strategies for using the buy and sell signals. Essentially, it can help detect trend reversal and enter the trade at the most optimal positions.
What is Jurik Volty used in the Juirk Filter?
One of the lesser known qualities of Juirk smoothing is that the Jurik smoothing process is adaptive. "Jurik Volty" (a sort of market volatility ) is what makes Jurik smoothing adaptive. The Jurik Volty calculation can be used as both a standalone indicator and to smooth other indicators that you wish to make adaptive.
What is the Jurik Moving Average?
Have you noticed how moving averages add some lag (delay) to your signals? ... especially when price gaps up or down in a big move, and you are waiting for your moving average to catch up? Wait no more! JMA eliminates this problem forever and gives you the best of both worlds: low lag and smooth lines.
Ideally, you would like a filtered signal to be both smooth and lag-free. Lag causes delays in your trades, and increasing lag in your indicators typically result in lower profits. In other words, late comers get what's left on the table after the feast has already begun.
Included:
Loxx's Expanded Source Types
Alerts
Signals
Bar coloring
Included Libraries
Loxx's Variety RSI
Loxx's Jurik Tools
Loxx's Expanded Source Types
Related indicators:
Natural Market Mirror (NMM) and NMAs w/ Dynamic Zones
RSI/RSX QQE Histogram w/ Discontinued Signal Line
Jurik CFB Adaptive QQE
Adaptive Qualitative Quantitative Estimation (QQE)
CRSI - EddyBased on Cyclic Smoothed Relative Strength Indicator v2 by WhenToTrade
The cyclic smoothed RSI indicator is an enhancement of the classic RSI , adding
- additional smoothing according to the market vibration,
- adaptive upper and lower bands according to the cyclic memory and
- using the current dominant cycle length as input for the indicator.
The cRSI is used like a standard indicator but I've added bar colors and reduced the period minimum to 1.
The default settings uses period of 4.
Bar colors explanation:
Yellow = Bullish cross up of crsi and ub
Lime = bullish continuation
Fuchsia = Cross down of crsi and ub
Red = Cross down of crsi and db
Black = Bearish continuation
ub = aqua line high
db = aqua line low
crsi = fuchsia line representing smoothed RSI
Enjoy!

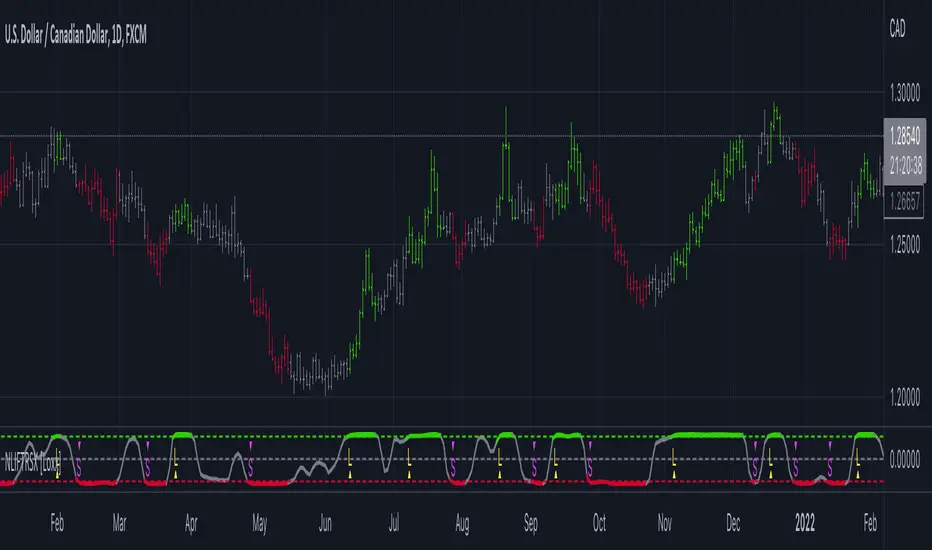
Non-Lag Inverse Fisher Transform of RSX [Loxx]Non-Lag Inverse Fisher Transform of RSX is an Inverse Fisher Transform on the Non-Lagged Smoothing Filter of Jurik RSX.
What is the Inverse Fisher Transform?
The Inverse Fisher Transform was authored by John Ehlers. The IFT applies some math functions and constants to a moving average of the relative strength index (rsi) of the closing price to calculate its oscillator position. T
read more here: www.mesasoftware.com
What is RSX?
RSI is a very popular technical indicator, because it takes into consideration market speed, direction and trend uniformity. However, the its widely criticized drawback is its noisy (jittery) appearance. The Jurk RSX retains all the useful features of RSI , but with one important exception: the noise is gone with no added lag.
What is the Non-lag moving average?
The Non Lag Moving average follows price closely and gives very quick signals as well as early signals of price change. As a standalone Moving Average, it should not be used on its own, but as an additional confluence tool for early signals.
Included:
Alerts
Signals
Bar coloring
Bollinger Bands and RSI Short Selling (by Coinrule)The Bollinger Bands are among the most famous and widely used indicators. A Bollinger Band is a technical analysis tool defined by a set of trendlines plotted two standard deviations (positively and negatively) away from a simple moving average ( SMA ) of a security's price, but which can be adjusted to user preferences. They can suggest when an asset is oversold or overbought in the short term, thus provide the best time for buying and selling it.
The relative strength index ( RSI ) is a momentum indicator used in technical analysis . RSI measures the speed and magnitude of a security's recent price changes to evaluate overvalued or undervalued conditions in the price of that security. The RSI can do more than point to overbought and oversold securities. It can also indicate securities that may be primed for a trend reversal or corrective pullback in price. It can signal when to buy and sell. Traditionally, an RSI reading of 70 or above indicates an overbought situation. A reading of 30 or below indicates an oversold condition.
The short order is placed on assets that present strong momentum when it's more likely that it is about to decrease further. The rule strategy places and closes the order when the following conditions are met:
ENTRY
The closing price is greater than the upper standard deviation of the Bollinger Bands
The RSI is less than 70
EXIT
The trade is closed in profit when the RSI is less than 70
Upper standard deviation of the Bollinger Band is greater than the the closing price.
This strategy comes with a stop loss and a take profit, and as you can see by the results, it is well suited for a bear market.
This trade works very well with ETH (1h timeframe), AVA (4h timeframe), and SOL (3h timeframe) and is backtested from the 1 December 2021 to capture how this strategy would perform in a bear market.
To make the results more realistic, the strategy assumes each order to trade 30% of the available capital. A trading fee of 0.1% is taken into account. The fee is aligned to the base fee applied on Binance, which is the largest cryptocurrency exchange.

Variety RSI w/ Fibonacci Auto Channel [Loxx]Variety RSI w/ Fibonacci Auto Channel is an RSI indicator with 7 different RSI types and 4 Fibonacci Channels. This indicator has signal crossing options for signal, middle, and all Fibonacci levels. Bar and fill coloring is using a signal-determinant gradient coloring system to show signal strength or weakness.
What is RSI?
The relative strength index (RSI) is a momentum indicator used in technical analysis. RSI measures the speed and magnitude of a security's recent price changes to evaluate overvalued or undervalued conditions in the price of that security.
The RSI is displayed as an oscillator (a line graph) on a scale of zero to 100. The indicator was developed by J. Welles Wilder Jr. and introduced in his seminal 1978 book, New Concepts in Technical Trading Systems.
The RSI can do more than point to overbought and oversold securities. It can also indicate securities that may be primed for a trend reversal or corrective pullback in price. It can signal when to buy and sell. Traditionally, an RSI reading of 70 or above indicates an overbought situation. A reading of 30 or below indicates an oversold condition.
Included
Bar coloring
6 types of signal crossing options
Alerts
Loxx's Expanded Source Types
Loxx's RSI Variety RSI types
JG RSI/MFI/divergence IndicatorThis is a combination of
- RSI (relative strength index)
- MFI (money flow index)
- Divergences on the RSI
MFI behaves much the same as RSI but it more responsive/to some degree a leading indicator. I find it helps having this overlayed with RSI to help gauge price action and sentiment, as well as for confluence with RSI.
Floating RSI IndicatorThe Simple Floating Relative Index Strength Indicator to analysis the real time value of RSI along with High Minus Low of Day , Week and Monthly candle value and Real time Candle Body size. Simple indications of colors i.e. green indicates bullish and red indicates Bearish

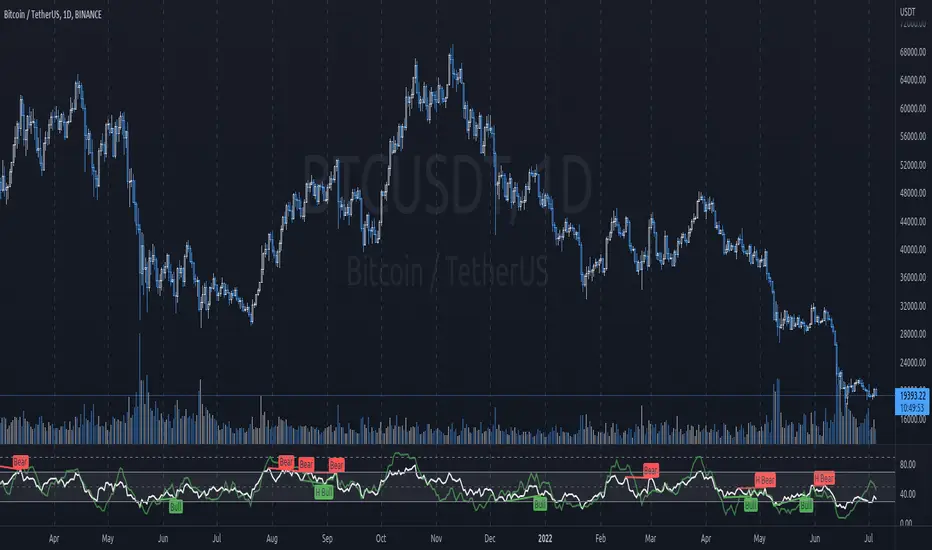
Ribbon Relative Strength IndexDescription
Ribbon RSI is the base on of the original RSI.
In RSI (dark color) and RSI-base MA (light color), we added short (12-day) and long (26-day) periods to show these crossovers, including crossovers between the RSI and the RSI-base MA, We've also added a trend period (50-day) RSI section that shows this section in the background.
And because Stochastic is a momentum indicator as well. It is therefore included as a guide to support RSI in another way.
How to Setting
— You can adjust the Short (12 days), Long (26 days) and Trend (50 days) periods from Settings: Input page in the RSI Setting section.
— You can adjust the RSI-base MA interval (9 days) on the Settings: Input page in the MA Setting section.
— You can display the lines of RSI, RSI-base MA at Setting: Style in RSI…
— You can display the Stochastic lines on the Settings: Style page in the Stochastic…

Options Volume Indicator
Volume Indicator for Option Trading, it is a simple indicator based on Relative Strength Index. There are two horizontal lines are mention 10 and -10, if bar crossed above the (Line 10) then go for buy and when Bar cross under (Line -10) go for sell side.
If Bar Color changed to Respective color of the previous bar i.e. color gets darker then you can exit/ trail SL there because it overbought / Oversold position and vice versa for Sell Side.
this volume indicator works on any Script.
The Black Floating Line indicates the Average volume

RSI MTF Ob+OsHello Traders,
This indicator use the same concept as my previous indicator "CCI MTF Ob+Os".
It is a simple "Relative Strength Index" ( RSI ) indicator with multi-timeframe (MTF) overbought and oversold level.
It can detect overbought and oversold level up to 5 timeframes, which help traders spot potential reversal point more easily.
There are options to select 1-5 timeframes to detect overbought and oversold.
Aqua Background is "Oversold" , looking for "Long".
Orange Background is "Overbought" , looking for "Short".
Have fun :)

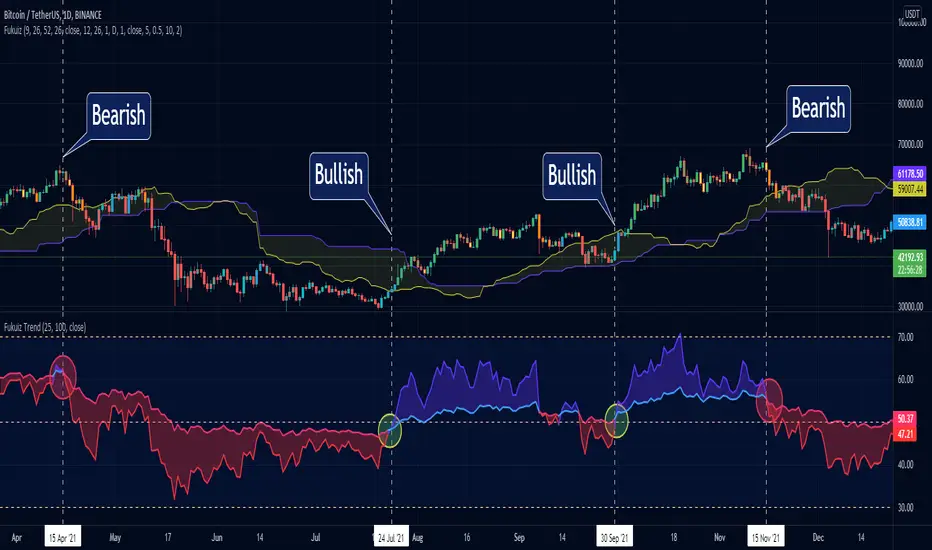
Fukuiz TrendThis indicator base on RSI of 2 different periond.
#A brief introduction to RSI #
The relative strength index (RSI) is a momentum indicator used in technical analysis that measures the magnitude of recent price changes to evaluate overbought or oversold conditions in the price of a stock or other asset. The RSI is displayed as an oscillator (a line graph that moves between two extremes) and can have a reading from 0 to 100. The indicator was originally developed by J. Welles Wilder Jr. and introduced in his seminal 1978 book, “New Concepts in Technical Trading Systems.”
Traditional interpretation and usage of the RSI are that values of 70 or above indicate that a security is becoming overbought or overvalued and may be primed for a trend reversal or corrective pullback in price. An RSI reading of 30 or below indicates an oversold or undervalued condition.
#In this indicator#
I see that you can use 2 RSI with different periond to suggest Bullish trend and Bearish trend.
#Conditions between short and long RSI crossing#
Crossover = Bullish trend (blue zone)
Crossunder = Bearish trend (red zone)
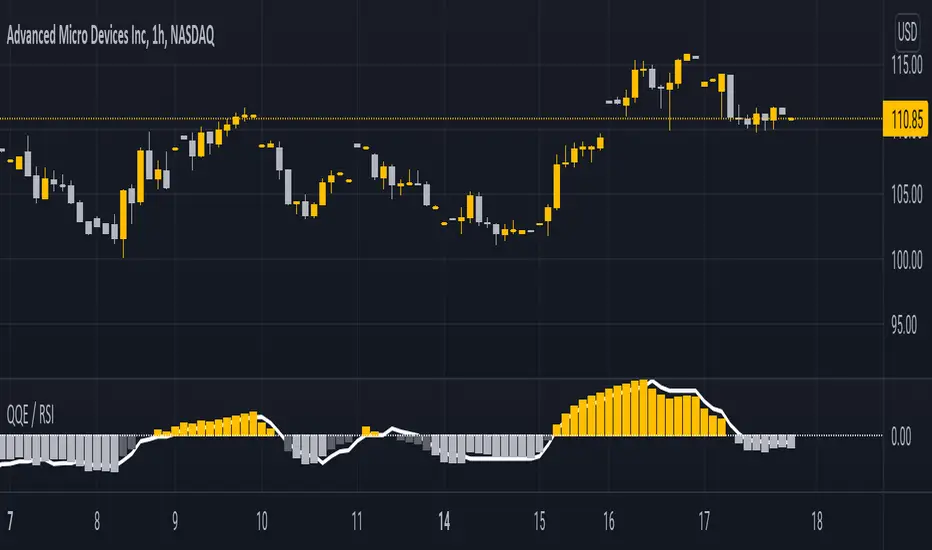
QQE / RSIA indicator which combines the QQE indicator, which is a momentum based indicator to determine trend and sideways.
The Qualitative Quantitative Estimation (QQE) indicator works like a smoother version of the popular Relative Strength Index ( RSI ) indicator. QQE expands on RSI by adding two volatility based trailing stop lines. These trailing stop lines are composed of a fast and a slow moving Average True Range (ATR). These ATR lines are smoothed making this indicator less susceptible to short term volatility .
Along with it, i integrated the RSI indicator so both can be monitored simultaneously on one indicator.
This script had been inspired by Mihkel00 so go check him out.
The indicator is shown on the chart as columns, and the other "hidden" in the background which also has a 50 MA bollinger band acting as a zero line.
When both of them agree - you get a bullish or bearish bar
Measure Volume, Momentum, Trend, VolatilityThis script displays the following indicators in one pane to quickly determine several important factors regarding price action. It allows the user to quickly see all of most important factors surrounding price action in one pane with one quick glance. This should be incredibly helpful and allow things like double divergence and trend confirmation to be spotted much more quickly. I personally use the data in this indicator to replace four separate indicators and it has brought my win rate and profit factor significantly higher. I hadn't seen any place where all of the best J. Welles Wilder indicators such as RSI, Parabolic SAR, and DMI/ADX were brought into one easy to use interface. This is my attempt at fixing that gap. For a much deeper understanding of how to use these indicators, I recommend reading New Concepts in Technical Trading Systems written by J. Welles Wilder.
Momentum via RSI (Relative Strength Index)
Volume via MFI (Money Flow Index)
Volatility via DMI/ADX (Direction Movement Index/Average Directional Index)
Trend via Parabolic SAR (Parabolic Stop and Reverse)
It is worth noting that DMI/ADX and Parabolic SAR can both help determine trend strength and volatility.
The Volatility mechanism is measured by DMI and ADX and displayed at the top of the pane using circles. The top, tiny circles reflect if show if positive DI or negative DI has a higher value. The small circles directly underneath indicate whether or not the ADX is above 20 (configurable, some may choose to increase this to 25 or even 30).
The Momentum mechanism is shown as standard RSI with the default being a white line and default period of 14, which is all configurable.
The Volume mechanism is shown as standard MFI with the default being a fuchsia line and default period of 14, which is also configurable.
The momentum and volume oscillators should be used in conjunction to help spot whether the trend is strong or weak using divergences and the middle, overbought, and oversold levels. These levels are also configurable.
The Trend mechanism is measured by Parabolic SAR and displayed at the bottom of the pane using diamonds. The default is red diamonds when in a bear trend, green when in an uptrend which is configurable. When price is above the Parabolic SAR, it is considered to be an uptrend. When price is below the Parabolic SAR, it is considered to be a downtrend. The way price is measured is also configurable (i.e. open, close, ohlc4, hlc3, etc.). When price crossed above or below the Parabolic SAR, the diamonds will change colors.
All the indicators displayed should be used in a well rounded strategy. For instance, I only trade when ADX is above 20 and rarely trade against the trend shown via PSAR. When trend shifts and divergences helped indicate a trend shift would occur using the RSI and MFI, it can be a great spot to take an entry. RSI/MFI can also confirm the trend is strong when they are not showing divergences and inline with price action. All of this data should be used in conjunction with good fundamental data and technical levels. Divergences with RSI and MFI on double tops or bottoms can also be incredibly powerful. There is no right or wrong way to use all the data displayed in this indicator, however using all four pillars of trading (Momentum, Volume, Trend, Volatility) will help ensure only the best trades are taken.

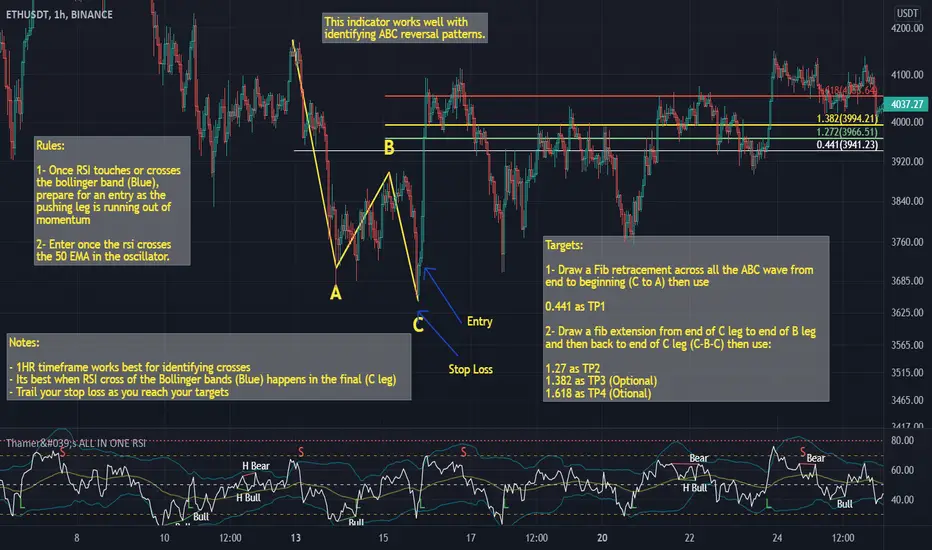
Thamer's ALL IN ONE RSIThis is a special relative strength index indicator that includes the following:
- Bollinger Bands on the RSI
- EMA on the RSI
- SMA on the RSI
You can use the Bollinger bands on the RSI to identify extreme volatility and momentum areas based on the RSI
You can also use RSI break out of the EMA or SMA as a confluence of strong momentum.
MTF RSI + Average (Multi-Timeframe) [TH]Multi-Timeframe Relative Strength Index --- MTF RSI
Eliminates having to change time intervals to view a different Time Interval's RSI value (up to 5 time intervals possible through the settings).
The RSI values from Multiple Time Frames can be averaged together to show one single RSI.
A table overlay (info box) makes it easy to quickly identify RSI values on the multiple different time frames.

RSI + MA StrategyHello, everyone!
We have just released an innovative strategy for TradingView. It allows you to facilitate the trading process when you have to use both indicators.
This strategy is:
User-friendly
Configurable
Equipped with the combination of Relative Strength Index (RSI) and Moving Average (MA) indicators
Designed with all required functions to manage positions
Features
The RSI+MA strategy can:
Identify entry points for Long and Short positions.
Depict RSI and MA values concerning each other.
Reduce visual congestion and import usability thanks to using a combo of 2 indicators.
Allow using pivot trading. The RSI+MA strategy will enter a Long position according to the Short position conditions. And vice versa.
Note! If you want to open a Long position, the RSI line should cross MA from top to bottom. If you want to open a Short position, RSI has to cross MA from bottom to top.
Parameters
We have equipped our strategy with more than 14 additional parameters. So, you can configure the EA according to your needs!
Inputs :
Use Reverse Trade — allows swapping Long and Short positions opening conditions.
Resolution — allows you to view an indicator with data on a higher or lower timeframe on the current chart.
RSI Length
RSI Source: Open, High, Low, Close, HL2, HLC3, OHLC4
Show MA — allows you to enable or disable MA displaying.
MA Length
MA Offset
Style:
RSI — RSI indicator line color and style settings.
MA — MA indicator line color and style configuration.
Upper Band — allows customizing line style, color, and RSI upper bound value.
Lower Band — allows you to customize line style, color, and RSI lower bound value.
Background — background color setting within the RSI upper and lower borders.
Precision — number of decimals for RSI values.
Note! Try RSI+MA on your demo account first before going live.

RSI CrayonsThis simple script colors candles based on the Relative Strength Index. RSI Values > 50 are solid colors, RSI values < 50 are pastels, with additional colors/fills/alerts for overheated and oversold (both user adjustable thresholds) conditions.
As an added bonus, RSI can be calculated by non-traditional methods (not using the running/smoothed moving average) using a variety of different moving averages, but you may have to adjust the time-frame for 'faster' moving averages. An option for plotting the moving average basis is also available.
Value Added:
This indicator can be used to chart RSI without adding an "oscillator frame" to your chart, since we don't normally care too much about RSI values between 30 and 70 under normal conditions.
