Happy BarsThis script works to help the trader quickly visualize specific moments in time, where certain price action bars are taking place.
Highlighting:
- inside bars
- outside bars
- inside inside bars
- inside outside bars
- outside outside bars
and allowing the trader to set alerts once the bar patterns are confirmed.
在腳本中搜尋"bar"

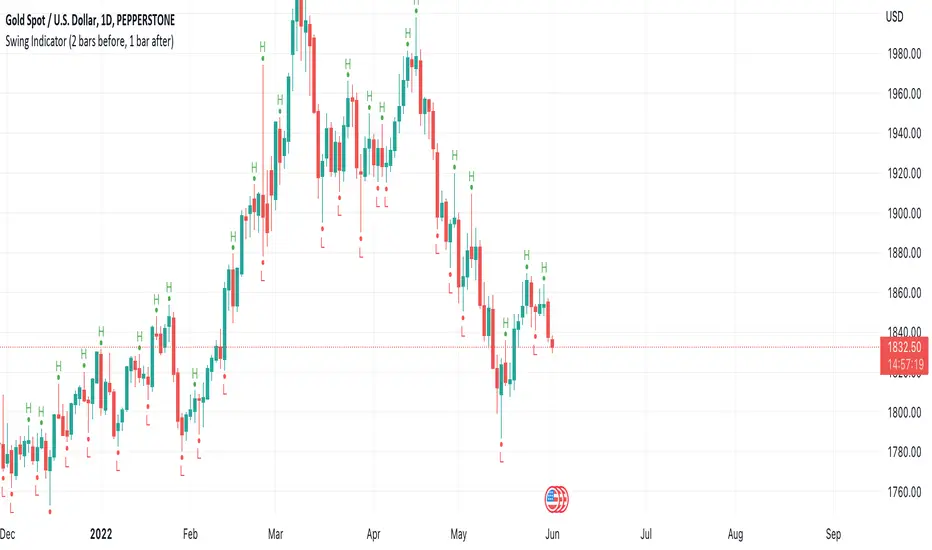
Swing Indicator (2 bars before, 1 bar after)This swing indicator is created to mark swing high and low followed by the condition of Bravo Trade Academy.
Conditions for being a Swing High
- The high price of swing high bar has to be higher than the high price of 2 bars before and 1 bar after
Conditions for being a Swing Low
- The low price of swing low bar has to be lower than the low price of 2 bars before and 1 bar after
=========================================================================
Swing Indicator นี้สร้างขึ้นเพื่อช่วยในการมาร์ค Swing High และ Swing Low ตามเงื่อนไขการเป็น Swing หน้า 2 หลัง 1 ของ Bravo Trade Academy
เงื่อนไขการเป็น Swing High
- ราคา High ของแท่งที่เป็น Swing High จะต้องสูงกว่าราคา High ของแท่งก่อนหน้า 2 แท่ง และแท่งหลัง 1 แท่ง
เงื่อนไขการเป็น Swing Low
- ราคา Low ของแท่งที่เป็น Swing Low จะต้องต่ำกว่าราคา Low ของแท่งก่อนหน้า 2 แท่ง และแท่งหลัง 1 แท่ง
RSI Candle Bar with Inside BarThis Indicator is RSI convert into Candle Bar with Inside Bar Candle
How to use :
Do Some setting
RSI Overbought - 60 It will shows in Blue Candle Bar means Bullish Signal
RSI Oversold - 40 It will shows in Yellow Candle Bar means Bearish Signal
Inside Bar Candle -
Gray or Black Bar --- Which is Shows that Trend may be Reverse or Big Move may be come.
Colors you can be change according to your convenience.

Viper Futures Range Bar CandlesThe Range Bars used in more Professional trading platforms to keep smoothness on the charts and help make custom range price candles based on the range size chosen for the market being traded. Example an 8 Range bar on the ES or MES Futures is 8 ticks = 2 points. Another Example on NQ a 22 Range bar popularly traded by trading professionals is a total of 22 ticks = 5 1/2 points on the Nasdaq or Micro NQ futures. Simple add to charge, set the range bar setting with a particular range setting in mind and then for clarity uncheck the original price chart on top left corner, same way you would disable an indicator temporarily. Works very clear and nice. A good accommodation for trading View as trading view does not offer historical tick data to use Renko bars very well at the moment.
Basically plots a candle rather then a OHLC bar for Range Bars on TV!
Default color was set to my Viper Futures Chart, you can change back to green/red, etc.
Enjoy!
Power Bar [racer8]Introduction: 🌟
The Power Bar indicator is a powerful volatility indicator that can detect power bars 💪. A power bar is just a really big price bar that forms after a price base. A price base is chart pattern consisting of many low volatility price bars (bars that have small ranges). To detect such powerful bars, the PB indicator uses the following formula:
PB = ( Absolute value of current close - previous close ) / ( Previous price range over n periods )
Looking at the formula, you can see that PB compares the current change in closing price to the n-period base pattern's range. Strong PB values are typically greater than a value of 1. If n periods = 10, the indicator will look back 11 periods. The 11 periods includes the 10-period base plus the current price bar. 10 periods is the default setting for the indicator.
After the calculation, PB is then plotted as a histogram. Along with the histogram, a horizontal dashed line is also plotted.
PB's other setting controls the dashed line's level. This level is preset at a default value of 1. The dashed line is just a way to filter out weak PB values, and to generate signals. A signal is generated when the PB histogram is above the dashed line.
Objective: 🤔
This indicator shall prove very useful to you if your main objective is to trade only the best chart pattern in the market...and the base pattern is one of the best, if not the best chart pattern that exists today. This indicator is a mechanical way of detecting the chart pattern.
Enjoy! 🥳

Engulfing/Outside BarThis indicator provides a statistical report on the Engulfing/ Outside Bar candlestick pattern. Based on the chart's bars, it can improve your edge on any markets and timeframes.
Knowing there are many definitions about the Engulfing/ Outside Bar pattern, here we're strictly referring to one bar's body engulfing one other AND making a higher high and lower low.
The report is broken down into the different following sections: retracement , invalidation , continuation and breakout .
Each of them provides hindsights about the pattern price behavior and brings answers to questions such as: How often does price retrace? Does the pattern often invalidate? If it doesn't then does it break in the pattern's direction? How far does price go? What are the odds of a false breakout?
While there are many ways to make use of the metrics, my favorite use case is for developing directional and daily/weekly biases while refining my stop/entry/target positioning.
Miscellaneous
Highlights patterns on the chart;
Supports bar to bar analysis and replay functionalities;
Provides counts on the `Data Window` panel for debugging or computing your own metrics;
Settings
Option for filtering patterns that close outside previous bar;
Show/hide for toggling different sections;
Report coloring and offset on the x axis;
Gaining Access
This is a private indicator and is available only for my Patrons. You can reach my Patreon page below from the link in my signature.

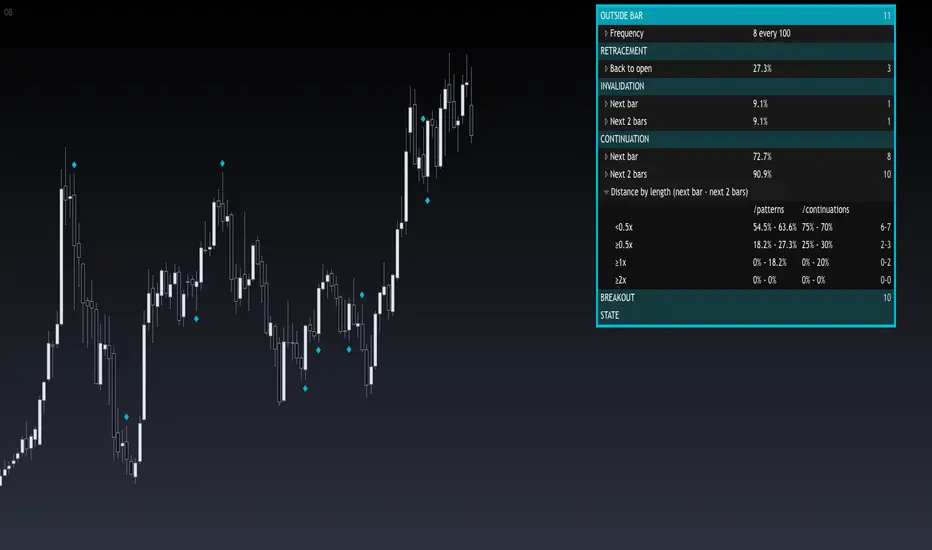
Outside BarThis indicator provides a statistical report on the Outside Bar candlestick pattern. Based on the chart's bars, it can improve your edge on any markets and timeframes.
Knowing there are many definitions about the Outside Bar pattern, here we're strictly referring to one bar's extremes beyond one other.
The report is broken down into the different following sections: retracement , invalidation , continuation and breakout .
Each of them provides hindsights about the pattern price behavior and brings answers to questions such as: How often does price retrace? Does the pattern often invalidate? If it doesn't then does it break in the pattern's direction? How far does price go? What are the odds of a false breakout?
While there are many ways to make use of the metrics, my favorite use case is for developing directional and daily/weekly biases while refining my stop/entry/target positioning.
Miscellaneous
Highlights patterns on the chart;
Supports bar to bar analysis and replay functionalities;
Provides counts on the `Data Window` panel for debugging or computing your own metrics;
Settings
Option for filtering patterns that close outside previous bar;
Show/hide for toggling different sections;
Report coloring and offset on the x axis;
Gaining Access
This is a private indicator and is available only for my Patrons. You can reach my Patreon page below from the link in my signature.
PineScript v4 - Forex Pin-Bar Trading StrategyPineScript v4, forex trading robot based on the commonly used bullish / bearish pin-bar piercing the moving averages strategy.
I coded this robot to stress-test the PineScript v4 language to see how advanced it is, and whether I could port a forex trading strategy from MT4 to TradingView.
In my opinion, PineScript v4 is still not a professional coding language; for example you cannot use IF-statements to modify the contents of global variables; this makes complex robot behaviour difficult to implement. In addition, it is unclear if the programmer can use nested IF-ELSE, or nested FOR within IF.
The sequence of program execution is also unclear, and although complex order entry and exit appears to function properly, I am not completely comfortable with it.
Recommended Chart Settings:
Asset Class: Forex
Time Frame: H1
Long Entry Conditions:
a) Moving Average up trend, fast crosses above slow
b) Presence of a Bullish Pin Bar
c) Pin Bar pierces either Moving Average
d) Moving Averages must be sloping up, angle threshold (optional)
Short Entry Conditions:
a) Moving Average down trend, fast crosses below slow
b) Presence of a Bearish Pin Bar
c) Pin Bar pierces either Moving Average
d) Moving Averages must be sloping down, angle threshold (optional)
Exit Conditions:
a) Stoploss level is hit
b) Takeprofit level is hit
c) Moving Averages cross-back (optional)
Default Robot Settings:
Equity Risk (%): 3 //how much account balance to risk per trade
Stop Loss (x*ATR, Float): 2.1 //stoploss = x * ATR, you can change x
Risk : Reward (1 : x*SL, Float): 3.1 //takeprofit = x * stop_loss_distance, you can change x
Fast MA (Period): 20 //fast moving average period
Slow MA (Period): 50 //slow moving average period
ATR (Period): 14 //average true range period
Use MA Slope (Boolean): true //toggle the requirement of the moving average slope
Bull Slope Angle (Deg): 1 //angle above which, moving average is considered to be sloping up
Bear Slope Angle (Deg): -1 //angle below which, moving average is considered to be sloping down
Exit When MA Re-Cross (Boolean): true //toggle, close trade if moving average crosses back
Cancel Entry After X Bars (Period): 3 //cancel the order after x bars not triggered, you can change x
Backtest Results (2019 to 2020, H1, Default Settings):
EURJPY - 111% profit, 2.631 profit factor, 16.43% drawdown
EURUSD - 103% profit, 2.899 profit factor, 14.95% drawdown
EURAUD - 76.75% profit, 1.8 profit factor, 17.99% drawdown
NZDUSD - 64.62% profit, 1.727 profit factor, 19.14% drawdown
GBPUSD - 58.73% profit, 1.663 profit factor, 15.44% downdown
AUDJPY - 48.71% profit, 1.635 profit factor, 11.81% drawdown
USDCHF - 30.72% profit, 1.36 profit factor, 22.63% drawdown
AUDUSD - 8.54% profit, 1.092 profit factor, 19.86% drawdown
EURGBP - 0.03% profit, 1.0 profit factor, 29.66% drawdown
USDJPY - 1.96% loss, 0.972 profit factor, 28.37% drawdown
USDCAD - 6.36% loss, 0.891 profit factor, 21.14% drawdown
GBPJPY - 28.27% loss, 0.461 profit factor, 39.13% drawdown
To reduce the possibility of curve-fitting, this robot was backtested on 12 popular forex currencies, as shown above. The robot was profitable on 8 out of 12 currencies, breakeven on 1, and made a loss on 3.
The default robot settings could be over-fitting for the EUR, as we can see out-sized performance for the EUR pairs, with the exception of the EURGBP. We can see that GBPJPY made the largest loss, so these two pairs could be related.
Risk Warning:
This is a forex trading strategy that involves high risk of equity loss, and backtest performance will not equal future results. You agree to use this script at your own risk.

How To Color Prior BarsExample how to color the trigger bar of the condition and n-1 prior bars using only 1 barcolor() function.
Currently when offsets are used in barcolor(), bgcolor(), plot(), plotarrow(), plotchar(), or plotshape(), the offset only works with a simple (static) integer. If series (dynamic) integers are used instead, there is not an error, but the series values are ignored. Because of this limitation of offset being constrained to using only fixed offsets, the normal way to paint 3 Black Crows would be to use 3 barcolor() functions. Since there are a known number of bars to be painted in that scenario, this can be easily accomplished.
If a condition encompassed a variable length of n bars, then the number of barcolor() functions needed to use would be unknown. How to color the trigger bar of the condition and n-1 prior bars using only 1 barcolor() function? Dual examples below solves issue but requires n "future" bars, because of this it will not paint the most recent condition in realtime and may not be applicable for use in certain realtime situations. It paints similar in behavior to how a pivot does. Special thanks to LucF and RicardoSantos for illumination!
NOTICE: This is an example script and not meant to be used as an actual strategy. By using this script or any portion thereof, you acknowledge that you have read and understood that this is for research purposes only and I am not responsible for any financial losses you may incur by using this script!

Renko Price Bars Overlay// Shows the price renko bars (or range bars) instead of the PERIOD renko
// bars that are integrated into Trading View. The normal renko bars that
// Trading View offers only consider the drawing of a new brick when the
// price closes above or below the required brick size. This can produce
// misleading charts since depending on the time interval of a chart, new
// bricks may or may not be drawn. True price renko bars will draw a new
// brick immediately upon the price exceeding the next target brick size.
// When running this script in "Traditional" mode, the painting of the
// brick overlay band is INDEPENDENT of the chart interval. If price
// exceeds the required target price for the next brick, the band is
// updated immediately, instead of waiting for the price bar on the chart
// interval to close first. The brick starting anchor point will attempt
// to be a "nice number" at a round interval for the chart ticker. For
// example, if viewing EURUSD with the box size equal to 50 ticks/pips,
// the open and close prices will take the form of 1.2100, 1.2150, 1.2200,
// 1.2250, and so on. This is the same behavior as the normal traditional
// Renko bars in Trading View and other major trading platforms such as
// Meta Trader.
// Use the tick size in traditional mode to specify the block size, in
// ticks. This may give interesting results in FOREX pairs... as the tick
// size in Trading View may be 0.00001 instead of the normal pip size of
// 0.0001, so a 10 pip block size may be '100', and not the expected '10'.
// FOREX futures should work in the manner expected, a 10 pip block size
// will indeed equal 0.0010.
// The "ATR" mode functions differently than the Trading View built in
// version. The block size is updated each time the range is exceeded.
// In Trading View, when using the ATR mode, the ATR is the last ATR
// value calculated on the ENTIRE data interval, and is applied to all
// past data. You can see this when you press the '+' sign of the ticker
// in the top left of the chart window and you will see the brick size
// as a constant, the brick size is not a function of the ever changing
// ATR value of the price action. The block size of this script is not
// updated for each price candle (i.e. each 1HR on a 1HR chart), instead
// it is updated only when the price thresholds are exceeded requiring a
// the band to be updated. At that point the current ATR is considered
// and the brick size is updated.
// Options exist to show the current high and low of the brick, and to
// show the required levels that the price must exceed to draw a new
// brick and update the band.
Please leave comments if you notice any bugs or would like any new features added. I don't find much use for plotting the H/L of the current renko candle, but I have seen some request it in the past.
Cheers.

Colored Volume Bars standard deviation from meanThe colour bars:
Green: Price up - Volume > 2 x STD of last 21 bars
Blue: Price up - Volume > 1 x STD of last 21 bars
Maroon: Price down - Volume > 2 x STD of last 21 bars
Purple: Price down - Volume > 1 x STD of last 21 bars
Grey: not high volume bar
Green line: 2 bar sma
Red line: 8 period sma of the greenline
Bollinger band: 55 period sma of the 21 period sma with bands 1.618 deviation from the mean

3-bar Swing Liquidity Grab📊 3-BAR SWING LIQUIDITY GRAB
WHAT IT DOES
Automatically detects 3-bar swing highs/lows and alerts you to liquidity grab moments — when price breaks structural levels to trigger stop-losses, then reverses.
SIGNALS AT A GLANCE
Signal What It Means Trade Idea
SH 🟠▼ Swing High (Resistance) Reference level
SL 🔵▲ Swing Low (Support) Reference level
LQH 🔴❌ Fake break ABOVE resistance SHORT ⬇️
LQL 🟢❌ Fake break BELOW support LONG ⬆️
HOW TO TRADE IT
Spot the trend — Is price going up or down?
Wait for signal — LQL (green) in uptrend, LQH (red) in downtrend
Enter on signal — Place order on that bar
Stop Loss — Just outside the swing level
Take Profit — At the next swing level
SETTINGS EXPLAINED
Swing length: 1 = 3-bar swing, 2 = 5-bar swing (use 1 for scalp, 2 for larger TF)
Lookback bars: Time window to find liquidity grabs (10-20 for scalp, 50+ for position)
Toggles: Show/hide swing markers and signals
BEST ON THESE TIMEFRAMES
TF Type Settings
M5-M15 Scalp SL: 1, LB: 10-15
M15-H1 Intraday SL: 1, LB: 15-20
H1-H4 Swing SL: 1-2, LB: 20-50
D+ Position SL: 2, LB: 50+
KEY RULES
✅ DO:
Trade signals aligned with major trend
Always use stop loss
Use 2-5% risk per trade
Confirm with price action
❌ DON'T:
Trade choppy/sideways markets
Ignore the trend
Chase signals
Overtrade
REAL EXAMPLE
LONG Trade (LQL Signal):
text
Uptrend → Swing Low forms at 1.0950
→ Price dips to 1.0930 (below SL)
→ Closes at 1.0955 (above SL) = GREEN ❌ (LQL)
→ BUY at 1.0960
→ Stop Loss: 1.0920
→ Take Profit: 1.1050 (previous Swing High)
WORKS ON
✅ Crypto (Bitcoin, Ethereum, Altcoins)
✅ Forex (EUR/USD, GBP/USD, etc.)
✅ Stocks & Indices
✅ Commodities (Gold, Oil, etc.)
Any asset, any timeframe, any market.
DISCLAIMER
This is a technical analysis tool, not financial advice. Past performance does not guarantee future results. Always use proper risk management and test on a demo account first.

Power Bar [MMT]Identify and trade powerful market thrusts with precision. Power Bar detects high-momentum bullish and bearish candles that break recent support or resistance, combine proximity to a key moving average, and offer automated multi-TP trade management.
Features
Power Bar Detection : Spots large-bodied candles (relative to ATR) with minimal opposing wicks, originating near the 20 SMA, and breaking key support/resistance zones.
Fully Configurable : Adjust ATR length/multiplier, wick size ratio, SMA proximity, display style (most recent/historical) and more.
SMA Overlay : Optionally plot configurable SMA for context with proximity checks.
Support/Resistance Lines : Detect and visualize dynamic S/R based on recent swing highs/lows, with customizable lookback, style, color, and tolerance.
Trade Managemen t: Automated lines and labels for entry, stop loss, and up to three profit targets (ATR or risk multiples). Choose display mode and extend historical trades.
Visual Alerts : Color-coded bar highlights, up/down arrow label overlays, customizable colors for bullish/bearish power bars.
Use Cases
Rapidly spot and respond to strong market moves, often signaling trend initiation or continuation.
Integrate with multi-timeframe setups, momentum strategies, and discretionary trading.
Set up actionable alerts when a power bar triggers in real time.
Inputs
ATR length and multiplier
Wick ratio and SMA proximity
Support/resistance lookback, tolerance, style, color
Trade management toggle and TP calculation modes
Historical/max recent bars/trades limit controls
Alerts
Alert conditions for bullish, bearish, and any power bar event, supporting automated trading workflows.
Inside Bar ExplosionCategory: Price Action, Volatility Compression, Breakout Detection
🔍 Overview
This indicator detects multi-bar inside candle compressions (“inside bar coils”) and marks powerful breakout moments that follow.
It highlights when volatility contracts inside a large “mother candle” and then suddenly explodes with a bullish or bearish breakout backed by volume confirmation.
⚙️ How It Works
Mother Candle:
Detected when a large candle (range > defined %) appears with above-average volume.
Compression Phase:
Consecutive candles stay completely within the range of that mother candle.
The longer the compression, the tighter the coiling pattern.
Explosion Candle:
A candle breaks above or below the compression range,
Has a large range and a volume spike, confirming breakout direction.
💡 Visual Cues
🟨 Yellow Highlight: Mother Candle
🔵 Blue Zone: Compression (Inside Bar Cluster)
🟢 Green Background: Bullish Explosion
🔴 Red Background: Bearish Explosion
🚀 Label: Bull breakout with days in compression
💥 Label: Bear breakdown with days in compression
⚡ START: Marks final compression candle before breakout
📊 Table (Top Right): Live compression stats (days, range %, volume ratio)
🧠 Parameters
Setting Description
Minimum Inside Bars Minimum candles inside the mother candle to qualify as compression.
Maximum Inside Bars Limit to prevent invalid long compressions.
Mother Candle Min Size (%) Defines how large a candle must be to be considered a mother candle.
Explosion Candle Min Size (%) Minimum % range for valid breakout candles.
Volume Spike Multiplier Required volume increase vs. average for breakout validation.
Show Labels / Box Toggle visual elements on/off for clarity.
🚨 Alerts
⚡ Compression Start: New coiling phase detected.
🚀 Bull Explosion: Bullish breakout with volume confirmation.
💥 Bear Explosion: Bearish breakdown with volume confirmation.
📈 Use Cases
Identify volatility squeezes before major breakouts.
Detect range-bound periods leading to trend initiation.
Combine with moving averages or RSI for higher confidence setups.
⚠️ Notes
Works best on daily or 4-hour charts.
Works for stocks, crypto, forex, or indices.
Does not repaint — signals are confirmed on bar close.

Smart Inside Bar Zones by Dinkan🔹 How It Works
An Inside Bar is formed when a candle’s high and low are completely within the previous candle’s range.
The indicator detects this structure in real time, creates a visual box around it, and extends the zone until the pattern is broken.
Inside Bar candles can be optionally highlighted with a custom color to make them stand out clearly on the chart.
🔹 Features
✅ Automatic Inside Bar detection
✅ Dynamic Inside Bar zone boxes with custom fill & border color
✅ Inside candle body highlighting with user-defined color
✅ Adjustable transparency and border style
✅ Option to display only the latest Inside Bar zone for cleaner charts
🔹 Usage
Traders can use Inside Bar zones to:
Study price compression and breakout regions
Observe range behavior and trend continuation setups
Combine with other tools like volume or support/resistance analysis
🔹 Customization
Change box fill and border color
Adjust Inside Candle color for better visibility
Set transparency and choose whether to show all or only the latest box
⚠️ Disclaimer
This script is intended for market structure visualization and educational purposes only.
It does not generate trading signals or financial advice.
Always perform your own analysis and risk management before making trading decisions.

Engulfing Bar PatternEngulfing Bar Pattern Indicator
Detects and highlights engulfing bar patterns on any timeframe. An engulfing bar occurs when the current candle's total range (high to low) completely engulfs the previous candle's range.
Features:
Bullish Engulfing: Green candle that takes out both the previous bar's high and low - signals potential upward momentum
Bearish Engulfing: Red candle that takes out both the previous bar's high and low - signals potential downward momentum
Visual alerts: Colors engulfing bars and displays buy/sell arrows
TradingView alerts: Configurable alert notifications when patterns form
Fully customizable: Adjust colors, toggle arrows, enable/disable alerts
Best used on: 1-minute to 1-hour timeframes for futures trading, effective for identifying potential reversal or continuation signals at key market levels.

[DEM] Donchian Channels Bars Donchian Channels Bars is designed to color-code price bars based on their relationship to Donchian Channel breakouts by comparing short-term and long-term highest high and lowest low levels. The indicator uses two configurable lookback periods (default 1 and 20 bars) and colors bars green when the shorter-period highest high equals the longer-period highest high (indicating an upward breakout or new high), red when the shorter-period lowest low equals the longer-period lowest low (indicating a downward breakout or new low), and purple when neither condition is met. This visual system helps traders quickly identify when price is making significant moves beyond established ranges, with green bars highlighting potential bullish breakouts above recent resistance and red bars highlighting potential bearish breakouts below recent support levels.
Open - CSC Bars - 33 CSC Bars – Early Session Price Action Filter
This script detects when the first three bars of the RTH (Regular Trading Hours) session all move in the same direction — either all bullish or all bearish.
It’s a tool for price action traders who want to develop structured opening strategies by observing clean directional agreement at the session start. The indicator highlights the third bar when the sequence confirms directional bias.
🔍 How It Works:
Monitors the first three bars after the RTH session begins.
If all three bars are bullish, it highlights the third bar (same for bearish sequences).
No projections, signals, or entries—purely a visual tool to observe and study opening behavior.
🎯 Use Case:
This script is designed to help traders build and test opening-based frameworks by identifying potential trend bias early in the day.
Note: This is an open-source utility script with a simple function. It does not generate signals or predictions and is intended to assist with observation and discretionary strategy building.

Wick Size in USD with 10-Bar AverageWick Size in USD with 10-Bar Average
Version: 1.0
Author: QCodeTrader
🔍 Overview
This indicator converts the price wicks of your candlestick chart into USD values based on ticks, providing both raw and smoothed data via a 10-bar simple moving average. It helps traders visualize the monetary impact of price extremes, making it easier to assess volatility, potential risk, and plan appropriate stop loss levels.
⚙️ Key Features
Tick-Based Calculation:
Converts wick sizes into ticks (using a fixed tick size of 0.01, typical for stocks) and then into USD using a customizable tick value.
10-Bar Moving Average:
Smooths out the wick values over the last 10 bars, giving you a clearer view of average wick behavior.
Bullish/Bearish Visual Cues:
The chart background automatically highlights bullish candles in green and bearish candles in red for quick visual assessment.
Stop Loss Optimization:
The indicator highlights long wick sizes, which can help you set more accurate stop loss levels. Even when the price moves in your favor, long wicks may indicate potential reversals—allowing you to account for this risk when planning your stop losses.
User-Friendly Customization:
Easily adjust the USD value per tick through the settings to tailor the indicator to your specific instrument.
📊 How It Works
Wick Calculation:
The indicator calculates the upper and lower wicks by measuring the distance between the candle’s high/low and its body (open/close).
Conversion to Ticks & USD:
These wick sizes are first converted from price points to ticks (dividing by a fixed tick size of 0.01) and then multiplied by the user-defined tick value to convert the measurement into USD.
Smoothing Data:
A 10-bar simple moving average is computed for both the upper and lower wick values, providing smoothed data that helps identify trends and deviations.
Visual Representation:
Columns display the raw wick sizes in USD.
Lines indicate the 10-bar moving averages.
Background Color shifts between green (bullish) and red (bearish) based on candle type.
⚡ How to Use
Add the Indicator:
Apply it to your chart to begin visualizing wick sizes in monetary terms.
Customize Settings:
Adjust the Tick Value in USD in the settings to match your instrument’s tick value.
(Note: The tick size is fixed at 0.01, which is standard for many stocks.)
Optimize Your Stop Loss:
Analyze the raw and averaged wick values to understand volatility. Long wicks—even when the price moves in your favor—may indicate potential reversals. This insight can help you set more accurate stop loss levels to protect your gains.
Analyze:
Use the indicator’s data to gauge market volatility and assess the significance of price movements, aiding in more informed trading decisions.
This indicator is perfect for traders looking to understand the impact of extreme price movements in monetary terms, optimize stop loss levels, and effectively manage risk across stocks and other instruments with similar tick structures.

[SHORT ONLY] Internal Bar Strength (IBS) Mean Reversion Strategy█ STRATEGY DESCRIPTION
The "Internal Bar Strength (IBS) Strategy" is a mean-reversion strategy designed to identify trading opportunities based on the closing price's position within the daily price range. It enters a short position when the IBS indicates overbought conditions and exits when the IBS reaches oversold levels. This strategy is Short-Only and was designed to be used on the Daily timeframe for Stocks and ETFs.
█ WHAT IS INTERNAL BAR STRENGTH (IBS)?
Internal Bar Strength (IBS) measures where the closing price falls within the high-low range of a bar. It is calculated as:
IBS = (Close - Low) / (High - Low)
- Low IBS (≤ 0.2) : Indicates the close is near the bar's low, suggesting oversold conditions.
- High IBS (≥ 0.8) : Indicates the close is near the bar's high, suggesting overbought conditions.
█ SIGNAL GENERATION
1. SHORT ENTRY
A Short Signal is triggered when:
The IBS value rises to or above the Upper Threshold (default: 0.9).
The Closing price is greater than the previous bars High (close>high ).
The signal occurs within the specified time window (between `Start Time` and `End Time`).
2. EXIT CONDITION
An exit Signal is generated when the IBS value drops to or below the Lower Threshold (default: 0.3). This prompts the strategy to exit the position.
█ ADDITIONAL SETTINGS
Upper Threshold: The IBS level at which the strategy enters trades. Default is 0.9.
Lower Threshold: The IBS level at which the strategy exits short positions. Default is 0.3.
Start Time and End Time: The time window during which the strategy is allowed to execute trades.
█ PERFORMANCE OVERVIEW
This strategy is designed for Stocks and ETFs markets and performs best when prices frequently revert to the mean.
The strategy can be optimized further using additional conditions such as using volume or volatility filters.
It is sensitive to extreme IBS values, which help identify potential reversals.
Backtesting results should be analyzed to optimize the Upper/Lower Thresholds for specific instruments and market conditions.

Inside Bars ITInside Bars IT Indicator
The Inside Bars IT indicator is a powerful tool designed to identify Inside Bars and their extended patterns (InsideBar2) on any chart. An Inside Bar is a candlestick pattern where the current candle's high is lower than the previous candle's high, and the current candle's low is higher than the previous candle's low. This pattern often signals market consolidation and potential breakout opportunities.
The indicator extends the concept of Inside Bars by introducing InsideBar2, which uses the high and low of the first Inside Bar as reference levels. Subsequent candles are classified as InsideBar2 if their high is less than or equal to the reference high and their low is greater than or equal to the reference low.

HTF Candle Range Box (Fixed to HTF Bars)### **Higher Timeframe Candle Range Box (HTF Box Indicator)**
This indicator visually highlights the price range of the most recently closed higher-timeframe (HTF) candle, directly on a lower-timeframe chart. It dynamically adjusts based on the user-selected HTF setting (e.g., 15-minute, 1-hour) and ensures that the box is displayed only on the bars that correspond to that specific HTF candle’s duration.
For instance, if a trader is on a **1-minute chart** with the **HTF set to 15 minutes**, the indicator will draw a box spanning exactly 15 one-minute candles, corresponding to the previous 15-minute HTF candle. The box updates only when a new HTF candle completes, ensuring that it does not change mid-formation.
---
### **How It Works:**
1. **Retrieves Higher Timeframe Data**
The script uses TradingView’s `request.security` function to pull **high, low, open, and close** values from the **previously completed HTF candle** (using ` ` to avoid repainting). It also fetches the **high and low of the candle before that** (using ` `) for comparison.
2. **Determines Breakout Behavior**
It compares the **last closed HTF candle** to the **one before it** to determine whether:
- It **broke above** the previous high.
- It **broke below** the previous low.
- It **broke both** the high and low.
- It **stayed within the previous candle’s range** (no breakout).
3. **Classifies the Candle & Assigns Color**
- **Green (Bullish)**
- Closes above the previous candle’s high.
- Breaks below the previous candle’s low but closes back inside the previous range **if it opened above** the previous high.
- **Red (Bearish)**
- Closes below the previous candle’s low.
- Breaks above the previous candle’s high but closes back inside the previous range **if it opened below** the previous low.
- **Orange (Neutral/Indecisive)**
- Stays within the previous candle’s range.
- Breaks both the high and low but closes inside the previous range without a clear bias.
4. **Box Placement on the Lower Timeframe**
- The script tracks the **bar index** where each HTF candle starts on the lower timeframe (e.g., every 15 bars on a 1-minute chart if HTF = 15 minutes).
- It **only displays the box on those bars**, ensuring that the range is accurately reflected for that time period.
- The box **resets and updates** only when a new HTF candle completes.
---
### **Key Features & Advantages:**
✅ **Clear Higher Timeframe Context:**
- The indicator provides a structured way to analyze HTF price action while trading in a lower timeframe.
- It helps traders identify **HTF support and resistance zones**, potential **breakouts**, and **failed breakouts**.
✅ **Fixed Box Display (No Mid-Candle Repainting):**
- The box is drawn **only after the HTF candle closes**, avoiding misleading fluctuations.
- Unlike other indicators that update live, this one ensures the trader is looking at **confirmed data** only.
✅ **Flexible Timeframe Selection:**
- The user can set **any HTF resolution** (e.g., 5min, 15min, 1hr, 4hr), making it adaptable for different strategies.
✅ **Dynamic Color Coding for Quick Analysis:**
- The **color of the box reflects the market sentiment**, making it easier to spot trends, reversals, and fake-outs.
✅ **No Clutter – Only Applies to the Relevant Bars:**
- Instead of spanning across the whole chart, the range box is **only visible on the bars belonging to the last HTF period**, keeping the chart clean and focused.
---
### **Example Use Case:**
💡 Imagine a trader is scalping on the **1-minute chart** but wants to factor in **HTF 15-minute structure** to avoid getting caught in bad trades. With this indicator:
- They can see whether the last **15-minute candle** was bullish, bearish, or indecisive.
- If it was **bullish (green)**, they may look for **buying opportunities** at lower timeframes.
- If it was **bearish (red)**, they might anticipate **a potential pullback or continuation down**.
- If the **HTF candle failed to break out**, they know the market is **ranging**, avoiding unnecessary trades.
---
### **Final Thoughts:**
This indicator is a **powerful addition for traders who combine multiple timeframes** in their analysis. It provides a **clean and structured way to track HTF price movements** without cluttering the chart or requiring constant manual switching between timeframes. Whether used for **intraday trading, swing trading, or scalping**, it adds an extra layer of confirmation for trade entries and exits.
🔹 **Best for traders who:**
- Want **HTF structure awareness while trading lower timeframes**.
- Need **confirmation of breakouts, failed breakouts, or indecision zones**.
- Prefer a **non-repainting tool that only updates after confirmed HTF closes**.
Let me know if you want any adjustments or additional features! 🚀
