在腳本中搜尋"binary"

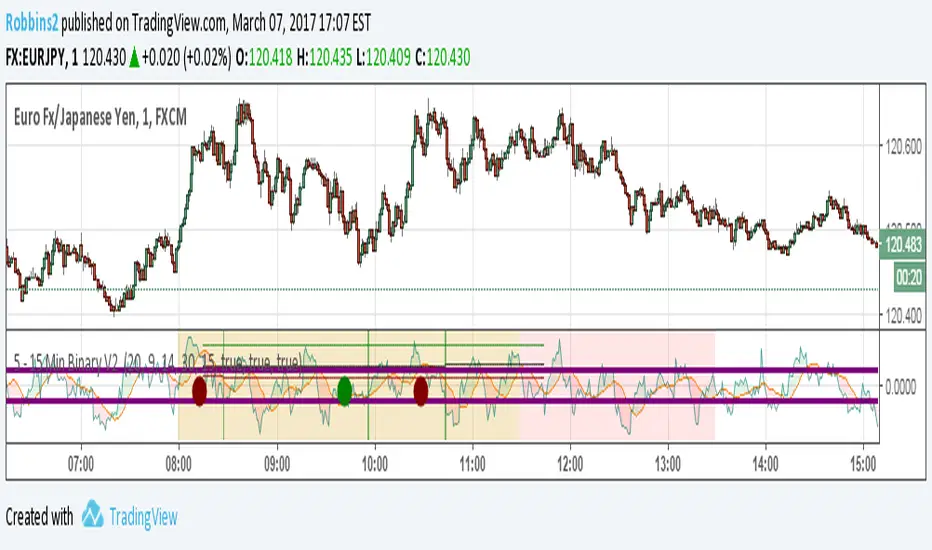
5 - 15 Min Binary V2 Hey guys
As promised back with the updated indicator without needing my blessing to use. Please post feedback so that I can perfect it.
Works great on EU/JP and USDCAD with a risk factor of 20 – 25. Use 1 time frame with 15 mins Expiry for nest results. Possible to get 90% ITM with this setup.
Updated Feature
Risk Factor: Higher the number lowers the risk but also means lower trade setups. Best between 20 – 25.
Added an additional Filter to minimize bad setups
No trading between 11.30 EST to 13.00 EST. Not worth the risk.
Displays ITM rate in Green, Red and total in Black.
Alert capable for Both, Call or Put
Please demo before you take it live. Also during normal trading hours I have not seen more than 3 consecutive loses, (unless there is a news release) so with money management you can greatly increase your total ITM rate.
If you like this indicator, feel free to donate some BTC at 18qrzku9LrQuMq9LyRYmiTbqUtC2bSAv3y
It does take considerable amount of tweaking and testing to put out something like this.
Post feedback so that everyone can benefit.
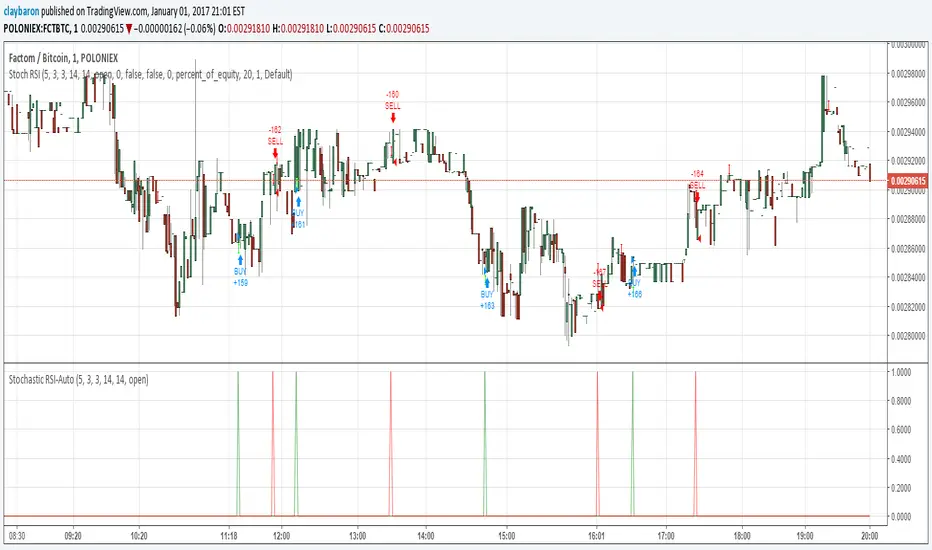
Stochastic RSI StrategyThis is an an adaption of Binary option 1 minute by Maxim Chechel to a strategy. I have had success with this on FCT/BTC on Poloniex.
BB and RSI Indicator Alert v0.3 by JustUncleLI have just recently revised this indicator alert for public release. This is for the 60sec Bollinger Band break Binary Option traders.
This indicator alert is a variation of one found in a well known Broker's marketing videos. It uses Bollinger bands, RSI and moving averages. Included is a pre-warning alert condition. The strategy and settings are designed for 1min charts and Binary Options, but it could work for up to 15 min charts.
The default settings are BB(14,2) and RSI(11) with 75/25 Levels boundaries. To be a valid trade the RSI needs to be within 75/25 channel. The optional Market direction filter is enabled by default and is calculated by two EMA (200 and 50):
When 200ema rising and 50ema above 200ema then market going up.
When 200ema falling and 50ema below 200ema then market going down.
A potential Bollinger Break reversal trades identified by shapes: The purple diamond is the pre-warning purple alert and the green and red pointers with the PUT/CALL labels are the trade alerts. Make Binary Option trade in specified direction 60sec (or can also use 120sec trade without Martingale).
* Notes and Hints *
The original videos specified a Martingale money management strategy, be careful using this management. When I use Martingale I recommend go to 3 levels: 10, 25, 65 if no win at 65 stop trading this alert and start next alert back at 10, you should recovery loss by future wins given you are able to get a reasonable ITM rate with this strategy. Alternatively instead of using Martingale use 120sec Binary Option trade.
Be wary of break alerts on a steep Bollinger, they tend to keep running away for awhile, especially if steep on both sides of Bollinger channel.
As with most of this style of indicator the alert conditions will redraw until the candle is closed. For me this is okay, as it is an Alert is only to a potential trade and final decision to trade is made by me.
You need to practise this and be aware of market news, sessions boundaries, slow trading periods etc. Plan your periods of when you should trade, I prefer Asian session before lunch and London sessions.

BO_EXPIRY_VDUB_v1Set Background to custom Trading sessions & set custom Binary Options expiry times.


BO ADX Binary Option strategy based on ADX/DI cross, Put or Call at the beginning of the next candle, expire 5m for 5m candle.

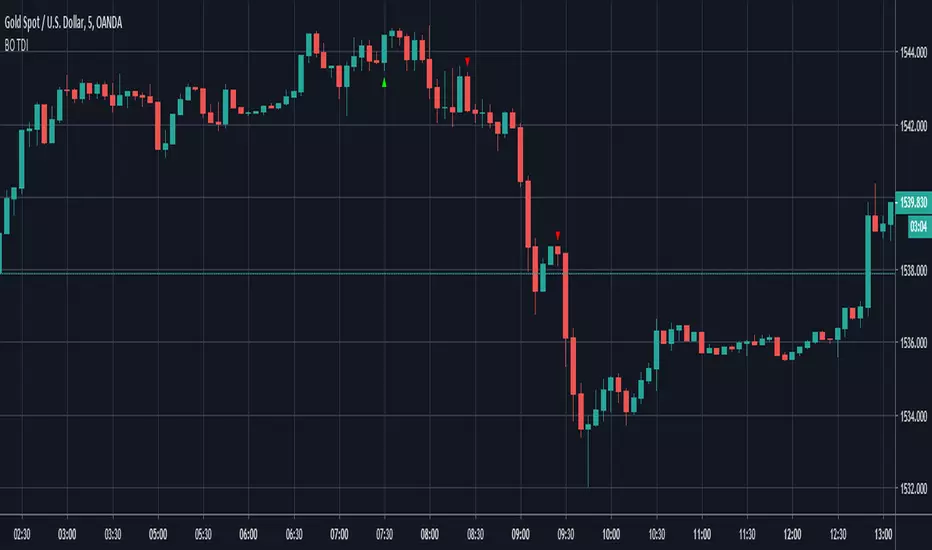
BO TDIBinary Option strategy based on TDI indicator, Put or Call at the beginning of the next candle, expire 5m for 5m candle.

Binary Fisher [Orderflowing]Binary Fisher | Adaptive Fisher Transform | Adaptive Bands | Smoothing (+) | Customizable (+)
Built using Pine Script V5.
Introduction
The Binary Fisher is a tool that transforms your traditional market analysis.
This indicator is for traders seeking a dynamic and responsive view of market turning points.
Innovation and Inspiration
Drawing inspiration from John Ehlers, the Binary Fisher represents a step forward.
It redefines the Fisher Transform with more features and customization, which gives traders a unique lens for analysis.
Core Features
Adaptive Length Calculation: Binary Fisher can operate in both fixed and automatic length modes.
Smoothing Options: Choose from EMA, HMA, SMA, Fourier, or no smoothing for the Fisher values, the indicator bends to your analytical preference.
Adaptive Bands: Visualize market extremes with adaptive bands, smoothed using EMA, HMA, SMA, or Fourier methods.
Trend Shift Detection: The indicator identifies bullish, bearish, and neutral shifts in market trends, providing early signals for potential reversals.
Experimental Divergence Analysis: Detect divergences between price and Fisher values, a key indicator of potential trend changes.
Band Lines: Projects band lines around the Fisher values, offering a way to analyze the interaction between the Fisher line and these bands to project the trend of the fisher transform.
Functionality
Input Source: Choose from various price data inputs like close, open, high, low, and more for Fisher calculations.
Hilbert Transform for Dominant Cycle Period: Utilizes Hilbert Transform to dynamically adjust to the dominant market cycle.
Custom Thresholds and Bands: Set your thresholds for trend shifts and adjust band multipliers for personalized sensitivity.
Visualization: The indicator has a color system for easy understanding of the trend according to the fisher transform.
Multi-Timeframe: Apply the Binary Fisher across different timeframes, and chart them from another. Great for different timeframe strategies.
Example of Band Lines:
Example of Multi-Timeframe (1D Calculation / 4H Chart):
Analysis and Interpretation
The Binary Fisher helps the trader get a simpler view of market pivots.
The flexibility allows for better identification of overbought and oversold conditions, trend shifts, and potential reversal points.
The color system and visual markers make it easy to interpret quickly.
Usage and Applications
Instrument Trend Analysis: Understand the direction and strength of market trends.
Reversal Prediction: Identify potential reversal points with trend shift dots and divergence detection.
Trading Strategy: Adapt the indicator settings to align with your unique trading style and risk tolerance.
Conclusion
The Binary Fisher indicator stands out as innovative trading technology.
It is a powerful tool for traders born by enhancing the Fisher Transform with adaptive features and modern analysis methods, with lots of customization options.
The Binary Fisher should be used as part of a larger trading strategy.
Never make trading decisions based on the signals of the Binary Fisher alone.

Binary Strategy (with SMI logic)🧠 How to Use:
Chart Timeframe: 5-minute
Setup: Wait for an arrow to appear
Green arrow = BUY a 20-min binary in uptrend with positive momentum
Red arrow = SELL a 20-min binary in downtrend with negative momentum
SMI Logic: Entry only when SMI crosses its signal line in the trend direction and above/below zero
Works for Nadex 20-Minute $&P 500 Binary
If long at 75 get out at 50, or if short at 25 get out at 50. This allow you to be trading at a 1:1 ratio. (Approx.)

Binary Options Time/Price Entry HelperFor those who like to trade the Nadex 5 minute binary options.
✅ Features:
Marks the start of every 5-minute candle (HH:00, HH:05, HH:10, etc.)
Highlights price action signals:
Bullish Engulfing
Bearish Engulfing
Long rejection wicks (potential reversals)
Designed for 1-minute charts
Ideal for manual binary entries
Look for:
🔽 Gray markers: start of a 5-min cycle
🟩 CALL or 🟥 PUT: bullish or bearish engulfing
🟢 or 🟠 circles: strong rejection wicks
You can take off the 5 minute chart cycle markers and the rejection wick markers for a clean looking chart.
Jump in the trade when the call/put arrows appear. These can be fast moving trades. Be prepared to exit if need be. Nadex lets you exit at any time.
Example: if you enter a call around $75 you can get out at $50 if the trade goes against you. If you enter a put around $25 and the trade goes against you, exit at $50, or as close as possible. If you do this it will keep your rr close to 1:1 - this is VERY important for these trades.
I'm not responsible for how you do on these trades. I've only used it for EURUSD, but it works well. Test it on all the 5 minute binaries if you want and see what you think.
Don't wear yourself out on these. Nadex has 5 minute binaries continuously. Work at it for a couple hours and get good. You can collect the $25 premium several times a day. Just get out if it moves against you.

Binary Options Pro Helper By Himanshu AgnihotryThe Binary Options Pro Helper is a custom indicator designed specifically for one-minute binary options trading. This tool combines technical analysis methods like moving averages, RSI, Bollinger Bands, and pattern recognition to provide precise Buy and Sell signals. It also includes a time-based filter to ensure trades are executed only during optimal market conditions.
Features:
Moving Averages (EMA):
Uses short-term (7-period) and long-term (21-period) EMA crossovers for trend detection.
RSI-Based Signals:
Identifies overbought/oversold conditions for entry points.
Bollinger Bands:
Highlights market volatility and potential reversal zones.
Chart Pattern Recognition:
Detects double tops (sell signals) and double bottoms (buy signals).
Time-Based Filter:
Trades only within specified hours (e.g., 9:30 AM to 11:30 AM) to avoid unnecessary noise.
Visual Signals:
Plots buy and sell markers directly on the chart for ease of use.
How to Use:
Setup:
Add this script to your TradingView chart and select a 1-minute timeframe.
Signal Interpretation:
Buy Signal: Triggered when EMA crossover occurs, RSI is oversold (<30), and a double bottom pattern is detected.
Sell Signal: Triggered when EMA crossover occurs, RSI is overbought (>70), and a double top pattern is detected.
Timing:
Ensure trades are executed only during the specified time window for better accuracy.
Best Practices:
Use this indicator alongside fundamental analysis or market sentiment.
Test it thoroughly with historical data (backtesting) and in a demo account before live trading.
Adjust parameters (e.g., EMA periods, RSI thresholds) based on your trading style.

Binary Sniper StrategyBy using this indicator you can better view the MA indicators used by this strategy, as well as specifically waiting for the cross and close which gives you easy access to an arrow as one of the confirmations and having the ability to setup alerts on the flip so you can easily monitor multiple pairs at the same time, the Bands give you a general idea of the market flow, and volatility.
The Long Term EMA gives you higher probability trend for a easier binary clear, potentially without the need for a rollover.
This is best used alongside:
- Stochastic Indicator with the Settings of (5,3,3)
The confirmations are :
- Are we Above or Below the Long Term Trend EMA - (Above = 1 Confirmation for the Buy, Below = 1 Confirmation for the Sell)
- Are we at the Low or the High of the Bands ( Low = 1 Confirmation for the Buy, High = 1 Confirmation for the Sell)
- Are the MAs crossed up or down( Cross Up = 1 Confirmation for the Buy , Cross Down = 1 Confirmation for the Sell)
- Are we coming out of the Oversold or Overbought areas on the Stoch (Oversold = 1 Confirmation for the Buy, OverBought = 1 Confirmation for the Sell)
- Is the 15 min in Confluence ? = (Yes = 1 Confirmation in either direction)
Once You have at least 3 Confirmations one of them having to be the MA cross arrow popping up, you have a valid trade setup on the open of that candle, for Binary options, I personally like to wait a little bit after the arrow candle opens to potentially get a slight pullback so that i can buy/sell with a slightly better entry that i don't have to rollover on, I usually aim for 3 min clears, but sometimes i have to rollover.

Binary Options : Call & Put Signals - RoshanJThis Script is created for Trading Binary Options, It's easy to use this script, It gives Call and Put signals by showing a circle below or above the candle in white or red colour.
The Expiry for Binary Options Trade will be 1 Candle of the Timeframe i.e. if the user is using 1minute timeframe for the chart analysis than the expiry will be 1minute.
Taking Call Trade : Whenever a White coloured circle is seen below the Bullish Candle(Signal Candle), take the trade at the start of the next candle for 1minute i.e. after the signal candle has ended.
Taking Put Trade : Whenever a Red coloured circle is seen above the Bearish Candle(Signal Candle), take the trade at the start of the next candle for 1minute i.e. after the signal candle has ended.

Binary /Fx Fibonacci Bollinger BandsBinary /Fx Fibonacci Bollinger Bands
Very Strong, Powerful Indicator that is great for Binary Options and Forex traders.
This System is fantastic allowing my students to achieve quick easy profits with minimal effort. I have been working on this kind of system for over 3 years and now think that it's time to spread the work a little and help others.
This System uses the same effect as the famous Bollinger Bands but also incorporates Fibonacci into it too. I found that this creates an extremely accurate entry and exit points. After years of testing, I have found nothing like it.
Plus its really easy to use! :
First, do not take any trades until the candles hit either the top or bottom band.
Then, depending on which band is hit will then determine the direction you take a trade.
If the candlesticks hit the Red Line Sell/Put.
If the candlesticks hit the Green Line Buy/Call.
An effective money management system is required in order to increase your success rate.
That is all, please let me know if you are interested in testing the system and if you have any questions, also, please share.
I hope to hear how you get on with my system and wish you all the best.
Thanks :)

Binary Options v3.2This strategy is used for backtesting event contract binary options with 180 days of ETH 1-minute data. Win rate 63.3, number of orders 13060, parameters can be adjusted for different market conditions

Binary Signals - MnetfGives binary options signals on NASDAQ.
Signals long or short positions on the current candle in the NAS100 index.
Is mostly perfect for long entry signals

Binary 15 V1 w/ AlertsSo this is my first time coding Pinescript. I used bits and pieces of idea from smarter people like JustUncle, uscgears and Chris Moody.
I then combined bits and pieces and came with my own criteria for Binary Options.
Please use and provide feedback.
Rules:
Fuschia Bar: Sell for next available 15 min expiry
Yellow Bar: Buy for next available 15 min expiry
Notes:
When Stoch is OB/OS avoid trade
Alert Capable
Avoid trading in low volume times or during new releases

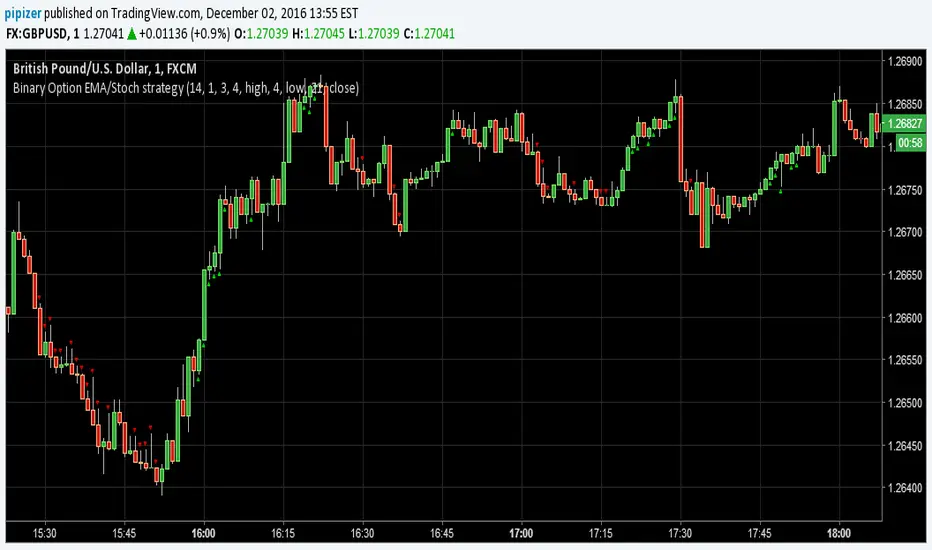
Binary Option EMA/Stoch strategyThis is new Binary Option strategy more signals are generated 60% to 65% win ratio
Binary option trading by two previous barsThis simple script uses the idea of inertia of the market. if 2 previous candles have the same color, current meant to have that too. Following this signal is equal to buying a binary option on the start of the bar (week here). Signals are shown as arrows on the series. The color of the bar shows the outcome of the current option: yellow is success, black is failure. The same outcomes are at the bottom of the chart. The blue line is the total revenue of all options so far. Can be used as template for strategy simulation.

PROFIT_CANDLE_BillionWay_ExclusiveBinaryOptionAndForexHere is the spectacular working Binary option script with Alert condition enabled code.
Tested this with 1min and 5min and proven to be 80% ITM 8 win to loss out of 10 trades.One can use this for Binary option trading for some good win rates.
This is the upgraded version of Read through this before using this updated version.
How it works and How to use this :
1.This can be applied for any time frame ,Best works in 30min ,1hr,1D,W,M -- For BinaryOption 1minchart ,5minchart with 1-2min expiry,5-10min expiry works best.
2.Only Look for the Blue handle to appear in the chart once you see the candle as soon as Enter "CALL in Binary option" ,Now you can enable the Tradingview Alert after the setting so that you get alert and trade (Put option logic not included ,This is only work for Call ,But it can be used for any forex,equity ,currency market)
3.As soon as you sea the blue candle forming Enter Buy (If you see the black candle after the candle made huge high avoid entering the trade at very high level price) and expiry time should be 1-2min for 1min chart, 5 to 10min for 5min chart ,Normally 1plus times of chart frame time.
4.If it is forex or equity Cover the the trade after 2to3 candle for quick profit or keep it for 15-20 candles for good profits ,This gives some false signal as well so this might work only 80%.Be cautious risking your money .
Test it and provide your feedback in the comment section ,Invited user will be given access,Do not comment grant access in comment section ,Send me pvt message in Tradingview.
How to enable the alert
1.First choose the timeframe in which u want to get the alert for example EURJPY 1min chart
2.Go to Tools(Right top corner in Tradingview) Click on the Alerts and then click on the SetAlerts or press Alt+A
3.Now in the "Condition" Choose PROFIT_CANDLE_BillionWay_ExclusiveBinaryOptionAndForex
4.Choose the frequency one per bar and choose other option if you wish and then click on create
--> If you are pro member you can set 10 alerts for various time frame or for 10 differrent currency pair which will alert on live time to enter call
if you atleast get 3call in an hour from each script in 10script ,30calls you would trade in an hour and if the win rate is 70% you would go with good money every time.
Please post your valuable feedback so that it will help others too. Happy Trading Happy Earning.
Published on 12-08-2018 12PM
Here is the spectacular working Binary option script with Alert condition enabled code.
Tested this with 1min and 5min and proven to be 80% ITM 8 win to loss out of 10 trades.One can use this for Binary option trading for some good win rates.
This is the upgraded version of Read through this before using this updated version.
How it works and How to use this :
1.This can be applied for any time frame ,Best works in 30min ,1hr,1D,W,M -- For BinaryOption 1minchart ,5minchart with 1-2min expiry,5-10min expiry works best.
2.Only Look for the Blue handle to appear in the chart once you see the candle as soon as Enter "CALL in Binary option" ,Now you can enable the Tradingview Alert after the setting so that you get alert and trade (Put option logic not included ,This is only work for Call ,But it can be used for any forex,equity ,currency market)
3.As soon as you sea the blue candle forming Enter Buy (If you see the black candle after the candle made huge high avoid entering the trade at very high level price) and expiry time should be 1-2min for 1min chart, 5 to 10min for 5min chart ,Normally 1plus times of chart frame time.
4.If it is forex or equity Cover the the trade after 2to3 candle for quick profit or keep it for 15

Implied Volatility Rank & Model-Free IVRThis is an update to my previous IV Rank & IV Percentile Script.
I originally made this script for binary/digital options, but this also can be used for vanilla options too.
There are two lines on this script, one plotting Model-Based IV rank and Model-Free IV Rank.
How it works:
Model-Based IV Rank:
1. Take whatever timeframe you're using and multiply it by 252. This is done because typically IV is calculated over a year, which has 252 days. But this can be used for any timeframe, so just multiply you're timeframe by 252. In the picture above I'm using a 30 min chart, so I multiplied 30 min by 252 and got 7 days, 14 hrs , and 30 min.
2. Next input the result you got from step 1 into the corresponding input boxes.
3. Then input the timeframe you are using into the input box labeled timeframe. I'm using 30 min so I put 30.
4.Finally choose the delta that you want to use and input its standard deviation into the input box. There is a list of common deltas and their corresponding standard deviations in the menu so you don't have to go looking them up. Typically 16D or 1 standard deviation is used when calculating IV, but you can choose whichever one you want.
*FYI. For people trading binary/digital options, the delta of a vanilla option is the same as the price of a binary/digital option. This is because the delta is the first-order mathematical derivative of the vanilla option's price, and a binary/digital option is a mathematical derivative of a vanilla option. So when you see the list of deltas and their corresponding standard deviations values, just know that 40D=$40 binary, 30D=$30 binary, 20D=$20 binary, and so on. But again typically the 16D or $16 binary's standard deviation value would be used*
This calculation of IV rank is useful for vanilla option traders who use Tradingview and don't have access to this metric.
This calculation of IV rank is useful for binary/digital option traders using Tradingview because the only two regulated binary options exchanges: the CBOE and Nadex, do not offer advanced options data, such as IV rank. On the CBOE and Nadex only the market-makers have this data, which they get from their own in-house pricing models. So at least now any binary option traders can have the same data as the market makers that they are trading against. Also if your wondering how accurate my pricing model is; just know that I have have compared the prices given by the pricing model to realtime prices on Nadex (live account) and the prices that my model shows for differing strike prices matches the prices that the market-makers set. So the pricing model, upon which this IV rank is based, is accurate.*
Model-Free IV Rank:
This IV Rank is based off the VixFix and just ranks the VixFix's values over the past 252 periods. In the menu you can see the recommended periods for calculating the VixFix, with 22 being the one most people use. This is the exact same methodology used in my original IV Rank script.
Which should you use?
This is up to you and each have their own pros and cons.
The main pro of using the model-free version is that because it does not rely on a pricing model, it does not take as many steps to calculate IV and therefore can update its IV projections much quicker than the model based approach. This is why if you zoom out the model-free version will have a more choppy appearance than the model based.
The main pro of using the model based version is that this is what the overwhelming majority of options traders use, and can be applied to any option delta you want, while the model-free version only calculates IV rank on the 16D aka $16 binary aka 1 standard deviation strike.
