Bollinger Bands Touch MapThis simple script based on Bollinger Bands to collect Touch Point at bandsand display them on the map. Detail of rule as below:
1.Define Touch Point
1.1.Touch Point at Lower Band
+ Key bar:
- Open Price lower than BB lower band, Close Price higher than BB lower band
+ Touch Point:
- Median Price (HL2) of Key bar
1.2.Touch Point at Upper Band
+ Key bar:
- Open Price higher than BB upper band, Close Price lower than BB upper band
+ Touch Point:
- Median Price (HL2) of Key bar
1.3.Zero Point
- Close Price of Current bar
===================================
2.Touch Map
+ Last 5 Touch Point will be show on the map
+ Newest Touch point is numbered as (1) and show at the left of Zero Point
+ Each Point has a label show point's value
===================================
3.Fibonacci
+ Enable: Apply to number of Touch Points indicated
+ Style Up: 0 Level at the bottom
+ Style Down: 0 Level at the top
===================================
4.123 Pattern
+ Pattern: dot 2 and dot 3 at the Top and the Bottom of group 1234
+ M Pattern: dot 3 at the Top of group 135 and at the Bottom of group 234
+ W Pattern: dot 3 at the Bottom of group 135 and at the Top of group 234
===================================
5.Supply Demand Zone
5.1.Supply Zone
+ Supply Zone is area map structure change from upward to downward
+ Supply Zone is limited by 2 dots highest before upward structure broken
5.2.Demand Zone
+ Demand Zone is area map structure change from downward to upward
+ Demand Zone is limited by 2 dots lowest before downward structure broken
============================================================================
6.6.Over Block
6.1.Overbought Block
+ Overbought Block is location Long position covering
+ Ovb Block is limited by higest high and upper band at top of map
6.2.Oversold Block
+ Oversold Block is location Short position covering
+ Ovs Block is limited by lowest low and lower band at bottom of map
===================================
7.RSI Column
+ RSI Overbought is marked by Overbought color
+ RSI Oversold is marked by Oversold color
+ RSI Normal is marked by Normal color
+ Symbol ▲: RSI growing
+ Symbol ▼: RSI falling
===================================
8.Volume Direction
+ Volume growing is marked by Up Color
+ Volume falling is marked by Down Color
+ New Highest Volume on the map is marked by High Color and H Label
+ New Lowest Volume on the map is marked by Low Color and L Label
+ Volume higher than Median level is marked by Up Color and M Label
===================================
9.Useful features
+ Quickly find chart patter: 123, M, W...
+ Quickly find wave patter: I, V, N...
+ Quickly find Key level when moving between different Time Frame
+ Quickly recognize chart is trending or trendless
+ Quickly recognize divergence of Price and Volume
+ Quickly calculate Entry, Stoploss, Takeprofit by using Fibonacci
在腳本中搜尋"bollingerband"

Burgerized MTF BB + Reverse Engineering RSI (RERSI) + Hidden S&RThis is a mod of a script by informanerd that has helped me immensely with my trading setup.
HUGE HUGE HUGE credit to him! Check him out! He gave me permission to publish this and so here I am, sharing it with you. I hope you all like it!
This version is functionally essentially the same - the difference is in visualization choices and automation.
Instead of selecting different timeframes, and thus having to change not one but 4 timeframes manually every time you look at a different time frame on the main chart, I found (with help from the kind community in the Pine Script chat right here on Tradingview!) a method to choose multiples so that you can have consistent results no matter what timeframe you are looking at.
Default is set to multiples of 2, 4 and 8 which is the system I found works best for myself personally.
I also changed visualization - crossovers are now highlighted in the background of the respective bands. By default I have chosen different transparency levels for crossovers then sitting inside the bands. This destroyed the ability to modify colors the old school way in Style tab, but I have added inputs for all the relative settings so you can modify the visual aspect to your hearts content, as I know my colors make most people barf (something I did when I was younger maybe?).
Hope the nice barfs of color help you quickly see trends and reversals - I know they help me! Happy trading, no matter your timeframe! xD

HYE Combo Market [Indicator] (Vwap Mean Reversion+Trend Hunter)Indicator version of the strategy:
* Alerts added.
TIPS AND WARNINGS
1-) The standard settings of this combo script is designed and tested with daily timeframe. For lower timeframes, you should change the indicator settings and find the best value for yourself.
2-) Only the mean vwap line is displayed on the graph. For a detailed view, you can delete the "//" marks from the plot codes in the script code.
3-) This is an indicator for educational and experimental purposes. It cannot be considered as investment advice. You should be careful and make your own risk assessment when opening real market trades using this indicator.

HYE Combo Market [Strategy] (Vwap Mean Reversion + Trend Hunter)In this strategy, I used a combination of trend hunter and vwap mean reversion strategies that I published before.
Trend Hunter Strategy:
Mean Reversion Vwap Strategy:
The results are quite impressive, especially for bitcoin.
While the hodl return for bitcoin was 13419%, the strategy's return in the same period was about 5 times (65000%) of this.
s3.tradingview.com
In this combo strategy, I made some changes to the original settings of the strategies used together and added some more new features.
Trend Hunter Strategy Settings: (Original / Combo)
- Slow Tenkansen Period : 9 / 9
- Slow Kijunsen Period : 26 / 13
- Fast Tenkansen Period : 5 / 3
- Fast Kijunsen Period : 13 / 7
- BB Length : 20 / 20
- BB Stdev : 2 / 2
- TSV Length : 13 / 20
- TSV Ema Length : 7 / 7
* I also added a "vidya moving average" to be used as a confirmation tool to open a long position. (Candle close must be above the vidya line.)
Vwap Mean Reversion Strategy Settings: (Original / Combo)
- Small Vwap : 2 / 8
- Big Vwap : 5 / 10
- Percent Below to Buy : 3 / 2
- RSI Period : 2 / 2
- RSI Ema Period : 5 / 5
- Maximum RSI Level for Buy : 30
* I also added a "mean vwap line" to be used for exits in this part of the strategy. In the original version, when small vwap crossovers big vwap, we close the position, but in this strategy we will wait for the close above the mean vwap.
TIPS AND WARNINGS
1-) The standard settings of this combo strategy is designed and tested with daily timeframe. For lower timeframes, you should change the strategy settings and find the best value for yourself.
2-) Only the mean vwap line is displayed on the graph. For a detailed view, you can delete the "//" marks from the plot codes in the strategy code.
3-) This is a strategy for educational and experimental purposes. It cannot be considered as investment advice. You should be careful and make your own risk assessment when opening real market trades using this strategy.
________________________________________________________
Bu stratejide, daha önce yayınladığım trend avcısı ve vwap ortalamaya geri dönüş stratejilerinin bir kombinasyonunu kullandım.
Sonuçlar özellikle bitcoin için oldukça etkileyici.
Bitcoin için hodl getirisi %13419 iken, stratejinin aynı dönemdeki getirisi bunun yaklaşık 5 katı (%65000) idi.
Bu kombo stratejide, birlikte kullanılan stratejilerin orijinal ayarlarında bazı değişiklikler yaptım ve bazı yeni özellikler ekledim.
Trend Avcısı Strateji Ayarları: (Orijinal / Combo)
- Yavaş Tenkansen Periyodu : 9 / 9
- Yavaş Kijunsen Periyodu : 26 / 13
- Hızlı Tenkansen Periyodu : 5 / 3
- Hızlı Kijunsen Periyodu : 13 / 7
- BB Uzunluğu : 20 / 20
- BB Standart Sapması : 2 / 2
- TSV Uzunluğu : 13 / 20
- TSV Ema Uzunluğu : 7 / 7
* Ayrıca long pozisyon açmak için onay aracı olarak kullanılmak üzere "vidya hareketli ortalama" ekledim. (Mum kapanışı vidya çizgisinin üzerinde olmalıdır.)
Vwap Ortalamaya Dönüş Stratejisi Ayarları: (Orijinal / Combo)
- Küçük Vwap : 2 / 8
- Büyük Vwap : 5 / 10
- Alış İçin Gerekli Fark Oranı : 3 / 2
- RSI Periyodu : 2 / 2
- RSI Ema Periyodu: 5 / 5
- Alış için gerekli maksimum RSI seviyesi : 30
* Stratejinin bu bölümünde pozisyondan çıkışlar için kullanılacak bir "ortalama vwap çizgisi" de ekledim. Orijinal versiyonda, küçük vwap, büyük vwap'ı yukarı kestiğinde pozisyonu kapatıyoruz, ancak bu stratejide, ortalama vwap'ın üzerindeki kapanışı bekleyeceğiz.
İPUÇLARI VE UYARILAR
1-) Bu birleşik stratejinin standart ayarları, günlük zaman dilimi ile tasarlanmış ve test edilmiştir. Daha düşük zaman dilimleri için strateji ayarlarını değiştirmeli ve kendiniz için en iyi değeri bulmalısınız.
2-) Grafikte sadece ortalama vwap çizgisi görüntülenir. Ayrıntılı bir görünüm için strateji kodundaki "plot" ile başlayan satırlarda grafikte görünmesini istediğiniz özelliğin önündeki "//" işaretlerini silebilirsiniz.
3-) Eğitim ve deneysel amaçlı bir stratejidir. Yatırım tavsiyesi olarak değerlendirilemez. Bu stratejiyi kullanarak gerçek piyasa işlem açarken dikkatli olmalı ve kendi risk değerlendirmenizi yapmalısınız.

Moving Average Band Width [CC]The Moving Average Band Width was created by Vitali Apirine (Stocks and Commodities Aug 2021 pg 25) and this is of course an extension based on my previous Moving Average Bands script. For those of you that aren't aware, the Band Width indicator is an indicator that tells you how close the upper and lower bands are to each other which is a great determination of how volatility is increasing or decreasing. This acts as both a trend indicator and a volatility indicator. I have included strong buy and sell signals in addition to normal ones so stronger signals are darker in color and normal ones are lighter. A great buy signal is when you are in an uptrend (so the line is green already) and the indicator line is moving up which means strong underlying volatility.
Let me know if there are any other indicators or scripts you would like to see me publish!

Double Bollinger StrategyFrom "Bitcoin Trading Strategies: Algorithmic Trading Strategies For Bitcoin And Cryptocurrency That Work" by David Hanson.
*Works better with 1hr time frame and some input optimisations.
"Double Bollinger Band Scalping System
Recommended Timeframe: 1 minute or 5 minute *
Required Indicators:
// - RSI with a length of 14 (default settings)
// - Bollinger band #1 settings: Length = 50, stDev = 1 Hide the basis/middle line (basis line not needed for this strategy)
Note: This is the slower bollinger band in the directions
// - Bollinger band #2 settings: Length 20, stDev = 1 Hide the basis/middle line (basis line not needed for this strategy)
Note: This is the faster bollinger band in the directions
Enter Long/Buy Trade When:
// - RSI is above the level 50
// - A candle closes above the top of the faster bollinger band
Enter a long when a candle then closes above the top of the slower bollinger band, and price is above the top of both bands
Place a stop loss under the low of the entry candle Example of a long trade using this strategy
Exit Long Trade When: A candle closes below the top band of the fast bollinger band
Enter Short/Sell Trade When:
// - RSI is below the level 50
// - A candle closes below the bottom of the faster bollinger band
Enter a short when a candle then closes below the bottom of the slower bollinger band, and price is below both bands
Place a stop loss above the high of the entry candle Example of a short trade using this strategy
Exit Short Trade When: Price closes inside the bottom of the faster bollinger band"

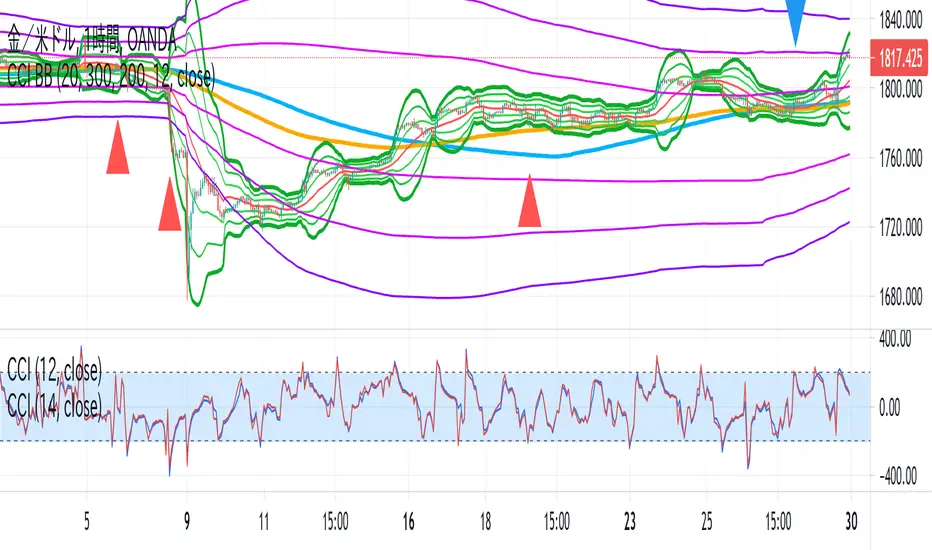
CCI BBThis indicator is the idea of giorno_4_16 .
It shows some indicator lines in your main chart as following:
SMA300, EMA200
BB 20 1,2,3sigma and middle
BB 300 1,2,3sigma and middle
You should put CCI (12, 14) into your separated chart to use the idea.
It shows arrows for registance trading when:
CCI(12) crossovers -200 or corssunders 200 in recent 6bars,
and the price crosses indicator line of SMA200, EMA200 and BB300 1,2,3sigma.
When CCI crossovers -200, you can condisider buying.
When CCI crossunders 200, you can condisider selling.
You should use this indicator in 1H or 4H.
When an arrow appears in 1H, change timeframe to 4H and check the slope of BB20.
If the slope is gentle, take-profit target is MA20 of 1H.
If the slope is steep(ex. CCI crossovers -200 and 4H BB20 go up steeply), take-profit target is BB20 2sigma of 1H.
RSI+ChannelbandsThis Indicator displays a normal RSI with overbought/-sold lines which is calculated with donchian channels, pivot channel, bollinger bands and three horizontal lines.
You can averaged the channels, bands and h-lines in any combination or you can use just one of them for calculating the overbought/-sold lines.
The midline is colored in default settings in yellow for upptrending and blue for downtrending.

Bollinger Bands + ADX Strategy// This strategy uses Bollinger Bands to buy when the price
// crosses over the lower band and sell when it crosses down
// the upper band. It only takes trades when the ADX is
// below a certain level, and exits all trades when it's above it.

[KL] Relative Volume StrategyThis strategy will Long when:
Confirmation #1: when volume is relatively high
Confirmation #2: during periods of price consolidation (See )
It exits when either (a) stop loss limit is reached, or when (b) price actions suggest trend is bearish.
Measuring price volatility to assume consolidation:
For each candlestick, we quantify price volatility by referring to the value of standard deviations (2x) of closing prices over a look-back period of 20 candles. This is exactly what the Bollinger Band (“BOLL”) indicates by default.
Knowing the value of standard deviation (2x) of prices (aka the width of lower/upper BOLL bands), we then compare it with ATR (x2) over a user-defined length (can be configured in settings). Volatility is considered to be low, relatively, when the standard deviation (x2) of prices is less than ATR (2x).

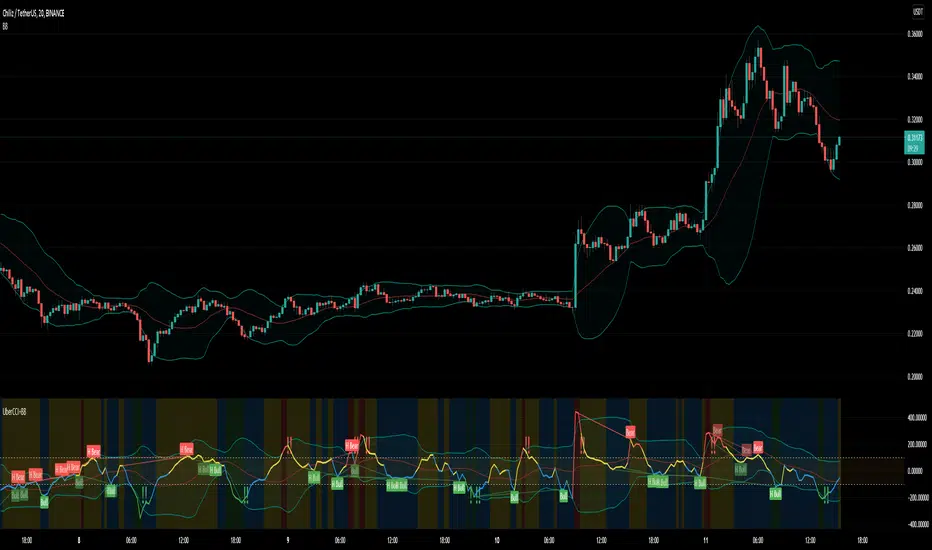
Uber Dank CCI + Captain Beefheart Bollinger Bands ExtraordinareIntroducing, the Uber Dank CCI + Captain Beefheart Bollinger Bands Extraordinaire
Its bollinger bands, CCI and CCI Bollinger Bands all in one.
The color of the CCI shows the condition of the bollinger band on chart.
Close > upper band = red
Close > basis = yellow
Close < basis = blue
Close < lower band = green
Then a bollinger band is printed on the CCI itself,
The background color displays the condition of the CCI bollinger band by the same logic as the CCI color.
CCI > upper band = red
CCI > basis = yellow
CCI < basis = blue
CCI < lower band = green
The exclamation marks tell you when the conditions are coming to an end. They check the last two bars to see if both the CCI and the closing price are under their bollinger bands at the same time for at least one of those bars, and they check the current bar that at least one of those conditions has ended. That is why they will most often print two exclamation marks in a row.
Tradingview ToolkitA new trader's biggest barrier to entry is lack of understanding where they are in terms of time and price and with tradingview free they are often limited to just 1 or 2 extra indicators as many new traders slap on RSI and MACD as 2/3 free ones. While these indicators are fine for trend analysis, its important to know where the price is in relation to time. Thus, this all-in-one script is meant to have a lot of customizable utility to save on indicator spots and act as a hotspot for many common needs.
-2 Sets of VWAP line w/ standard deviation bands with customizable timeframes.
-1 more customizable timeframe VWAP line (no std dev bands) to use as a long time frame reference
-Ability to plot previous VWAP close prices over current timeframe on all VWAP lines w/ basic color changing if price closes above/below
-2 Sets of Bollinger Bands with customizable source length and MA type
-3 customizable moving averages with custom timeframe/resolutions
-Inside candle barcolor repainter to easily notice if a candle was inside the range of the previous candle (price contraction)
Not meant to have everything on at once, but simply a place to enable and disable different things and save spots for more important things

[EURUSD60] BB Expansion StrategyOverview
This is a strategy that can be used in the EURUSD 60 time frame.
It is a trend-following method that uses Bollinger Bands Expansions.
The idea of using Bollinger Bands expansion is well known to the general public, but I don’t know any strategy that this idea has been PINE coded.
The three main components of this strategy are as follows.
・Long term BB and Short term BB : When the short term BB expands more than the long term BB, it suggests the occurrence of a trend.
・14EMA of 240 t/f : The direction of 14EMA of the upper time frame is used as the trend direction.
・ATR lines : As a stop-loss line and a take-profit line.
Description
Fig. Long entry pattern
Fig. Short entry pattern
・Description of lines
Gray : Large BB (=Long term BB)
White : Small BB (=Short term BB)
Blue or Red line : Upper t/f EMA(default: 14EMA), blue is up-trend, red is down-trend
Yellow : Stop loss line by ATR(the term is 14)
Purple : Take profit line by ATR(the term is 14)
・Description of strategy
First of all, when the small BB expands more than the large BB, this strategy detects the occurrence of a trend.
Second, When the price crosses over or crosses under small BB basis, this strategy entries long or short to trend direction (by upper time frame 14EMA).
The default stop-loss range is three times ATR value, and the default take-profit target is 1.5 times the stop-loss range (=risk reward ratio is 1.5).

Advance AMA with Sylvain BandsMany traders believe that the moving averages are favorite tools and analysts have spent decades trying to improve moving averages partiularly the simple moving average. One way to address the disadvantages of moving averages is to multiply the weighting factor by a volatility ratio which is called Adaptive moving averages.
This indicator uses an special adaptive moving averages which is developed by John Ehlers. The model adapts to price movement “based on the rate change of phase as measured by the Hilbert Transform Discriminator”. This method of adaptation features a fast and a slow moving average so that the composite moving average swiftly responds to price changes and holds the average value until the next bars close. In addition, the smoothed Volatility Bands were created by Sylvain Vervoort is included.

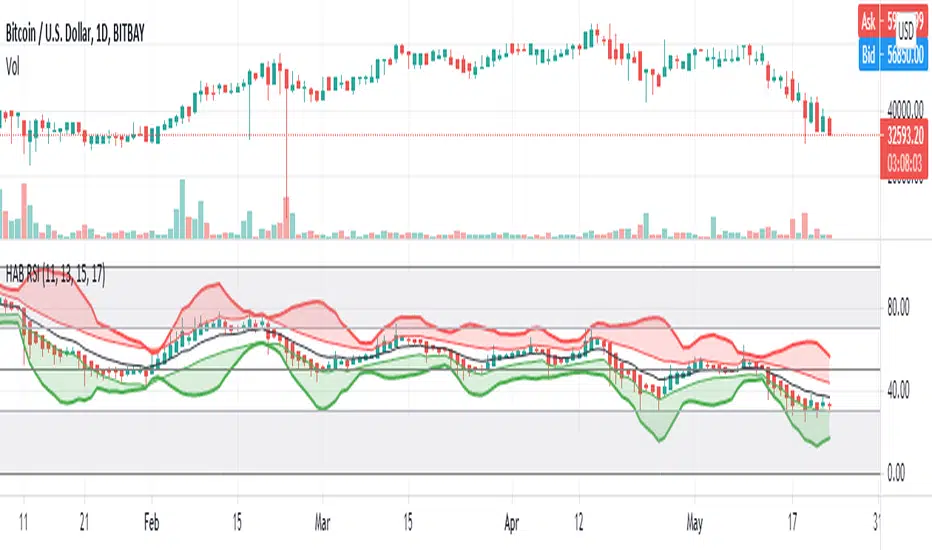
HARSI - HeikinAshi RSI (with Bollinger Bands)This is my first published script. I hope it might be useful!
This is a modified RSI that attempts to give smoother values. It takes 4 different input lengths and plots them in a similar way as Heikin-Ashi candles does.
It can be used in the same way as a regular RSI.
It also includes Bollinger Bands that might help identify overbought/oversold situations.
The script uses a slightly modified Allanster's 'Heikin Ashi source function' (many thanks for that very useful script!).
Easy Entry/Exit Trend Colors (With Alerts)This is an updated version of user Algokid's script called 'AK MACD BB INDICATOR V 1.00'. You can find that original script here:
I added many alerts along with the Bullish and Bearish alerts when the MACD crosses over the Upperband or crosses down on the Lowerband.
I personally use this indicator with Crypto charts (Bitcoin on a 15min, 1hour, and 4 hour timeframe) as one of many confirmations that it's a good time to enter a trade. This script was made to be easy to follow with the colors of GREEN triangles being a good uptrend or entry confirmation, and RED being a confirmation to sell/short or exit your trade.
It's important to use this indicator in combination with other indicators that can give you more confirmations to enter or exit a trade, and make sure you are on normal candles and not HA or any other candles as you can get wildly inaccurate results.
This script also has the Death & Golden crosses, which is the slow and fast moving averages crossing over each other. I don't use this as an additional confirmation, it's just nice to know where the cross happens.

Bollinger Band + RSI + ADX + MACD + HeikinashiThis script takes into picture Bollinger Bands, RSI with a comparator value, ADX with a comparator value, and MACD with Heikinashi Direction
THIS IS A LONG-ONLY STRATEGY. SHORT TRADES ARE NOT INCLUDED
Strategy:
The Strategy takes a trade only after ALL the following conditions are met.
Candle low is lower than the Bollinger Lower band
RSI is higher than the comparator value
ADX is higher than the comparator value
MACD value is higher than the Signal value
Stop Loss : Max of (Low of the candle - 0.22% and Close of the candle - 0.32%) - FYI, because its max, it's lower of the 2 and your risk is lesser
Target : Max of (Bollinger Band Upper band and 0.75% of the value of underlying) - FYI, it takes the maximum available

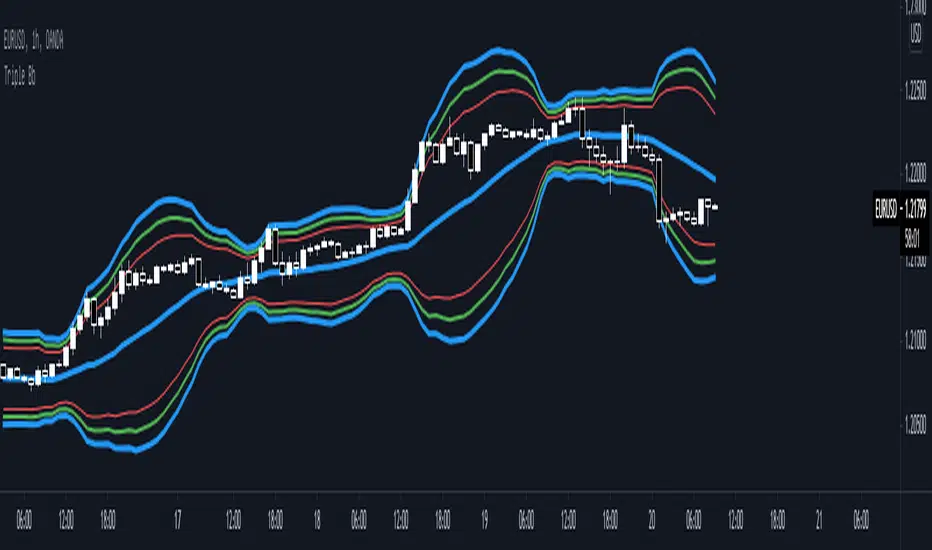
Triple Bb* Triple Bb display maximum 3 Bollinger Bands and each bands could be easily adjust.
* Each Bands Adjustable:
1. Source
2. Period
3. Standard Deviation
4. Color
5. Width
6. Show / Not Show
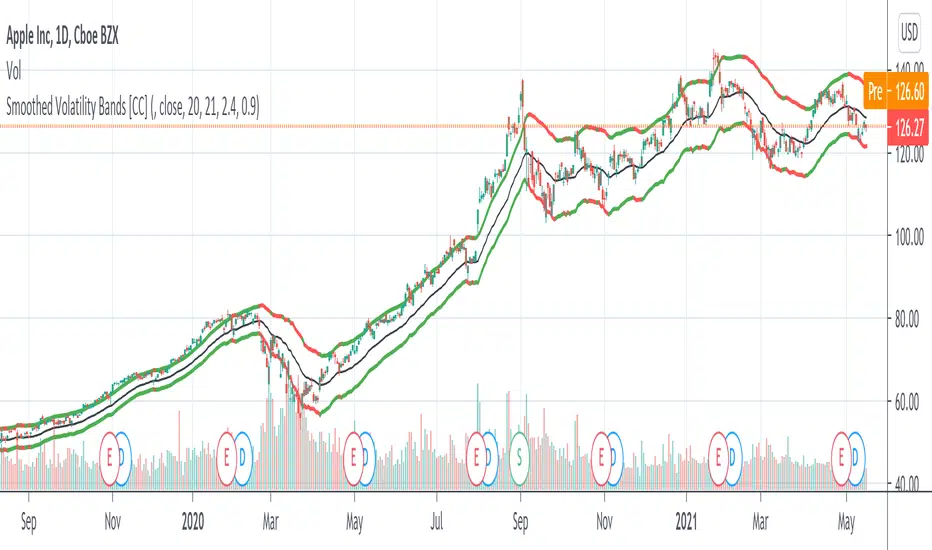
Smoothed Volatility Bands [CC]The Smoothed Volatility Bands were created by Sylvain Vervoort (Stocks and Commodities Sep 2020 pg 19) and this is a heavily customized version of regular Bollinger Bands that take volatility into account. Feel free to change the moving average since Vervoort recommended trying that out. Buy when the indicator line turns green and sell when it turns red.
Let me know if there are any other indicators you want me to publish!
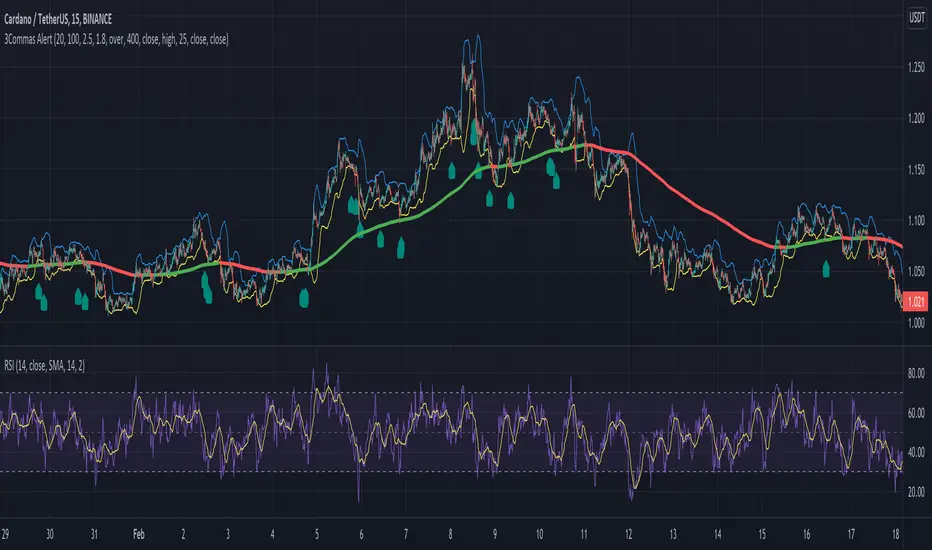
Alert for 3Commas Bollinger StrategyThis is just an alert for the 3Commas Bollinger Strategy written by tedwardd
Rate Of Change Bands [CC]The Rate Of Change Bands were created by Vitali Apirine (Stocks and Commodities March 2021 pg 14) and this indicator is a great method to not only check the momentum but also check the trend strength as well. I have color coded the lines so buy when the line turns green and sell when it turns red.
Let me know if there are any other indicators you want me to publish!

2 Multi-Timeframe Bollinger BandsThis is two separate Bollinger bands in one study. Customizable middle BB line type ( SMA , EMA , VWMA ), legnth, colors, and deviations provided at .5 increments.
Someone else has a very similar Bollinger Band study but the code was hidden, so I figured I would remake as a learning challenge since I'm new to pinescript and this is the best way to learn it imo.
There will be updates to this script in the future but for now it serves its purpose lol. Publishing this version early as I wanted to give some friends access to it
In terms of usage, I like 4h 50 SMA alot . Having two sets of Bollinger bands is nice so you can turn one off or swap between time frames and such. In terms of techniques using both bbands, I haven't really played with it too much yet but simple things like 1h 50sma bbands expanding past the 4h 50sma bbands probably indicate an exaggerated move in that specific time frame, etc etc.
Hope this helps!

Bollinger Bands Bar ColoringThis is a simple script that colors bars/candles based on where price is relative to the basis, and the upper and lower bands of the Bollinger Bands.
If price is above the basis, candles will be colored green, and if price is below the basis, candles will be colored red.
If price is outside of the bands on either side, the candles will be colored a darker shade of either color depending on if it is above or below.
I created this indicator because I like that at a glance I can have an idea of the bullishness or bearishness of price action based on the Bollinger Bands, without actually having the Bands overlayed on my charts.
It's also quite nice because I find that the areas where there is a shift in candle color (especially from green to red and vice versa) aid in identifying levels of support and resistance, and shifts in market structure.
I have another indicator that is a huge modification of the Bollinger Bands %B, which includes the candle coloring (and MAs), but this frees up space on my chart while still providing me with the primary information I'm looking for.
