Smart DCA StrategyINSPIRATION
While Dollar Cost Averaging (DCA) is a popular and stress-free investment approach, I noticed an opportunity for enhancement. Standard DCA involves buying consistently, regardless of market conditions, which can sometimes mean missing out on optimal investment opportunities. This led me to develop the Smart DCA Strategy – a 'set and forget' method like traditional DCA, but with an intelligent twist to boost its effectiveness.
The goal was to build something more profitable than a standard DCA strategy so it was equally important that this indicator could backtest its own results in an A/B test manner against the regular DCA strategy.
WHY IS IT SMART?
The key to this strategy is its dynamic approach: buying aggressively when the market shows signs of being oversold, and sitting on the sidelines when it's not. This approach aims to optimize entry points, enhancing the potential for better returns while maintaining the simplicity and low stress of DCA.
WHAT THIS STRATEGY IS, AND IS NOT
This is an investment style strategy. It is designed to improve upon the common standard DCA investment strategy. It is therefore NOT a day trading strategy. Feel free to experiment with various timeframes, but it was designed to be used on a daily timeframe and that's how I recommend it to be used.
You may also go months without any buy signals during bull markets, but remember that is exactly the point of the strategy - to keep your buying power on the sidelines until the markets have significantly pulled back. You need to be patient and trust in the historical backtesting you have performed.
HOW IT WORKS
The Smart DCA Strategy leverages a creative approach to using Moving Averages to identify the most opportune moments to buy. A trigger occurs when a daily candle, in its entirety including the high wick, closes below the threshold line or box plotted on the chart. The indicator is designed to facilitate both backtesting and live trading.
HOW TO USE
Settings:
The input parameters for tuning have been intentionally simplified in an effort to prevent users falling into the overfitting trap.
The main control is the Buying strictness scale setting. Setting this to a lower value will provide more buying days (less strict) while higher values mean less buying days (more strict). In my testing I've found level 9 to provide good all round results.
Validation days is a setting to prevent triggering entries until the asset has spent a given number of days (candles) in the overbought state. Increasing this makes entries stricter. I've found 0 to give the best results across most assets.
In the backtest settings you can also configure how much to buy for each day an entry triggers. Blind buy size is the amount you would buy every day in a standard DCA strategy. Smart buy size is the amount you would buy each day a Smart DCA entry is triggered.
You can also experiment with backtesting your strategy over different historical datasets by using the Start date and End date settings. The results table will not calculate for any trades outside what you've set in the date range settings.
Backtesting:
When backtesting you should use the results table on the top right to tune and optimise the results of your strategy. As with all backtests, be careful to avoid overfitting the parameters. It's better to have a setup which works well across many currencies and historical periods than a setup which is excellent on one dataset but bad on most others. This gives a much higher probability that it will be effective when you move to live trading.
The results table provides a clear visual representation as to which strategy, standard or smart, is more profitable for the given dataset. You will notice the columns are dynamically coloured red and green. Their colour changes based on which strategy is more profitable in the A/B style backtest - green wins, red loses. The key metrics to focus on are GOA (Gain on Account) and Avg Cost .
Live Trading:
After you've finished backtesting you can proceed with configuring your alerts for live trading.
But first, you need to estimate the amount you should buy on each Smart DCA entry. We can use the Total invested row in the results table to calculate this. Assuming we're looking to trade on BITSTAMP:BTCUSD
Decide how much USD you would spend each day to buy BTC if you were using a standard DCA strategy. Lets say that is $5 per day
Enter that USD amount in the Blind buy size settings box
Check the Blind Buy column in the results table. If we set the backtest date range to the last 10 years, we would expect the amount spent on blind buys over 10 years to be $18,250 given $5 each day
Next we need to tweak the value of the Smart buy size parameter in setting to get it as close as we can to the Total Invested amount for Blind Buy
By following this approach it means we will invest roughly the same amount into our Smart DCA strategy as we would have into a standard DCA strategy over any given time period.
After you have calculated the Smart buy size , you can go ahead and set up alerts on Smart DCA buy triggers.
BOT AUTOMATION
In an effort to maintain the 'set and forget' stress-free benefits of a standard DCA strategy, I have set my personal Smart DCA Strategy up to be automated. The bot runs on AWS and I have a fully functional project for the bot on my GitHub account. Just reach out if you would like me to point you towards it. You can also hook this into any other 3rd party trade automation system of your choice using the pre-configured alerts within the indicator.
PLANNED FUTURE DEVELOPMENTS
Currently this is purely an accumulation strategy. It does not have any sell signals right now but I have ideas on how I will build upon it to incorporate an algorithm for selling. The strategy should gradually offload profits in bull markets which generates more USD which gives more buying power to rinse and repeat the same process in the next cycle only with a bigger starting capital. Watch this space!
MARKETS
Crypto:
This strategy has been specifically built to work on the crypto markets. It has been developed, backtested and tuned against crypto markets and I personally only run it on crypto markets to accumulate more of the coins I believe in for the long term. In the section below I will provide some backtest results from some of the top crypto assets.
Stocks:
I've found it is generally more profitable than a standard DCA strategy on the majority of stocks, however the results proved to be a lot more impressive on crypto. This is mainly due to the volatility and cycles found in crypto markets. The strategy makes its profits from capitalising on pullbacks in price. Good stocks on the other hand tend to move up and to the right with less significant pullbacks, therefore giving this strategy less opportunity to flourish.
Forex:
As this is an accumulation style investment strategy, I do not recommend that you use it to trade Forex.
STRATEGY IN ACTION
Here you see the indicator running on the BITSTAMP:BTCUSD pair. You can read the indicator as follows:
Vertical green bands on historical candles represents where buy signals triggered in the past
Table on the top right represents the results of the A/B backtest against a standard DCA strategy
Green Smart Buy column shows that Smart DCA was more profitable than standard DCA on this backtest. That is shown by the percentage GOA (Gain on Account) and the Avg Cost
Smart Buy Zone label marks the threshold which the entire candle must be below to trigger a buy signal (line can be changed to a box under plotting settings)
Green color of Smart Buy Zone label represents that the open candle is still valid for a buy signal. A signal will only be generated if the candle closes while this label is still green
Below is the same BITSTAMP:BTCUSD chart a couple of days later. Notice how the threshold has been broken and the Smart Buy Zone label has turned from green to red. No buy signal can be triggered for this day - even if the candle retraced and closed below the threshold before daily candle close.
Notice how the green vertical bands tend to be present after significant pullbacks in price. This is the reason the strategy works! Below is the same BITSTAMP:BTCUSD chart, but this time zoomed out to present a clearer picture of the times it would invest vs times it would sit out of the market. You will notice it invests heavily in bear markets and significant pullbacks, and does not buy anything during bull markets.
Finally, to visually demonstrate the indicator on an asset other than BTC, here is an example on CRYPTO:ETHUSD . In this case the current daily high has not touched the threshold so it is still possible for this to be a valid buy trigger on daily candle close. The vertical green band will not print until the buy trigger is confirmed.
BACKTEST RESULTS
Now for some backtest results to demonstrate the improved performance over a standard DCA strategy using all non-stablecoin assets in the top 30 cryptos by marketcap.
I've used the TradingView ticker (exchange name denoted as CRYPTO in the symbol search) for every symbol tested with the exception of BTCUSD because there was some dodgy data at the beginning of the TradingView BTCUSD chart which overinflated the effectiveness of the Smart DCA strategy on that ticker. For BTCUSD I've used the BITSTAMP exchange data. The symbol links below will take you to the correct chart and exchange used for the test.
I'm using the GOA (Gain on Account) values to present how each strategy performed.
The value on the left side is the standard DCA result and the right is the Smart DCA result.
✅ means Smart DCA strategy outperformed the standard DCA strategy
❌ means standard DCA strategy outperformed the Smart DCA strategy
To avoid overfitting, and to prove that this strategy does not suffer from overfitting, I've used the exact same input parameters for every symbol tested below. The settings used in these backtests are:
Buying strictness scale: 9
Validation days: 0
You can absolutely tweak the values per symbol to further improve the results of each, however I think using identical settings on every pair tested demonstrates a higher likelihood that the results will be similar in the live markets.
I'm presenting results for two time periods:
First price data available for trading pair -> closing candle on Friday 26th Jan 2024 (ALL TIME)
Opening candle on Sunday 1st Jan 2023 -> closing candle on Friday 26th Jan 2024 (JAN 2023 -> JAN 2024)
ALL TIME:
BITSTAMP:BTCUSD 80,884% / 133,582% ✅
CRYPTO:ETHUSD 17,231% / 36,146% ✅
CRYPTO:BNBUSD 5,314% / 2,702% ❌
CRYPTO:SOLUSD 1,745% / 1,171% ❌
CRYPTO:XRPUSD 2,585% / 4,544% ✅
CRYPTO:ADAUSD 338% / 353% ✅
CRYPTO:AVAXUSD 130% / 160% ✅
CRYPTO:DOGEUSD 13,690% / 16,432% ✅
CRYPTO:TRXUSD 414% / 466% ✅
CRYPTO:DOTUSD -16% / -7% ✅
CRYPTO:LINKUSD 1,161% / 2,164% ✅
CRYPTO:TONUSD 25% / 47% ✅
CRYPTO:MATICUSD 1,769% / 1,587% ❌
CRYPTO:ICPUSD 70% / 50% ❌
CRYPTO:SHIBUSD -20% / -19% ✅
CRYPTO:LTCUSD 486% / 718% ✅
CRYPTO:BCHUSD -4% / 3% ✅
CRYPTO:LEOUSD 102% / 151% ✅
CRYPTO:ATOMUSD 46% / 91% ✅
CRYPTO:UNIUSD -16% / 1% ✅
CRYPTO:ETCUSD 283% / 414% ✅
CRYPTO:OKBUSD 1,286% / 1,935% ✅
CRYPTO:XLMUSD 1,471% / 1,592% ✅
CRYPTO:INJUSD 830% / 1,035% ✅
CRYPTO:OPUSD 138% / 195% ✅
CRYPTO:NEARUSD 23% / 44% ✅
Backtest result analysis:
Assuming we have an initial investment amount of $10,000 spread evenly across each asset since the creation of each asset, it would have provided the following results.
Standard DCA Strategy results:
Average percent return: 4,998.65%
Profit: $499,865
Closing balance: $509,865
Smart DCA Strategy results:
Average percent return: 7,906.03%
Profit: $790,603
Closing balance: $800,603
JAN 2023 -> JAN 2024:
BITSTAMP:BTCUSD 47% / 66% ✅
CRYPTO:ETHUSD 26% / 33% ✅
CRYPTO:BNBUSD 15% / 17% ✅
CRYPTO:SOLUSD 272% / 394% ✅
CRYPTO:XRPUSD 7% / 12% ✅
CRYPTO:ADAUSD 43% / 59% ✅
CRYPTO:AVAXUSD 116% / 151% ✅
CRYPTO:DOGEUSD 8% / 14% ✅
CRYPTO:TRXUSD 48% / 65% ✅
CRYPTO:DOTUSD 24% / 35% ✅
CRYPTO:LINKUSD 83% / 124% ✅
CRYPTO:TONUSD 7% / 21% ✅
CRYPTO:MATICUSD -3% / 7% ✅
CRYPTO:ICPUSD 161% / 196% ✅
CRYPTO:SHIBUSD 1% / 8% ✅
CRYPTO:LTCUSD -15% / -7% ✅
CRYPTO:BCHUSD 47% / 68% ✅
CRYPTO:LEOUSD 9% / 11% ✅
CRYPTO:ATOMUSD 1% / 15% ✅
CRYPTO:UNIUSD 9% / 23% ✅
CRYPTO:ETCUSD 27% / 40% ✅
CRYPTO:OKBUSD 21% / 30% ✅
CRYPTO:XLMUSD 11% / 19% ✅
CRYPTO:INJUSD 477% / 446% ❌
CRYPTO:OPUSD 77% / 91% ✅
CRYPTO:NEARUSD 78% / 95% ✅
Backtest result analysis:
Assuming we have an initial investment amount of $10,000 spread evenly across each asset for the duration of 2023, it would have provided the following results.
Standard DCA Strategy results:
Average percent return: 61.42%
Profit: $6,142
Closing balance: $16,142
Smart DCA Strategy results:
Average percent return: 78.19%
Profit: $7,819
Closing balance: $17,819
在腳本中搜尋"bot"

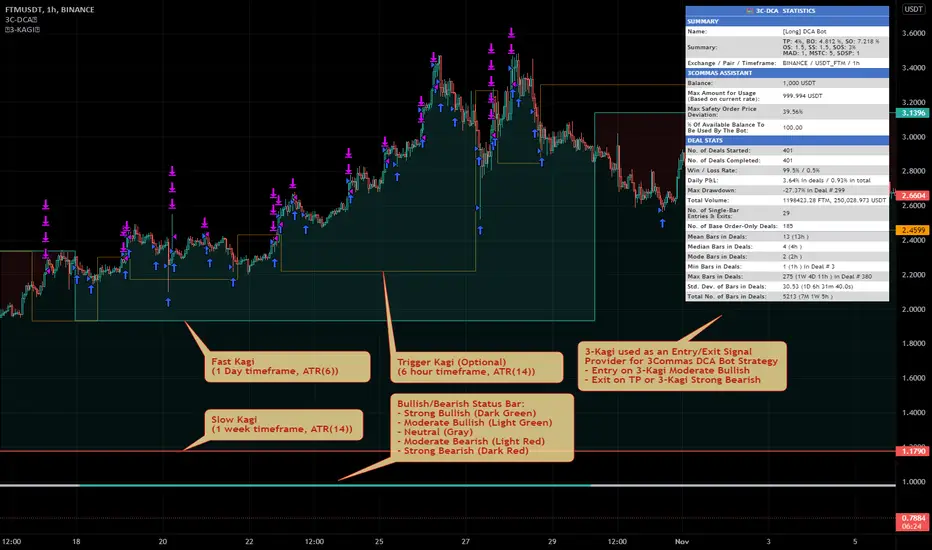
MTF Triple Kagi Indicator v1.0Introduction
The indicator attempts to implement three (3) time-based, multi-timeframe, non-repainting Kagi lines as an overlay to your chart and applying a trend bullish/bearish trend strength evaluation based on the position of the Kagi close prices between the Fast Kagi and Slow Kagi.
How is it original and useful?
This indicator is unique in that it combines a Fast and Slow Kagi timeframes and applies the following trend analysis to determine bullish/bearish strength:
Strong Bullish = when both Fast and Slow Kagi are below the current price and Slow is less than or equal to Fast Kagi.
Moderate Bullish = when both Fast and Slow Kagi are below the current price and Slow is greater than Fast Kagi.
Neutral = when current price is between the Fast and Slow Kagi.
Moderate Bearish = when both Fast and Slow Kagi are above the current price and Slow is less than Fast Kagi.
Strong Bearish = when both Fast and Slow Kagi are above the current price and Slow greater than or equal to Fast Kagi.
In addition, the indicator adds a Trigger Kagi that you can optionally use as a faster Kagi to see more confirmation of trend within the Fast/Slow Kagi combination. It is not used in the bullish/bearish comparison analysis but is simply informative in confirming the trend with a smaller timeframe than the Fast Kagi.
How does it compare to other scripts in the Public Library?
This indicator makes use of the security() function and applies the best-practices as provided by the PineCoders' script called `security()` revisited so that the indicator will not repaint when you refresh the chart or re-open it at a later date. In addition, at the time of initial publishing, this indicator is the only publicly available indicator that combines multiple time-based Kagi lines to offer a simple trend analysis status for short-term or long-term traders.
What does it do and how does it do it?
When applied to the chart for the first time, the default settings will work to produce Kagi lines from the beginning of the chart history up to the real-time bar. All three Kagi lines will default to the current chart's timeframe, therefore it is expected that you open the settings and adjust the Fast and Slow Kagi settings to provide the full effects of the indicator's features. The example chart above is using a 1-Hour chart with a Fast Kagi of 1 day (ATR(6)), a Slow Kagi of 1-Week (ATR(6)) and a Trigger Kagi of 6-Hours (ATR(14)). These settings are not universal for all markets; thus, it will require trial and error adjustments to tune the indicator to the specific market you are evaluating.
Lastly, the example chart above is illustrating how this indicator could be used with the 3Commas DCA Bot Strategy to provide entry and exit signals to simulate a bot's performance using the powerful Strategy Tester within TradingView to further evaluate the indicators influence on hypothetical trading conditions. The indicator provides a plot data point called "Kagi Bullish/Bearish Signal" that can be used in other chart strategies as a signal provider. The following is the meaning of the numeric signal value for this data point:
Strong Bullish = 2
Moderate Bullish = 1
Neutral = 0
Moderate Bearish = -1
Strong Bearish = -2
Enjoy! 😊👍
ATR and IV Volatility TableThis is a volatility tool designed to get the daily bottom and top values calculated using a daily ATR and IV values.
ATR values can be calculated directly, however for IV I recommend to take the values from external sources for the asset that you want to trade.
Regarding of the usage, I always recommend to go at the end of the previous close day of the candle(with replay function) or beginning of the daily open candle and get the expected values for movements.
For example for 26April for SPX, we have an ATR of 77 points and the close of the candle was 4296.
So based on ATR for 27 April our TOP is going to be 4296 + 77 , while our BOT is going to be 4296-77
At the same time lets assume the IV for today is going to be around 25% -> this is translated to 25 / (sqrt (252)) = 1.57 aprox
So based on IV our TOP is going to be 4296 + 4296 * 0.0157 , while our BOT is going to be 4296 - 4296 * 0.0157
I found out from my calculations that 80-85% of the times these bot and top points act as an amazing support and resistence points for day trading, so I fully recommend you to start including them into your analysis.
If you have any questions let me know !

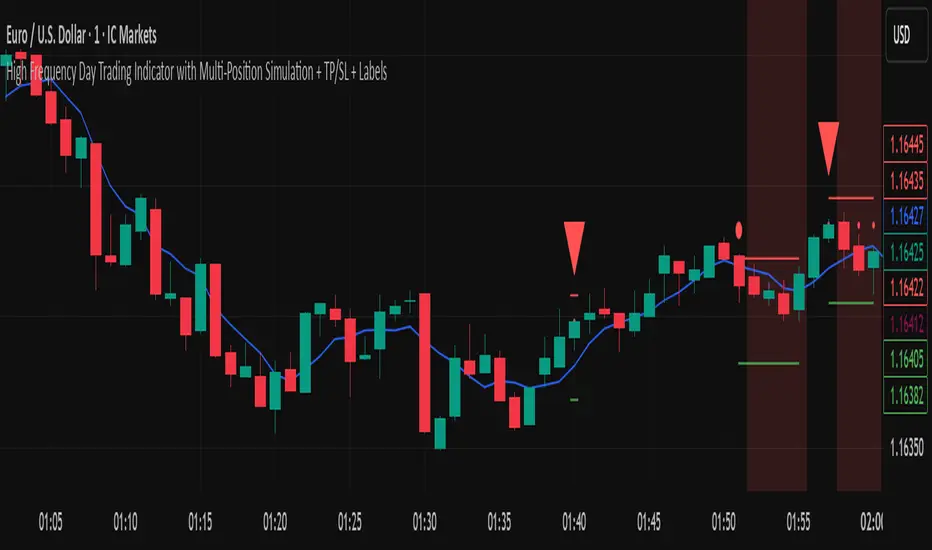
High Frequency Day Trading IndicatorMentioned Indicator uses RSI, Stoch RSI, SMA, EMA, SMMA, Double EMA to check for quick buying and selling areas for Day Trading.
For utilizing the tool, you'll need to wait for a Possible Trend Reversal (Represented by Triangle) and a confirmation to go Long by using a combination of Moving Averages which are then represented by circular dots on chart upon Bar Closure.
For Stop Loss once can simply place a Stop below/above the last Low/High respectively.
This trading Indicator is only recommended for high frequency trading on smaller time frames if you're using a highly volatile Coin/Asset Class.
Disclaimer: Please use this indicator in Test Environment to get a hold of concepts of this indicator. We do not advise using 100% capital for each order, as a matter of fact, we only recommend a risk of upto 1% on each position so Risk to Reward is maintained in proper sense. Please use Stops with all indicators and do not ever use an indicator without stop losses to save your capital.
NOTE: Indicator can be developed further to be used Trading Bots such as 3commas, Autoview, Wunderbit Bot, and Trailing Crypto Bots. For configuration of Automation Bots, you can contact us here on tradingview itself! :)
Bitcoin BanditIntroducing "Bitcoin Bandit".
The market beating trading algorithm for Bitcoin .
"Bitcoin Bandit" buys and sells based on three proprietary indicators:
• Futures contract data
• Accumulation areas and various moving averages.
• Bitcoin hash rate
The indicator is unique because it doesn't give significant weight to historical price to predict future price action; instead it uses BTC hash rate momentum and futures contract data from BTCUSDPERP (transformed through various internal processes) as proxies for sentiment to look for buy and sell zones, then uses accumulation of moving averages as supporting data for signal delivery.
The strategy was built on two years of Binance data and and backtested on five years of Bitcoin data (Coinbase: BTCUSD ).
Finally, the strategy was validated over multiple investment time frames (5 years, 2 years, 1 year) without prior parameter adjustment.
Strategy backtesting checks include:
• 0.60% trading commission fees (the highest possible).
• No Heiken-Ashi candles (to preserve accuracy)
• No Stop-Losses
• Market orders only
The results speak for themselves.
See the positive excess return from the “Bitcoin Bandit” strategy returns versus a simple Bitcoin “Buy-and-Hold” strategy. "Bitcoin Bandit" is designed to function only on the Daily time frame of the BTCUSD trading pair.
Does it Repaint?
• Our indicator does NOT repaint. Although while setting an alert it may pop up the repaint alert, please take into consideration that once a signal is fired on a "CLOSED BAR", the signals will never disappear, they do not repaint.
What Markets is it usable with?
• BTCUSD on the Daily timeframe .
• Bitcoin Bandit can be applied to any chart or altcoin, but results will be unpredictable as this indicator is designed specifically for Bitcoin trading.
How to use:
• Simply plug and play it to your chart. You can also connect TV alerts with a bot and let it run. Please be aware that SLIPPAGE time is important, If you run a bot on this indicator you HAVE to know that the buy/sell price will be on the bar AFTER the Candle close (For example: the BUY/SELL alert is on a candle, the buy/sell your bot or you will execute WILL be in the following candle depending on your trading system. Bitcoin Bandit only works on the Daily timeframe on the BTCUSD trading pair. Please contact us if you do not understand how to use it.
Disclaimer: Nothing stated is financial advice, and is purely for education purposes. We do not promise all trades are profitable, the use of this indicator is up to your own judgement and liability.

Smart Bottom SignalThis indicator is used to find temporary bottoms that are validated with a subsequent candle that closes above the high. The indicator is based on elliott wave theory and tries to signal entries on wave lows. It triggers off of code from " TD D-Wave" 0, 2, 4, A, and C bull wave lows by finding a candle with a close higher that the high of the lowest wave candle or the high of a bullish candle that first breaks above the 8EMA. Green arrows will plot on close indicating that the indicator was triggered.
There are 3 options for display of plots provided:
ShowSmartSigs - This is defaulted to true (display) and allows users to toggle the green arrow alert plots on/off that appear below the candle when triggered.
ShowOnOffPlots - This is logic I use to signal a downturn/upturn and is indicated by red/green arrows appearing above the trigger candle.
ShowBounceSigs - This is defaulted to false and would show as an orange arrow under a candle where a bullish candle first climbs above the 8EMA when ShowOnOffPlots is signaling a downturn and SlowtSochastics is below 21. The SlowStochastics settings are adjustable on the settings screen and default to 21,3.
Alerts Available:
"Smart Buy Bounce" - This alert fires when the ShowSmartSigs signal is triggered.
"Buy Bounce" - This alert fires when the ShowBounceSigs signal is triggered.
"Turn Off Bots"/"Turn On Bots" - This alert fires when the ShowOnOffPlots signals are triggered. I use this to turn off shorter timeframe (15m-1H) bots during a prolonged price drop.
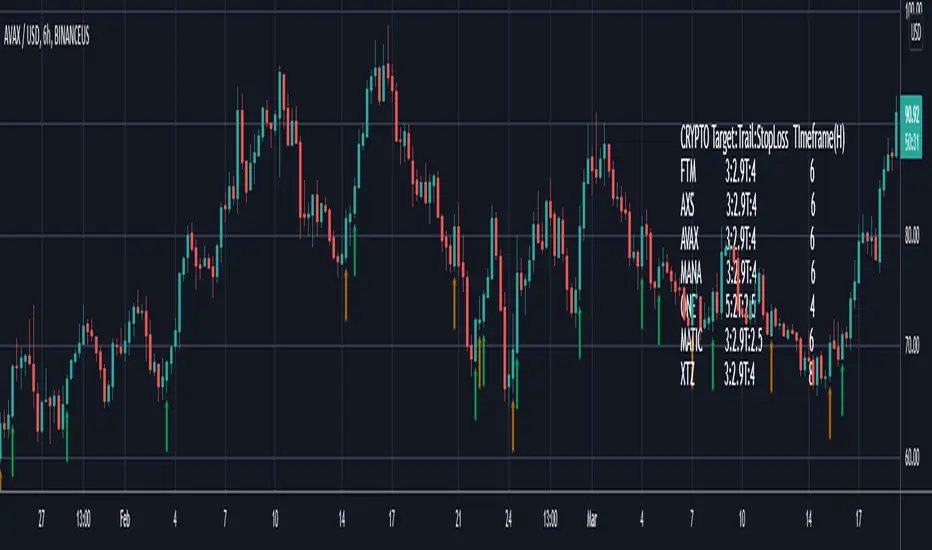
This is an early prototype that is filtered to the following tested cryptos against the specified chart timeframes and using the expressed target/trail/stoploss logic.
CRYPTO Target:Trail:StopLoss TImeframe(H)
FTM 3:2.9T:4 6
AXS 3:2.9T:4 6
AVAX 3:2.9T:4 6
MANA 3:2.9T:4 6
ONE 5:2T:2.5 4
MATIC 3:2.9T:2.5 6
XTZ 3:2.9T:4 8
TrendsThe Trends indicator is created for trend trading and (Bitsgap) crypto bots of crypto assets over longer time periods.
Works best for 4h, Daily and Weekly candles (even Monthly), but unsuitable for hourly candles and day trading.
This indicator shows you if a crypto pair is in a Bear, Bull or Sideways market.
The idea is to simplify decision making when to sell or buy, or what pairs to use with trading bots.
Stick to the rule of not having bots in a Bear trend!
- Blue = Bull trend
- Red = Bear trend
- Green = Sideways trend - which can be profitable with trading bots

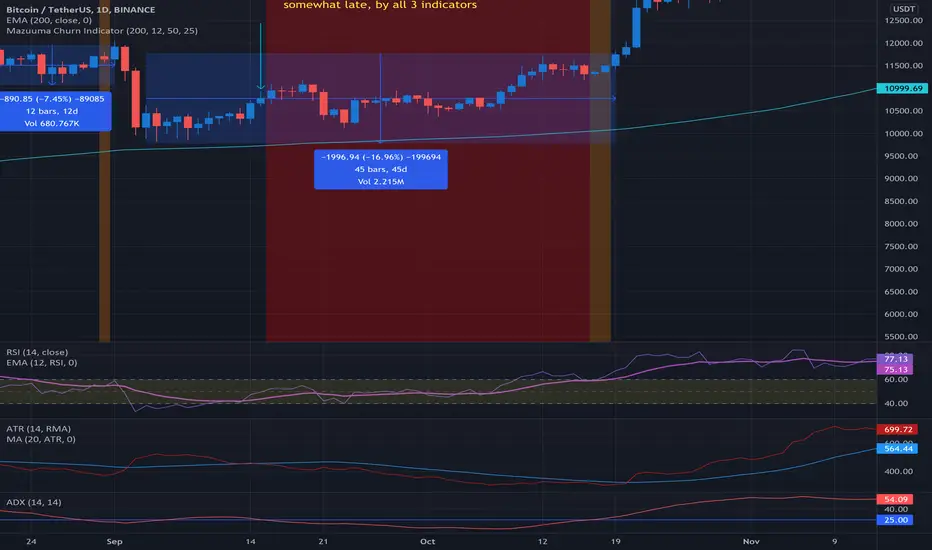
Mazuuma Churn IndicatorThis indicator was specifically made to confirm a periode of sideways movement (churn) on Bitcoin. It can probably be used for other cryptocurrencies as well. I use it on the daily timeframe.
Yellow means "Unconfirmed".
Orange means "Partially Confirmed".
Red means "Confirmed"
The indicator is not perfect, so use your common sense.
Churn starts when at least 2 of the conditions below are met (use also your common sense):
1. ATR < MA 20 on ATR
2. Distance to EMA 200 must be ≤ 16% at “Open churn”
3. EMA 12 on RSI between 40 and 60
4. ADX < 25
The above are weighted. Meaning no 1 has most significance. The numbers can be tweaked.
Reversal coming
* The indicators above break out, especially the ATR
* Color shift of the Heikin Ashi candle on weekly timeframe
* Engulfing candle on weekly timeframe
Because of the offset of the EMA 200, the precision of the Churn predictor can be off after a VERY big spike up or down, e.g. dec 2017. After such a spike use your common sense.
Personally I use this for bot trading, i.e. turn off trend following bots when in sideways market and use grid bots or other means of trading instead.
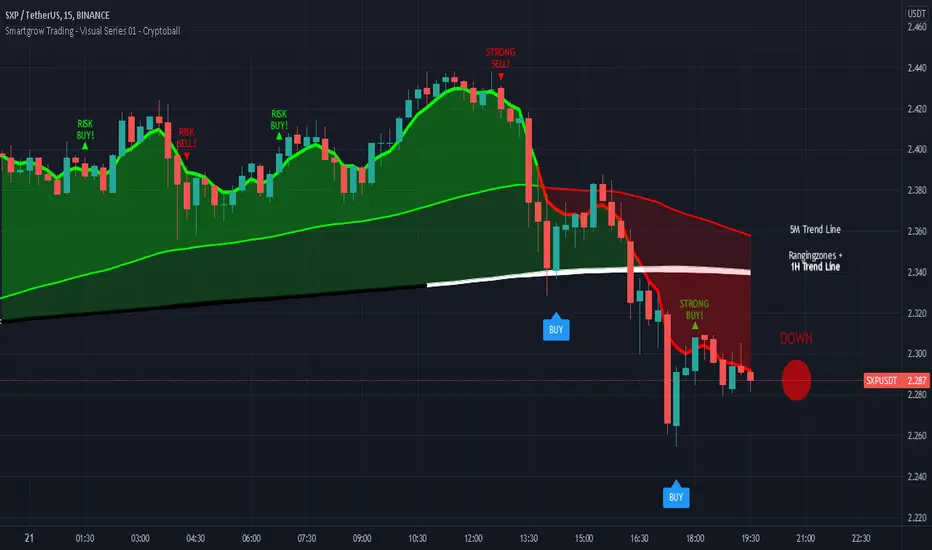
Smartgrow Trading - Visual Series - CryptoballWelcome to our Tradingview buy signal indicator with visual support.
We develop signals which have been specially developed for crypto trading bots. We will publish new indicators at regular intervals.
At the moment our all-in-one indicator includes the following indicators:
- "Crypto Bot Signal 01 - Optimized RSI Momentum"
- "Trading Bot Buy Signal 02 - MTF Stochastic"
- "Trading Bot Buy Signal 03 - MTF StochRSI"
- "Smartgrow Trading - Bearish Power Signals"
The basic idea of this all-in-one indicator is to decrease the needed number of alarms and to provide an all-in-one script for our users trading long direction only. We only include indicators which are relatively robust against false breakouts, even if these can of course never be avoided. These signals alone occur relatively rare, but you can set an alarm up on different pairs simultaneously. The strategy can only be used in 5 min chart and in crypto pairs. It wasnt tested in Forex etc. but feel free to test it.
The main idea behind the signals is to identify strong oversold areas as these have great potential to move in the other direction again. To determine this, we use custom oversold indicators to create buy signals. You could automate these buy signals but we suggest to use these instructions instead:
If an alarm is triggered it is showing points with a strong reversal chance for long signals. We recommend watching the chart closely and finding a good entry point. For visual support, we have visualized the basic trend in color on the one hand. If the 5 minute trend line is above the 1 hour trend line , then there is an upward trend which is marked with a corresponding note. If the 5 minute trend line is below the 1 hour trendline, then there is a downward trend. If you only want to look at the trend line of the 5 minute chart, deactivate the 1 hour trendline in the settings. When the 5 period Exponential Moving Average is higher then the 90 period Exponential Moving Average then the area between them is colored in green, otherwise in red. The same is the case when the 5 period Exponential Moving Average is higher then the 1 hour trendline.
As a second visual support, we have marked volatile zones in the market with the colors black and white. The color black generally denotes a market with low volatility and entry into these areas is therefore not recommended or involves risks. To show potential entry points based on market momentum we added note signs showing either buy or sell spots based on crossovers. If a crossover is within an area of low volatility we marked it as risk buy. if a crossover is within an area of higher volatility we marked it as a strong buy.
To find a good point to exit a trade we added also note signs showing possible sell spots. When these occure an crossover in momentum has allready occured and a potential trend reserval may occur. You could also use this indicator in combination with oversold indicators like RSI or Stochastic to see potential reversal spots when a market is oversold. As a last helper we implemented the Cryptoball on the right side of the chart to vizualize the currently price movement. Therefore it is looking only a few candles back to show you the smoothed price direction. When the color of the indicator is switching from green to red it is a sign that a smaller price drop may occure amd indicates a possible sell.
We sell this indicator so it is invite only. But of cause you can test the single indicators before buying.
If there are questions, write them into the comments or contact us directly over the direct message. Happy Trading!
[ADOL_]ARVIS 4 Whale
ENG) The fourth version of ARVIS BOT This is an upgraded version of ARVIS 4. ARVIS4 🐳(Whale)
- Lighten ARVIS 4 The ARVIS 4 is a bit heavy to compensate for the slow loading, and combines the standards of the new TD .
- By upgrading the coastline, the trend-following notation was changed to be legible, and the signal generation was processed as a background to make it simple.
- Sales statistics output has been added. It enters at the average of the opening and closing prices, and closes at the closing price. As it is liquidated at the closing price, when the bot is driven
It is possible to prevent the situation from entering the section where the signal appears and disappears.
principle)
Features of the new core logic:
- You can set an alert for the TD indicator that could not be set before. TD indicators are numbered 1-9 in Settings - Appearance.
- Setup: Numbers floating above (below) the candle, in ascending and descending order (=sequence) from 1 to 9. Compare with previous candles.
That principle is the part of reasoning that no one explains. I think regularity reflects the theory of the Fibonacci sequence.
The Fibonacci sequence is a number in the golden ratio that makes up nature.
option)
- The indicator plotting range indicates the range in which to display the indicator.
- Setting is for shoreline and breakwater, and is set to the optimum value. It can be used as a basis for support/resistance by breaking through shorelines and breakwaters.
- In Big Trend, the trend judgment standard and trend length are displayed. The trend judgment criteria and trend length based on ICHIMOKU determine the uptrend and the downtrend long.
"You can see the guide by hovering the mouse over ⓘ in the indicator."
- Volume above the average trading volume determines the power of the candle.
- Mark the flow of the stochastic on the candle. Added more filtering of the moving average by augmenting the existing one.
SMA , EMA , HMA , RMA , WMA , VWMA can be selected from the options.
- Added ARVIS 3 version of HTF signal. It is displayed with a light green and red background.
- Real long and real short are key signals. It is displayed on a dark green and red background.
- Fixed an error and signal location where the swing-based heart shot and heart long did not appear at the intersection.
- Super Swing has been added. SS is indicated along the trend direction by the square ( ■ ) at the top.
Principle of core function (Example of picture explanation)
time frame)
- Available in all timeframes.
alarm)
- You can set up alerts for setup, down long, up short, real long, real short, and heart.
trading method)
- Follow the signals Real Long🥝 Short🍅 , Heart Long💚 Short❤ It depends on the color of the background.
- After entering L and S, 9🎯 can be used as a split blade position.
- Follow the downtrend📈🛐 uphill short📉🛐 as the trend criterion. You can change the settings.
- When you select theme 1 in SC , you can use it like Heikin Ashi, and when you select theme 3, you can find overbought and oversold.
reference)
You are solely responsible for all trading decisions and investments you make.
How to use)
It is set to be available only to invited users. When invited, tap Add Indicator to Favorites at the bottom of the indicator.
If you click the indicator at the top of the chart screen and look at the left tab, there is a Favorites tab. Add an indicator by clicking the indicator name in the Favorites tab.
----------------------------------------------------------------------------------------------------------------------------------------------------------------------------------------------------------------
KOR) ARVIS BOT의 네번째 버전 ARVIS 4의 업그레이드 버전입니다. ARVIS4 🐳(Whale)
- ARVIS 4를 경량화합니다. ARVIS 4가 다소 무거워 로딩이 느려지는 부분을 보완하고, 새로운 TD의 기준을 결합합니다.
- 해안선을 업그레이드 하여 추세를 따르는 표기를 가독성 있게 변경하고, 시그널 발생을 배경으로 처리하여 심플하게 구성하였습니다.
- 매매통계 출력이 추가되었습니다. 시가와 종가의 평균으로 진입하며, 종가로 청산합니다. 종가로 청산하므로, 봇구동시
신호가 떴다가 사라지는 구간에 진입이 되버리는 사태를 방지할 수 있게 됩니다.
원리)
새로운 핵심적인 로직의 기능 :
- 기존에 설정할 수 없었던, TD지표의 얼러트를 설정할 수 있습니다. TD 지표는 설정 - 모습에서 1~9까지의 숫자로 나타납니다.
- 셋업 : 캔들위(아래)에 플로팅 되는 숫자로 1~9까지의 오름차순, 내림차순 (=시퀀스)으로 구성됩니다. 4개이전의 캔들과 비교합니다.
해당 원리는 아무도 설명해주지 않는 추론의 부분입니다. 규칙성에는 피보나치 수열의 이론이 반영되어 있다고 봅니다.
피보나치 수열이란 자연을 이루는 황금비율의 숫자로 1.1.2.3.5.8.13.21.34.55.89... n번째와 n+1번째 숫자의 합이 n+2번째가 됩니다.
옵션)
- 지표 플로팅 범위는 지표를 표시할 범위를 나타냅니다.
- Setting은 해안선과 방파제에 관한 설정이며, 최적값으로 설정되어 있습니다. 해안선과 방파제를 돌파, 지지/저항의 기준으로 활용가능합니다.
- Big Trend에서는 추세판단 기준과 추세길이가 표시됩니다. ICHIMOKU기반으로 만들어진 추세판단 기준과 추세길이는 오름숏과 내림롱을 결정합니다.
"지표내 ⓘ 위에 마우스를 올리면 안내를 볼 수 있습니다."
- 거래량 평균이상의 Volume을 캔들의 힘을 가려냅니다.
- 스토캐스틱의 흐름을 캔들에 표기합니다. 기존의 것을 보강하여 더 많은 이평선의 필터링을 추가하였습니다.
SMA , EMA , HMA , RMA, WMA , VWMA 를 옵션에서 선택가능합니다.
- ARVIS 3 버전의 HTF 시그널을 추가하였습니다. 옅은 초록색과 빨간색 배경으로 표시됩니다.
- 리얼 롱, 리얼숏은 핵심적인 시그널이 됩니다. 진한 초록색과 빨간색 배경으로 표시됩니다.
- 스윙 기준의 하트숏과 하트롱이 교차로 출현하지 못하는 오류와 신호 위치를 수정하였습니다.
- Super Swing이 추가되었습니다. SS는 상단의 스퀘어( ■ ) 로 추세 방향에 따라 표시됩니다.
핵심기능의 원리 그림 설명 예시)
타임프레임)
- 모든 시간프레임에서 사용가능합니다.
알람)
- 셋업과 내림롱, 오름숏, 리얼롱, 리얼숏, Heart 에 얼러트를 설정할 수 있습니다.
매매방법)
- Real Long🥝 Short🍅 , Heart Long💚 Short❤ 신호를 따르십시오. 배경의 색상에 따릅니다.
- L, S에 진입후 9🎯 을 분할 익절 자리로 활용할 수 있습니다.
- 내림롱📈🛐 오름숏📉🛐 을 추세 기준으로 따르십시오. 설정값을 변경할 수 있습니다.
- SC에서 테마1을 선택시 하이킨 아시 처럼 사용가능하며, 테마3을 선택시 과매수, 과매도를 찾을 수 있습니다.
참고)
귀하가 내리는 모든 거래 결정과 투자에 관한 것은 전적으로 귀하의 책임입니다.
사용방법)
초대된 사용자만 사용할 수 있도록 설정이 되어있습니다. 초대를 받을 경우, 지표 하단의 즐겨찾기에 인디케이터 넣기를 누릅니다.
차트화면 상단에 지표를 눌러서 왼쪽탭에 보면 즐겨찾기 탭이 있습니다. 즐겨찾기 탭에서 지표이름을 눌러서 지표를 추가합니다.

Multi VWAPMulti VWAP indicator for Wick Hunter
For when you are running out of indicator slots
Can configure each set for Setting 1/2/3, or for Binance bot 1/Binance bot 2/Bybit bot, etc.
By honeybadger, built on original code by STP Todd (see indicator "Wick Hunter VWAP")

Theft Indicator - BUY/SELL AlertsWhat is our indicator?
Theft Indicator - Buy & Sell Alert System is our first published script that shows price action on a certain period of time (We Use ATR indicator). We take pride in enabling trading to become easier for the experienced and the non-experienced traders around the globe. Buy & Sell alerts will be fired once a conditions in our algo is met.
Does it Repaint?
Our indicator does NOT re-paint. Although while setting an alert it may pop up the repaint alert, please take into consideration that once a signal is fired on a "CLOSED BAR", our signal will never disappear, they do not repaint.
What Markets is it usable with?
You can use it in any market, Forex, Stocks, Crypto, Indices. We recommend high time frames but you can also use it on the 1 minute chart if you are a scalper and a risk taker. All time frames are profitable, not all trades. But the Majority is profitable. We will soon add a backtest strategy for it, there is no ETA on it tho.
How to use:
Simple plug and play it to your chart, in addition to a few other indicators we will recommend to you (we still have not published them yet), and this will confirm your trades. You can also connect TV alerts with a bot and let it run. Please be aware that SLIPPAGE time is important, If you run a bot on this indicator you HAVE to know that the buy/sell price will be on the bar AFTER the Candle close (For example: the BUY/SELL alert is on a candle, the buy/sell your bot or you will execute WILL be in the following candle depending on your trading system. Theft Indicator - Buy/Sell Alerts work best with higher time frames, however it works on smaller time frames, we recommend 15 mins, 30 mins, 1hr, 4hr. It just depends on your trading style. Please contact us if you do not understand how to use it.
How are the Buy/Sell Alerts fired?
We use the simple ATR (Average True Range) indicator. However we have modified the indicator to fit our trading system. Check below for a definition of what ATR is:
What is Average True Range - ATR?
The average true range (ATR) is a technical analysis indicator that measures market volatility by decomposing the entire range of an asset price for that period. Specifically, ATR is a measure of volatility introduced by market technician J. Welles Wilder Jr. The true range indicator is taken as the greatest of the following: current high less the current low; the absolute value of the current high less the previous close; and the absolute value of the current low less the previous close. The average true range is then a moving average, generally using 14 days, of the true ranges.
Why is our indicator special and different from the normal ATR indicators?
We have modified the mathematical equation and changed it slightly to give more accurate signals, we do not promise all trades are profitable, the use of this indicator is up to your own judgement and liability. We believe that we have an indicator like no other ATR because of our algo that is different from the normal ATR calculation.
P.S: This is not financial advice, we are just sharing our indicator that we know has good results, and it will take time for people in -ve profiles to recover losses and for the profiting to be more profitable.
You can contact me for more information about the indicator, Goodluck :)

DayTrade - XBTUSD 5m [ALERTSETUP]Plug & Play indicator for BITMEX:XBTUSD in 5 minute timeframe for Manual or Automated Day Trading.
Built upon Cyatophilum Scalping Bot
Backtest below show results over 2 weeks, calculated with a 0.075 % commission fee and using 100% of equity on each trade from 10 000$ inital capital.
> Get access to the Cyatophilum Indicators <
Trends in Black and White'Trends in Black and White' is now rolling out to all of our Pro Community members
What is it for? This is a simple visual indicator designed to help users identify long or short bias. It does not provide direct entries and exits but can be used effectively in combination with Trendmaster Premium and other technical analysis methods.
How do i get access?
This indicator is available as a free extra to all of our Pro community members only.
All of our packages are listed below.
- Premium - $50 - This gives you access to the TrendMaster Premium TradingView indicator (www.tradingview.com), the TrendMaster Premium Binance signal bots and the Premium Discord channels.
- Premium+ - $75 or $25 for existing Premium users - All the benefits of the Premium package, but with added signal bots for Bittrex, Bitfinex and Kucoin exchanges.
- Pro - $100 or $50 for existing Premium users/$25 for existing Premium+ users -Access to 'Trendmaster Premium' and 'Trends in Black and White' indicators. All the benefits of the Premium+ package, but with added signal bots for D1 and H4 Ichimoku TK cross and Ichimoku cloud breakout for Binance.
The mandatory Legal bit:
@IchimokuScholar and @Crypto_C00kie wish you the best of luck in achieving your trading goals. Please apply appropriate risk management.
Any form of trading has large potential rewards but also large potential risks. The Purchaser must be aware of those risks and be willing to accept them. Don't trade with money that you, the Purchaser cannot afford to lose. No representation is being made that you are guaranteed positive results. The past performance of any trading methodology is not necessarily indicative of future results. Trading involves high risks. @TrendmasterTM, @IchimokuScholar or @Crypto_C00kie are NOT responsible for any trades that you, the Purchaser take. All trades taken are entirely at the Purchasers own risk. Refunds are neither offered nor implied.

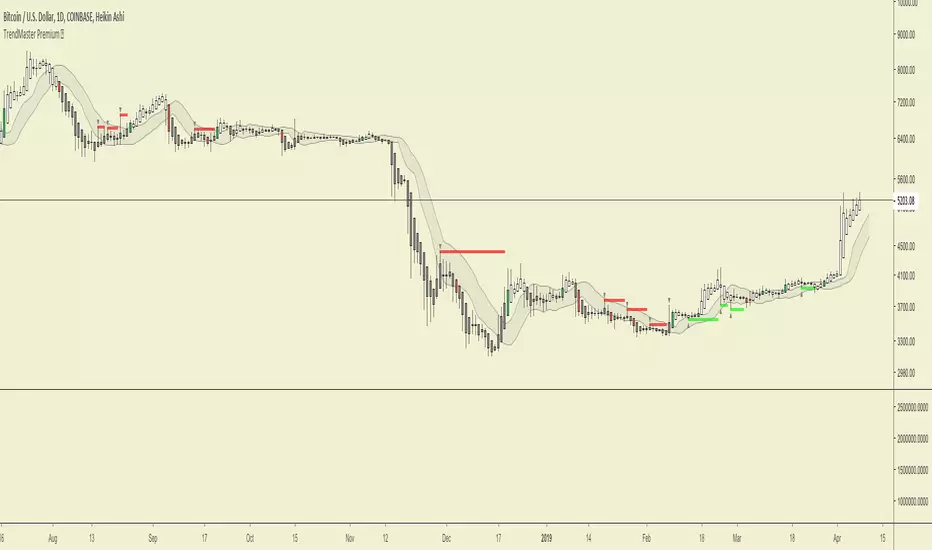
TrendMaster Premium ©Trendmaster Premium©
We are proud to release the final version of Trendmaster Premium©. This indicator is the result of months of development between @TrendmasterTM and @Crypto_C00kie.
Trendmaster Premium© is a Trend following system that provide entries, exits and stop loss placement. It is extremely simple to follow and we have experienced outstanding results.
When purchasing Trendmaster Premium© you will receive access to the indicator suite and access to our private members discord group.
Discord: The discord channel is a place where traders can discuss ideas and share content.
It includes
Bots – The discord channel currently has two bots that constantly scan Binance for signals. They will alert you by notification of any BTC pair that has printed a signal candle. Currently the bots report D1 and H4 signals as these are the time frames the indicator is designed for. These are designed to alert you to possible trades and should NOT be blindly traded from.
Chat – Several chat servers offering educational resources, guidance on how to use the indicator and chart/idea sharing.
The mandatory Legal bit:
@IchimokuScholar and @Crypto_C00kie wish you the best of luck in achieving your trading goals. Please apply appropriate risk management.
Any form of trading has large potential rewards but also large potential risks. The Purchaser must be aware of those risks and be willing to accept them. Don't trade with money that you, the Purchaser cannot afford to lose. No representation is being made that you are guaranteed positive results. The past performance of any trading methodology is not necessarily indicative of future results. Trading involves high risks. Neither @TrendmasterTM or @Crypto_C00kie are responsible for any trades that you, the Purchaser take. All trades taken are entirely at the Purchasers own risk. Refunds are neither offered nor implied.
Study_v8- Used with Autoview… Longs / Margin TradingInvite only…
FREE Access until my bot is built (Target Date…. May 2018).
Only allowing 20 people to use.
Cost will be 10% of any profits made. Minimum account balance being traded must be $1,000.
After my bot is built, this script will ONLY be used with my bot and all access on here (Trading View) will be removed after the final sell trigger is completed!
****Can be used for just Longs.. or for Margin Trading.****
For Longs only.. Settings and Alert condition examples found here:
drive.google.com
For Margin trading... Settings and Alert condition examples found here:
drive.google.com

signal heads-up_Bollinger
signal heads-up_Bollinger
Overview
signal heads-up & slow-trail combines Bollinger-based entries, a predictive Heads-Up (ETA) timer, multi-level TP1–TP5 zones, and a Slow-Trail stop engine that advances gradually to protect profits. It includes compact R/R HUD output and Text/JSON alerts for entries, TP/SL hits, and predictive events.
How it Works
1) Entry Logic (Bollinger)
Modes:
Revert Cross: fade back inside the bands (mean-reversion).
Cross Threshold: momentum/breakout style.
Gating & Safety:
Optional bar-close confirmation to reduce intrabar noise.
Trade Direction gating (Long/Short only).
Per-side cooldown (min bars between entries).
Optional filters (see below).
2) Quality Filters (optional)
HTF Trend Filter: EMA slope from a higher timeframe to favor trades aligned with trend.
BB Width Filter: Require Bollinger Band width (% of price) to lie within a min–max range, avoiding dead zones or extreme noise.
3) Heads-Up (ETA Prediction)
Estimates minutes to the next event by converting price velocity to per-minute terms and projecting distance to a target:
Outside Revert (entry): time to revert from outside band toward re-entry.
Nearest Band Touch: time to touch the closest band.
Basis Cross: time to cross the SMA basis.
Spike Heads-Up: detects when band width is compressed and starting to expand with directional tilt, projecting ETA to a “breakout-ready” width.
Heads-Up is predictive, not a guarantee; it updates each bar as volatility and velocity change.
4) TP Zones (TP1–TP5)
On a new signal, the script draws a ladder of up to 5 horizontal TP levels projected from the signal bar.
Zones can expire after N bars (optional).
The HUD shows R/R to TP1–TP5 for the currently active side.
5) Slow-Trail Stop (the signature)
A “glide, don’t jerk” trailing engine that advances the stop in fractions toward a dynamic target:
Move to BE on TP1: once TP1 is touched, the engine flags BE and eases the stop toward entry (no snap).
Follow TP for SL: after higher TPs hit (e.g., TP3), the stop trails to the previous TP (TP2).
Optional Chandelier Trail: blended into the target.
Pacing & Progress:
Move by fraction (slMoveFraction, e.g., 0.33).
Respect min bars between moves and a hold after moving.
Require ATR-based progress (slMinATRProgress) so the stop only advances when price meaningfully moves.
6) Alerts & HUD
Manual alerts: alertcondition() for BUY/SELL entries.
Auto alerts: alert() for Entry / TP / SL / Heads-Up / Spike with cooldown and optional one-TP-per-bar.
Formats: Text (mobile-friendly) or JSON (for bots/webhooks); optional ZoneID tagging.
HUD: compact table showing symbol/TF, last Entry & SL, R/R to TP1–TP5, alert mode, MaxHit per side, and color-coded HU/Spike lines (NOW / ~Xm).
Key Inputs (high level)
Strategy: Trade Direction, Entry Strategy.
Bollinger: Length, Multiplier.
Filters: HTF EMA slope (TF & length), BB width min/max %.
Stops: Mode (ATR× / Percent / Points), ATR length/mult, Slow-Trail pacing (fraction, min bars, ATR progress, hold), Move to BE on TP1, Follow TP for SL, optional Chandelier.
TP Zones: size multiplier, colors, label side/offset, expiry.
Heads-Up: lookahead minutes, velocity length, HU mode, compression threshold, slope length, directional tilt, NOW/SOON thresholds.
Alerts: manual/auto, JSON vs Text, cooldown, strict-touch, min bars between entries, ZoneID.
How to Use (step-by-step)
Attach & Name
Add the script and keep your preferred signal … title. The short name appears on the chart.
Pick Entry Style
Revert Cross for mean-reversion around bands.
Cross Threshold for momentum continuation.
Choose Risk Basis
Use ATR 14 × 1.5–2.0 as a sensible SL baseline. Enable Move SL→BE on TP1 and Follow TP for progressive protection. Keep slMoveFraction ≈ 0.3 to glide.
Tune Heads-Up
Start with Lookahead = 10 min, Velocity length = 14.
Mode Nearest Band Touch is a solid general default.
Keep Spike Heads-Up on to catch compress-then-expand phases.
Enable Filters (optional)
HTF EMA slope when you want trend alignment (e.g., HTF=60, EMA=50).
BB width filter to skip dead sessions or hyper-chop.
Set TP Ladder
Keep the default zone size multiplier; adjust if your instrument’s range is larger/smaller.
Use zone expiry to avoid stale ladders.
Create Alerts (TradingView)
Choose “Any alert() function call” and Once Per Bar Close if you use close-confirmation.
Pick JSON if you integrate with bots/webhooks; otherwise Text is phone-friendly.
Use cooldown and one-TP-per-bar to reduce noise.
Operate
Watch the HUD: HU line shows BUY/SELL NOW / ~Xm; Spike line hints imminent expansion.
When a signal triggers, TP1–TP5 draw and the Slow-Trail begins pacing the stop forward as price progresses.

The Gain Anchor - Long/Short SignalsThe Gain Anchor – Long/Short Signals (WunderTrading Bot Ready)
Dual Anchored VWAP System Powered by Overbought & Oversold Signals
A high-precision AVWAP and Z-Score system designed to generate Long/Buy and Short/Sell signals.
This indicator is ideal for swing trades and can be used as a standard signal indicator or seamlessly integrated for automated trading with WunderTrading bots.
--------------------------------------------------
Inputs
--------------------------------------------------
• Master Symbol: Sets the symbol used to track market trend. When disabled, the chart’s symbol is used to track its own trend.
• Rolling AVWAP Length: Defines the AVWAP calculation lookback (the bar where calculation starts).
• Minimum Investment Amount ($): Minimum is $6. For WunderTrading, it should not be less than $12.
• Minimum Profit Target ($): Ensures returns are higher than the defined minimum profit.
• Z-Score Lookback: Sets the lookback length for the Z-Score calculation window.
• Z-Score Threshold: Defines the base threshold. (The code auto-adjusts thresholds as more data is processed.)
• Long/Short Strings Input: Enter the alert messages you want to receive. For WunderTrading bots, input your Long Entry, Long Exit, Short Entry, and Short Exit codes.
• Show Other Lines: Displays Rolling AVWAP plot, Take Profit, and Stop Loss lines.
• Table Position: Choose the dashboard placement on your chart.
--------------------------------------------------
Core Logic
--------------------------------------------------
• Z-Score: Detects price deviation from its mean. When the price overextends based on the lookback, AVWAPs are reset.
• Resetting AVWAP 1 / Fast AVWAP (White Line): Uses a weaker threshold.
• Resetting AVWAP 2 / Slow AVWAP (Blue Line): Uses stronger thresholds, confirming and filtering weaker crosses.
• When AVWAP 2 resets, it signals a possible trend change and may generate new signals.
• If AVWAP 2 detects excessively frequent trend changes (high volatility), new signals are automatically disabled.
• Stop Loss and Take Profit are derived from bar distance relative to the lowest AVWAP (longs) or highest AVWAP (shorts).
If this exceeds your minimum investment, the system auto-adjusts the size.
If stop loss is not positioned beyond the AVWAPs, no signal is generated.
--------------------------------------------------
Trade Signals Logic
--------------------------------------------------
The indicator’s signal mechanism is designed to prevent overtrading during
high volatility.
- Signals are disabled when a sudden surge in volatility is detected.
- Only one signal is generated per legitimate trend change.
- Example:
• When the trend switches to bullish, only one Long signal is given.
• Once that Long position is closed (profit or loss), no new signal will be issued until another valid trend change occurs.
• The same logic applies to bearish/Short positions.
This ensures that signals remain clean, infrequent, and aligned with real trend shifts rather than noise.
--------------------------------------------------
Take Profit & Stop Loss
--------------------------------------------------
• Take Profit has two levels:
1. First Level: Triggered when the trend changes and price is below the first TP level.
2. Second Level: Triggered if the price surges into the second TP level.
The position is closed on whichever condition is met first.
• On Scale:
- Take Profit (Gray Line): Rolling take profit value.
- Stop Loss (Maroon Line): Rolling stop loss value, auto-calculated as half the minimum profit.
- Gray Stop Loss and Take Profit: Rolling Stop Loss and Take Profit purpose is mainly for manual trading but when they are both gray it is not ideal to look for an entry.
• On Chart:
- Take Profit: Lime (Longs), Fuchsia (Shorts). Fixed from signal start until triggered.
- Stop Loss: Yellow (Longs), Maroon (Shorts). Fixed from signal start until triggered.
- You have to activate "Show Other Lines" in Input to see them
--------------------------------------------------
Signal Markers
--------------------------------------------------
• 👆 = Long Entry
• Green Dot = Long Exit (TP/SL)
• 👇 = Short Entry
• Fuchsia Dot = Short Exit (TP/SL)
• 💥 = Bullish Trend
• 🔥 = Bearish Trend
--------------------------------------------------
Backtest System
--------------------------------------------------
• Displays the number of days since the first trade/backtest.
• Shows trade count, win rate, net profit/loss.
• Useful for real-time analysis and alert validation.
--------------------------------------------------
Dashboard Overview
--------------------------------------------------
Row 1 (Per Symbol):
• Column 1: Win Rate + Total Trades / Wins / Losses
• Color Modes: Blue = Win rate rising and it's 50 or higher. Brown = Win rate falling and it's 50 or higher. Grey = Falling and less than 50
• Column 2: Backest - number of days since the first trade
• Column 3: Net Profit + Total Profit / Total Loss
• Color Modes: Red = Loss greater than Profit , Green = Net Profit exceeds minimum profit x Total Trade Won, Brown = Profit greater than Loss but high bad trades
• Column 4: Investment Amount + Minimum Profit | Gain % to Target
• Color Modes: Signal State: Lime = Long, Maroon = Short, Yellow = Both Active
--------------------------------------------------
Usage Notes
--------------------------------------------------
• Works for manual or automated execution.
• Fully compatible with WunderTrading’s JSON alert format (and any platform using the same format).
• Can also be used standalone with no dependencies.
• Dashboard and auto-calculated SL/TP make it flexible across all trading styles.
• Minimum Investment Amount affects SL/TP size and therefore win rate.
• Increasing Minimum Profit increases potential profit but also increases loss size.
• Loss-to-Win ratio is always 1:2+, meaning your wins are at least double your losses.
• Optimized for 1-minute timeframe. Other timeframes may also yield desirable results.
--------------------------------------------------
⚠️ Disclaimer
--------------------------------------------------
This indicator does not constitute financial advice or a trading recommendation.
All trading involves risk. Past performance does not guarantee future results.

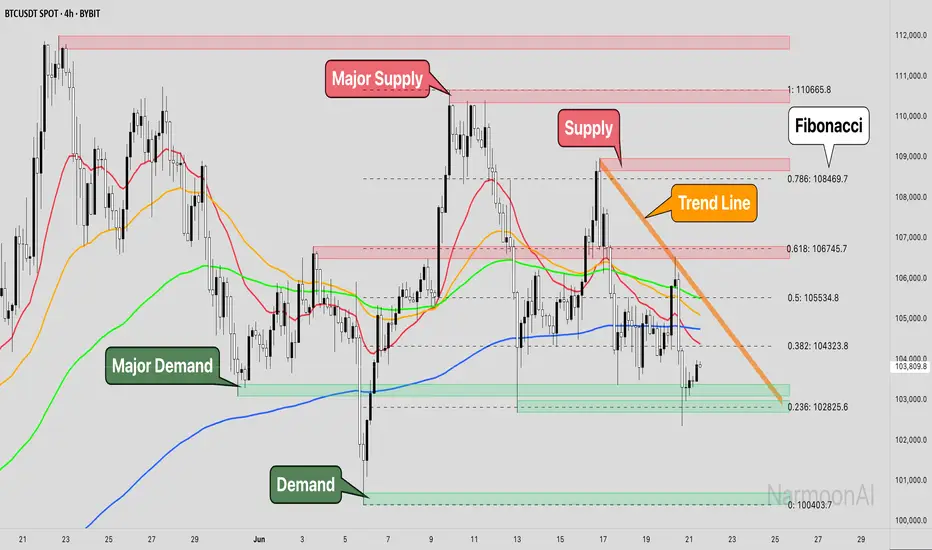
Smart Money Concepts + Fibonacci + EMA - AI Enhanced Analysis### █ OVERVIEW
This indicator is not just another "all-in-one" tool; it's a **specialized data visualization layer designed for the new era of AI-driven chart analysis**. The primary purpose of the **"NarmoonAI"** indicator is to structure and display key market information in a clean, consistent, and machine-readable format.
Standard charts can be noisy and ambiguous for AI Vision models (like Google's Gemini or OpenAI's GPT-4). This script solves that problem by consolidating the most crucial technical analysis concepts—Smart Money Concepts, Trend Analysis, and Key Levels—into a clear visual language that an AI can easily interpret from a single screenshot.
This approach allows traders to leverage the power of artificial intelligence for faster, more objective, and deeper market analysis. It's designed to work seamlessly with our custom AI assistant, the **NarmoonAI Telegram Bot**, but can be used with any modern AI vision tool.
---
### █ CORE COMPONENTS & LOGIC
This indicator is a "mashup" with a clear purpose: to create a comprehensive yet clean analytical framework. Here is how each component contributes to the overall goal of AI-enhanced analysis:
**1. Smart Money Concepts (Supply & Demand Zones):**
* **How it works:** The script automatically identifies significant market turning points by detecting swing highs and lows using `ta.pivothigh` and `ta.pivotlow` over a user-defined `Swing Length`. These pivots form the basis of our Supply (resistance) and Demand (support) zones.
* **The "Smart" Edge:** To filter out weaker zones, the indicator analyzes the volume profile. Zones that are formed during periods of high volume (defined as >1.5x the 20-period simple moving average of volume) are highlighted in a stronger, more vibrant color. This signals areas of high institutional interest, a key concept in Smart Money analysis.
**2. Multi-Layered Trend Analysis (Exponential Moving Averages - EMAs):**
* **How it works:** We've included a customizable suite of four essential EMAs (20, 50, 100, and 200). These are not just random lines; they provide an instant visual reference for short, medium, and long-term trend direction and dynamic support/resistance.
* **Why it's useful for AI:** An AI can instantly parse the order and slope of these EMAs. For example, it can identify a strong uptrend when the price is above the 20 EMA, which is above the 50 EMA, and so on.
**3. Automatic Fibonacci Retracement:**
* **How it works:** Manually drawing Fibonacci levels is subjective and time-consuming. This script automates the process by identifying the highest high and lowest low over a `Fibonacci Lookback Period` (defaulting to 100 bars) and automatically plots the key retracement levels (0.236, 0.382, 0.5, 0.618, 0.786).
* **Why it's useful for AI:** It provides objective, universally recognized potential support and resistance levels without any manual drawing, ensuring a clean and consistent chart for analysis.
**4. Dynamic Trend Channels:**
* **How it works:** The indicator automatically draws trend channels by connecting the two most recent significant pivot highs (for a downtrend channel) or pivot lows (for an uptrend channel).
* **The "Dynamic" Edge:** The width of the channel is not fixed. It's dynamically calculated using the Average True Range (ATR), allowing the channel to expand and contract based on the market's current volatility. This provides a much more adaptive and realistic view of the trend's boundaries.
---
### █ HOW TO USE THIS INDICATOR
There are two primary ways to use the NarmoonAI indicator:
**A) For AI-Powered Analysis (Recommended):**
1. Apply the **NarmoonAI** indicator to any chart.
2. Take a clean screenshot of your chart.
3. Upload the image to your preferred AI Vision model (e.g., Gemini, ChatGPT) or, for the best results, use our specialized **NarmoonAI Telegram bot**.
4. Ask the AI for a detailed analysis. **Example Prompts:**
* *"Based on this chart, what is the current market structure? Identify key support and resistance levels."*
* *"Is there a potential long setup forming according to the information from the NarmoonAI indicator?"*
* *"Summarize the trend direction and strength using the EMAs and trend channels shown."*
**B) For Manual Trading:**
Traders can use the confluence of signals for high-probability setups:
* **High-Probability Long:** Look for the price to enter a **Strong Demand Zone** that aligns with a key **Fibonacci level** (e.g., 0.618) and is respected by a major **EMA** (e.g., the 50 or 100 EMA).
* **High-Probability Short:** Look for the price to test a **Strong Supply Zone** near the top of a **descending trend channel**, with EMAs confirming the bearish momentum.
---
*This script was created by NarmoonAI to bridge the gap between traditional technical analysis and the powerful capabilities of modern artificial intelligence. We believe this is the future of trading analysis.*
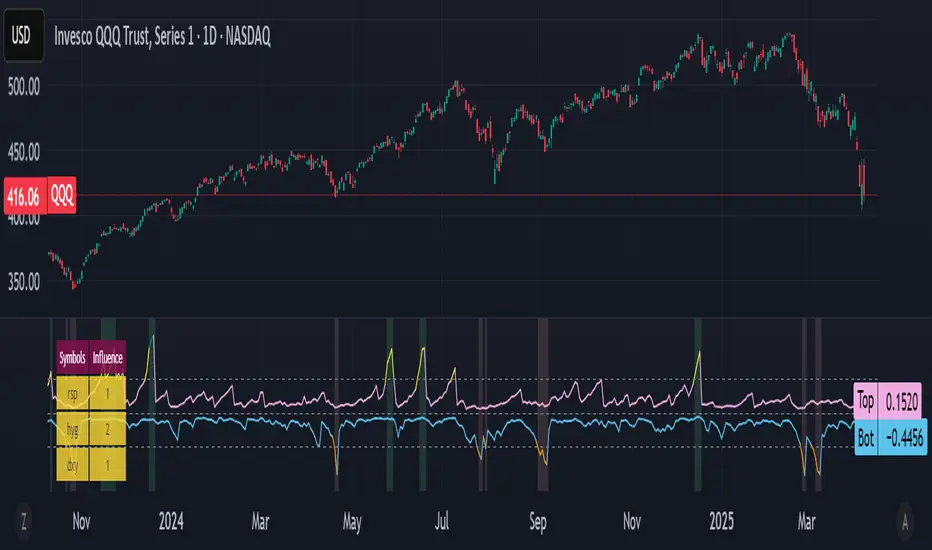
Bottom and Top finder [theUltimator5]🧭 Bottom and Top Finder — Multi-Symbol Momentum Divergence Detector
The Bottom and Top Finder by theUltimator5 is a highly configurable, momentum-based indicator designed to identify potential market reversal points using a multi-symbol relative strength comparison framework. It evaluates Directional Movement Index (DMI) values from up to three correlated or macro-influential assets to determine when the current instrument may be approaching a bottom (oversold exhaustion) or a top (overbought exhaustion).
🧠 How It Works
This script computes both the +DI (positive directional index) and -DI (negative directional index) for:
The currently selected chart symbol
Up to three user-defined reference symbols (e.g., sector leaders, macro ETFs, currencies, volatility proxies)
It uses a logarithmic percent-change approach to normalize all movement metrics, ensuring results are scale-invariant and price-neutral — meaning it works consistently whether a stock trades at $1 or $100,000. This makes the comparison between different assets meaningful, even if they trade on different scales or volatility levels.
The indicator then:
Compares the +DI values of the reference symbols to the current symbol’s +DI → seeking bottoming signals (suggesting the current symbol is unusually weak).
Compares the -DI values of the reference symbols to the current symbol’s -DI → seeking topping signals (suggesting the current symbol is unusually strong on the downside).
These comparisons are aggregated using a weighted average, where you control the influence (multiplier) of each reference symbol.
🔁 Trigger Logic
The indicator generates two dynamic lines:
Bot Line (Bottom Line): Based on reference +DI vs. current +DI
Top Line: Based on reference -DI vs. current -DI
If the Bot Line rises above the user-defined threshold, it may signal that capitulation or oversold conditions are developing. Similarly, if the Top Line rises above its threshold, it may indicate a blow-off top or overbought selling pressure.
To avoid false positives, a second smoothing-based condition must also be met:
The line must significantly exceed its moving average, confirming momentum divergence.
When both conditions are true, the indicator highlights the background in light red (bottom alert) or green (top alert) for easy visual scanning.
🔧 Key Inputs & Customization
You can fine-tune this tool using the following parameters:
Smoothing Length: Controls how smooth or sensitive the DI values are.
Reference Symbols: Up to 3 assets (default: RSP, HYG, DXY) — customizable for sector, macro, or inverse relationships.
Influence Multipliers: Adjust the weight each symbol has on the overall signal.
Display Options:
Toggle to highlight the chart background during trigger conditions.
Toggle to display a real-time table of reference symbols and their influence levels.
📈 Visual Output
Two plotted lines: One for bottoms and one for tops
Dynamically colored based on how far they exceed thresholds
Background highlights to mark trigger zones
Optional table displaying the current reference symbol setup and weights
🛠 Best Use Cases
This tool is ideal for:
Identifying short-term tops or bottoms using momentum exhaustion
Spotting divergences between an asset and broader market or sector health
Macro analysis with assets like SPY, QQQ, GME, MSFT, BTC, etc...
Pair trading signals or market breadth confirmation/disagreement
It complements other technical indicators like RSI, MACD, Bollinger Bands, or price structure patterns (double bottoms/tops, etc.)
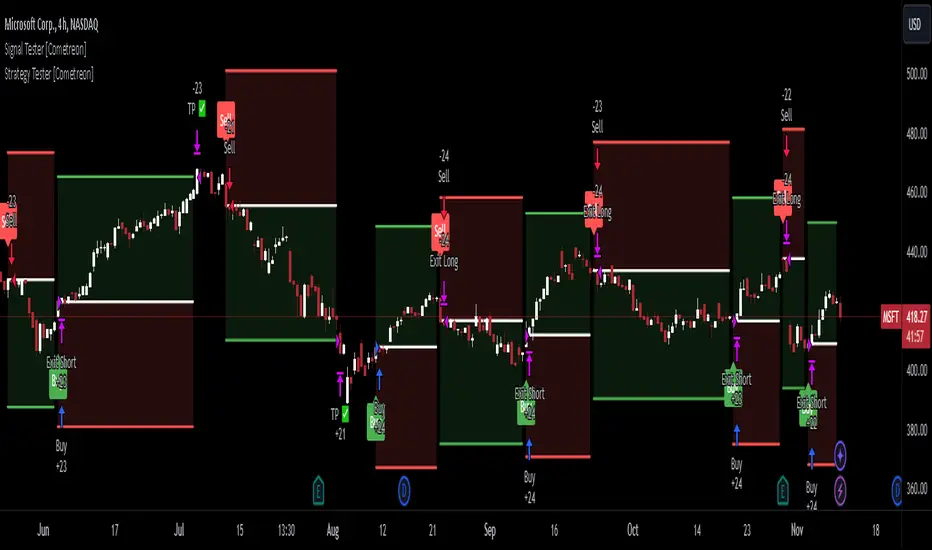
Signal Tester [Cometreon]Signal Tester is a fast and intuitive tool designed to help you visualize and analyze up to 100 past trading signals directly on the TradingView chart. Whether your signals come from bots, communities, or your own strategies, this indicator is perfect for quick validation and real-time feedback.
🔷 Key Features
🟩 Visual Signal Mapping
Display long and short entries directly on your chart for clear, immediate analysis of signal behavior.
🟩 Multi-Timeframe Compatibility
Analyze how signals behave across different timeframes to identify strengths, weaknesses, and timing.
🟩 Universal Signal Input
Test signals coming from trading bots, private groups, external alerts, or manually built strategies.
🔷 Technical Details and Customizable Inputs
1️⃣ Position Selection - Choose up to 100 recent positions—both long and short—and plot them directly on your chart.
2️⃣ Data Entry - Easily define the date and type (Long or Short) for each position directly from the settings panel.
🔍 How to Use Signal Tester Pro
📥 Input Your Signals
Add your entries and exits manually in the indicator settings.
📊 Analyze on the Chart
Visualize each trade's placement in real historical context to evaluate timing and performance.
🔁 Connect with Strategy Tester
Use the generated signals as input for Strategy Tester Pro to backtest your trading logic with full control.
☄️ Start testing your trading signals now with TradeLab Beta's Signal Tester access this powerful tool and take your market analysis to the next level!
Don't waste any more time and visit the link to get access to all Cometreon indicators.
Swiss Knife [MERT]Introduction
The Swiss Knife indicator is a comprehensive trading tool designed to provide a multi-dimensional analysis of the market. By integrating a wide array of technical indicators across multiple timeframes, it offers traders a holistic view of market sentiment, momentum, and potential reversal points. This indicator is particularly useful for traders looking to combine trend analysis, momentum indicators, volume data, and price action into a single, easy-to-read format.
---
Key Features
Multi-Timeframe Analysis : Evaluates indicators on Daily , 4-Hour , 1-Hour , and 15-Minute timeframes.
Comprehensive Indicator Suite : Incorporates MACD , Awesome Oscillator (AO) , Parabolic SAR , SuperTrend , DPO , RSI , Stochastic Oscillator , Bollinger Bands , Ichimoku Cloud , Chande Momentum Oscillator (CMO) , Donchian Channels , ADX , volume-based momentum indicators, Fractals , and divergence detection.
Market Sentiment Scoring : Aggregates signals from multiple indicators to provide an overall sentiment score.
Visual Aids : Displays EMA lines, trendlines, divergence signals, and a sentiment table directly on the chart.
Super Trend Reversal Signals : Identifies potential market reversal points by assessing the momentum of automated trading bots.
---
Explanation of Each Indicator
Moving Average Convergence Divergence (MACD)
- Purpose : Measures the relationship between two moving averages of price.
- Interpretation : A positive histogram suggests bullish momentum; a negative histogram indicates bearish momentum.
Awesome Oscillator (AO)
- Purpose : Gauges market momentum by comparing recent market movements to historic ones.
- Interpretation : Above zero indicates bullish momentum; below zero indicates bearish momentum.
Parabolic SAR (SAR)
- Purpose : Identifies potential reversal points in price direction.
- Interpretation : Dots below price suggest an uptrend; dots above price suggest a downtrend.
SuperTrend
- Purpose : Determines the prevailing market trend.
- Interpretation : Provides buy or sell signals based on price movements relative to the SuperTrend line.
Detrended Price Oscillator (DPO)
- Purpose : Removes trend from price to identify cycles.
- Interpretation : Values above zero suggest price is above the moving average; values below zero indicate it is below.
Relative Strength Index (RSI)
- Purpose : Measures the speed and change of price movements.
- Interpretation : Values above 50 indicate bullish momentum; values below 50 indicate bearish momentum.
Stochastic Oscillator
- Purpose : Compares a particular closing price to a range of its prices over a certain period.
- Interpretation : Values above 50 indicate bullish conditions; values below 50 indicate bearish conditions.
Bollinger Bands (BB)
- Purpose : Measures market volatility and provides relative price levels.
- Interpretation : Price above the middle band suggests bullishness; below the middle band suggests bearishness.
Ichimoku Cloud
- Purpose : Provides support and resistance levels, trend direction, and momentum.
- Interpretation : Bullish signals when price is above the cloud; bearish signals when price is below the cloud.
Chande Momentum Oscillator (CMO)
- Purpose : Measures momentum on both up and down days.
- Interpretation : Values above 50 indicate strong upward momentum; values below -50 indicate strong downward momentum.
Donchian Channels
- Purpose : Identifies volatility and potential breakouts.
- Interpretation : Price above the upper band suggests bullish breakout; below the lower band suggests bearish breakout.
Average Directional Index (ADX)
- Purpose : Measures the strength of a trend.
- Interpretation : DI+ above DI- indicates bullish trend; DI- above DI+ indicates bearish trend.
Volume Momentum Indicators (VolMom, CumVolMom, POCMom)
- Purpose : Analyze volume to assess buying and selling pressure.
- Interpretation : Positive values suggest bullish volume momentum; negative values indicate bearish volume momentum.
Fractals
- Purpose : Identify potential reversal points in the market.
- Interpretation : Up fractals may indicate a future downtrend; down fractals may indicate a future uptrend.
Divergence Detection
- Purpose : Identifies divergences between price and various indicators (RSI, MACD, Stochastic, OBV, MFI, A/D Line).
- Interpretation : Bullish divergences suggest potential upward reversal; bearish divergences suggest potential downward reversal.
- Note : This functionality utilizes the library from Divergence Indicator .
---
Coloring Scheme
Background Color
- Purpose : Reflects the overall market sentiment by combining sentiment scores from all indicators across different timeframes.
- Interpretation :
- Green Shades : Indicate bullish market sentiment.
- Red Shades : Indicate bearish market sentiment.
- Intensity : The strength of the color corresponds to the strength of the sentiment score.
Sentiment Table
- Purpose : Displays the status of each indicator across different timeframes.
- Interpretation :
- Green Cell : The indicator suggests a bullish signal.
- Red Cell : The indicator suggests a bearish signal.
- Percentage Score : Indicates the overall bullish or bearish sentiment on that timeframe.
Exponential Moving Averages (EMAs)
- Purpose : Provide dynamic support and resistance levels.
- Colors :
- EMA 10 : Lime
- EMA 20 : Yellow
- EMA 50 : Orange
- EMA 100 : Red
- EMA 200 : Purple
Trendlines
- Purpose : Visual representation of support and resistance levels based on pivot points.
- Interpretation :
- Upward Trendlines : Colored green , indicating support levels.
- Downward Trendlines : Colored red , indicating resistance levels.
- Note : Trendlines are drawn using the library from Simple Trendlines .
---
Utility of Market Sentiment
The indicator aggregates signals from multiple technical indicators across various timeframes to compute an overall market sentiment score . This comprehensive approach helps traders understand the prevailing market conditions by:
Confirming Trends : Multiple indicators pointing in the same direction can confirm the strength of a trend.
Identifying Reversals : Divergences and fractals can signal potential turning points.
Timeframe Alignment : Aligning signals across different timeframes can enhance the probability of successful trades.
---
Divergences
Divergence occurs when the price of an asset moves in the opposite direction of a technical indicator, suggesting a potential reversal.
- Bullish Divergence : Price makes a lower low, but the indicator makes a higher low.
- Bearish Divergence : Price makes a higher high, but the indicator makes a lower high.
The indicator detects divergences for:
RSI
MACD
Stochastic Oscillator
On-Balance Volume (OBV)
Money Flow Index (MFI)
Accumulation/Distribution Line (A/D Line)
By identifying these divergences, traders can spot early signs of trend reversals and adjust their strategies accordingly.
---
Trendlines
Trendlines are essential tools for identifying support and resistance levels. The indicator automatically draws trendlines based on pivot points:
- Upward Trendlines (Support) : Connect higher lows, indicating an uptrend.
- Downward Trendlines (Resistance) : Connect lower highs, indicating a downtrend.
These trendlines help traders visualize the trend direction and potential breakout or reversal points.
---
Super Trend Reversals (ST Reversal)
The core idea behind the Super Trend Reversals indicator is to assess the momentum of automated trading bots (often referred to as 'Supertrend bots') that enter the market during critical turning points. Specifically, the indicator is tuned to identify when the market is nearing bottoms or peaks, just before it shifts direction based on the triggered Supertrend signals. This approach helps traders:
Engage Early : Enter the market as reversal momentum builds up.
Optimize Entries and Exits : Enter under favorable conditions and exit before momentum wanes.
By capturing these reversal points, traders can enhance their trading performance.
---
Conclusion
The Swiss Knife indicator serves as a versatile tool that combines multiple technical analysis methods into a single, comprehensive indicator. By assessing various aspects of the market—including trend direction, momentum, volume, and price action—it provides traders with valuable insights to make informed trading decisions.
---
Citations
- Divergence Detection Library : Divergence Indicator by DevLucem
- Trendline Drawing Library : Simple Trendlines by HoanGhetti
---
Note : This indicator is intended for informational purposes and should be used in conjunction with other analysis techniques. Always perform due diligence before making trading decisions.
---

Super Trend ReversalsMain Concept
The core idea behind the Super Trend Reversals indicator is to assess the momentum of automated trading bots (often referred to as 'Supertrend bots') that enter the market during critical turning points. Specifically, the indicator is tuned to identify when the market is nearing bottoms or peaks, but just before it shifts direction based on the triggered Supertrend signals. This approach helps traders engage with the market right as the reversal momentum builds up, allowing for entry just as conditions become favorable and exit before momentum wanes.
How It Works
The Super Trend Reversals uses multiple Supertrend calculations, each with different period and multiplier settings, to form a comprehensive view of the trend. The total trend score from these calculations is then analyzed using the Relative Strength Index (RSI) and Exponential Moving Averages (EMA) to gauge the strength and sustainability of the trend.
A key feature of this indicator is the isCurrentRangeSmaller() function, which evaluates if the current price range is lower than the average over the recent period. This function is critical as it helps determine the stability of the market environment, reducing the likelihood of entering or exiting trades based on erratic price movements that could lead to false signals.
