FIN_BOTthis script is just for test,
can be not correct working, is just for now, soon will be better,
this is for test, and it will be prodaction as soon as possible,
Plasse be shur that you don use it as prodaction.
在腳本中搜尋"bot"

DB KCBB%D Wave SignalsDB KCBB%D Wave Signals
What does the indicator do?
This indicator is a version of my DB KCBB%D indicator updated with signal detection. It results from weeks of analysis of the KCBB%D waves for patterns. I'm releasing it publicly to help those who like the KCBB%D indicator but desire a version with signals built into it.
The indicator plots the percent difference between the low and high prices against a combined Kelpler Channel Bollinger Bands for the current timeframe. The low percent difference and the high percent difference each have their own waves plotted. A mirror mode default allows both waves to be visualized in a mirrored plot that clearly shows when outer bands are present and when they swap. Each percent difference band is displayed with a 1 bar lookback to visualize local tops/bottoms.
The overall trend is displayed using two sets of green/red colors on the percent difference waves so that each wave is recognizable, but the overall price trend is visible. A fast 3 SMA is taken of each percent difference wave to obtain the overall trend and then averaged together. The trend is then calculated based on direction from the previous bar period.
How should this indicator be used?
By default, the indicator will display in a mirror mode which will display both the low and high percent change waves mirrored to allow for the most pattern recognition possible. You will notice the percent difference waves swap from inner to outer, showing the overall market direction for that timeframe. When each percent difference wave interacts with the zero line, it indicates either buys or sells opportunities depending on which band is on the inside. When the inner wave crosses zero, special attention should be paid to the outer wave to know if it's a significant move. Likewise, when the outer wave peaks, it can indicate buy or sell opportunities depending on which wave is on the outside.
A zero line and other lines are displayed from the highest of the high percent difference wave over a long period of time. The lines can measure movement and possible oversold/overbought locations or large volatility . You can also use the lines for crossing points for either wave as alerts to know when to buy or sell zones are happening.
When individual percent difference waves are designed to be reviewed without mirroring, the mirror checkbox can be unchecked in the settings. Doing so will display both the high and low percent difference waves separately. Using this display, you can more cleanly review how each wave interacts with various line levels.
For those who desire to only have half of the mirror or one set of waves inverted against each other, check the "mirrored" and the "mirrored flipped" checkboxes in the settings. Doing so will display the top half of the mirror indicator, which is the low percent difference wave with the high percent difference wave inverted.
The indicator will also change the background color of its own pane to indicate possible buy/sell periods (work in progress).
Does the indicator include any alerts?
Yes, they are a work in progress but starting out with this release, we have:
NOTE: This is an initial release version of this indicator. Please do not use these alerts with bots yet, as they will repaint in real-time.
NOTE: A later release may happen that will delay firing the events until 1/2 of the current bar time has passed.
NOTE: As with any indicator, watch your upper timeframe waves first before zooming into lower.
DB KCBB%D Buy Signal
DB KCBB%D Buy Warning Signal
DB KCBB%D Sell Signal
DB KCBB%D Sell Warning Signal
DB KCBB%D Death Cross Sell Signal
DB KCBB%D Trend Up Alert
DB KCBB%D Trend Down Alert
Use at your own risk and do your own diligence.
Enjoy!

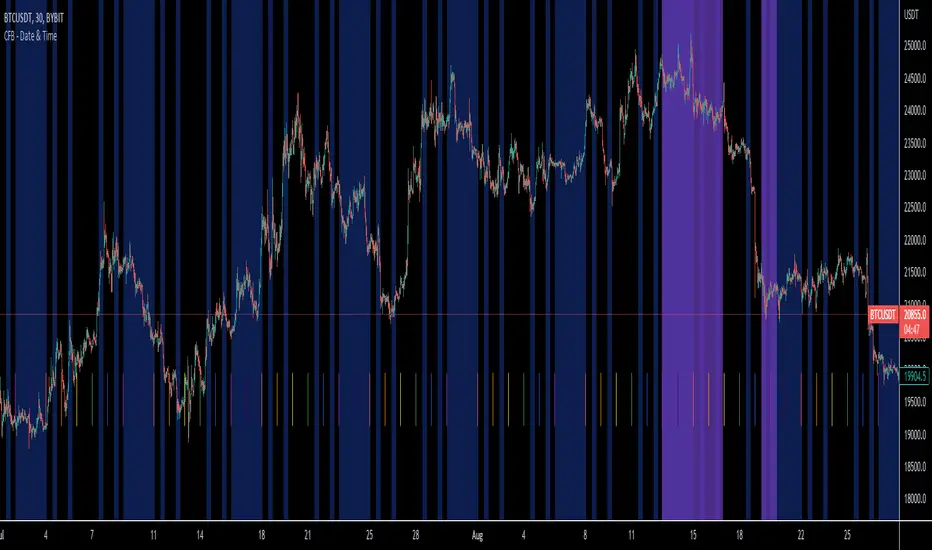
CFB Utility - Date & TimeCrypto Fusion Bot's new and improved Date and Time Indicator! Avoid trades like never before with new features and time zone compatibility.
New Features Include:
Every Time Zone that little peanut can imagine!
Time declaration down to the 3 minute!
C.F.B. themed colors
Day Start indication
User friendly layout
Price change scalping short and long strategy indicatorPrice change scalping Short and Long indicator uses a rate of change momentum oscillator to calculate the percent change in price between a period of time. Rate of change calculation takes the current price and compares it to a price of "n" periods while the period of time can be defined by a user. The calculated rate of change value is then compared to the upper threshold and the lower threshold values to determine if a position should be opened. If the threshold is crossed and filtering conditions are met a strategy position will be triggered. Entry, take profit, and stop loss prices are calculated and displayed on the chart as well as positions directions. Once the entry price is crossed, a long or short position is created and once the take profit price is crossed, the stop loss price will begin to trail behind the price action using the close of the previous bar. Once the trailing stop price is crossed, the position is closed. If the entry price is not crossed and the price action crosses the stop level, the trade setup is cancelled. The indicator is enhanced by DCA algorithm which allows to average entry price with safety orders. The script also allows to use Martingale coefficient to increase averaging power
Advantages of this script:
The indicator has custom alert settings for each strategy action
The indicator can be used with 3Commas, Cryptohopper, Alertatron or Zignaly bots
High frequency and low duration of trades
Can be used with short-term timeframes ranging from 5 to 60 minutes
Indicator is sustainable to market slumps due to DCA implementation
Can be used for short and long positions (can be adjusted to long only, short only or both)
Can be applied to any market and quote currency
Easy to configure user interface settings
Built in detailed statistic menu
How to use?
1. Apply the indicator to a trading pair your are interested in using 5 to 60 minutes timeframe chart
2. Configure the indicator: change layer values, order size multiple and take profit/stop loss values according to current market cycle stage
3. Set up a TradingView custom alert using the indicator settings to trigger on a condition you are interested in
4. indicator will send alerts when to enter and when to exit positions which can be applied to your portfolio using external trading platforms
5. Update settings once market conditions are changed using backtests on a monthly period
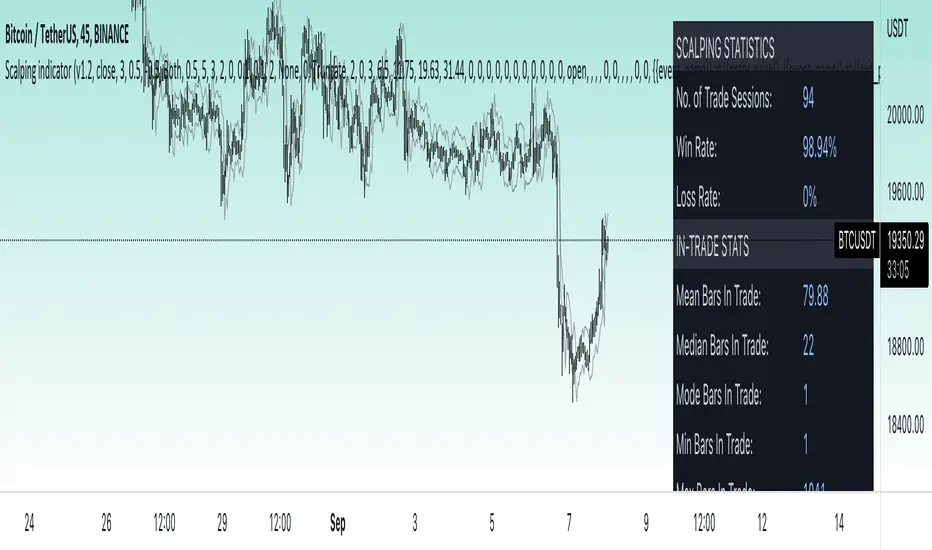
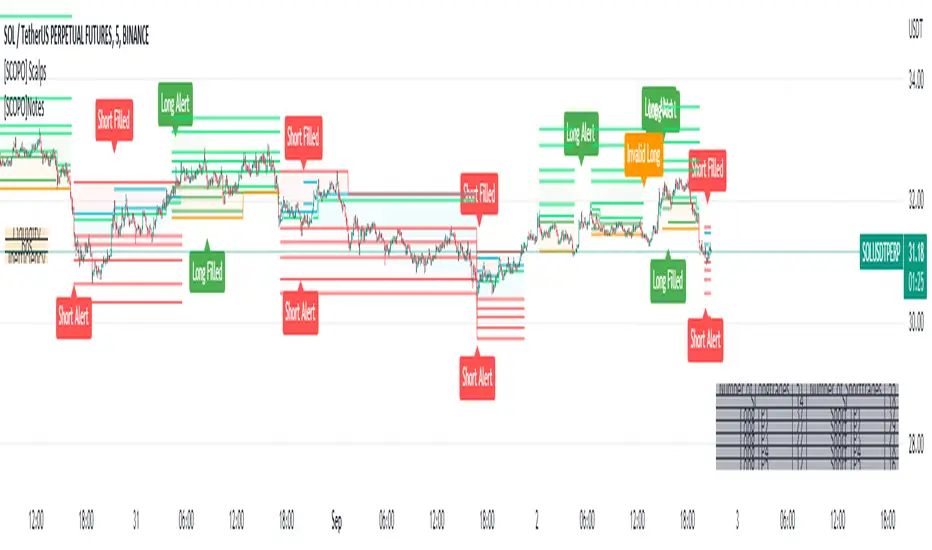
[SCOPO]Scalping BotEnglish, German is found Below
Scalping Indicator (5min Mostly)
- An Indicator that Creates Possible Trades, created on MA's, Volumebased Support and Ressistance and MACD, The Take Profits are created by a Simple Support and Ressitance Indicator (Built In)
- The Indicator sends with the Alert Function Buy and Sell Signals
- These Signals exists from 3 Entrys, 5 Take Profits and 1 Additional Take Profit who should be used after Entry 2/3 has been filled
- If a Signal gets Invalid or an Entry has been filled ,there comes a new Alert
- The Indicator Plots Lines on the Chart for TP/SL and has an Integrated Backtester table
If you got Questions pls Contact me via PM!
Update Rolled out Today (2.9.2022)
- Its now possible to set your own choosen minimal TP, before was 0.3 % and the next Ressistance above would have been taken for longs
- FilterMA can now be choosen from Different MA's via Dropdown menu
- Length of FilterMA can now be set by user
- Those Changes have been done to make it usefull for higher Timeframes too
German
Scalping Indikator
- Kurzbeschreibung: Ein Indikator der mit EMA & Macd und Volumenbasierten Supports/Ressistance Long - & Shorttrades vorschlägt
- Der Indikator sendet mit der Alarm Funktion Kauf und Verkaufsignale
Diese Signale bestehen aus 3 Entrys, 5 Take Profits sowie 1 Additional Take Profit der Aktiv wird nachdem der Entry 2 / 3 gefüllt wurde
Sollte ein Signal Invalidiert werden dann kommt ein erneuter Alarm
Sollte der 1.Entry gefüllt werden dann kommt auch ein Alarm
- Der Indikator gibt visuell auf dem Chart Linien für TP/SL wieder und besitzt auch ein Integriertes Info Fenster für ehemalige Trades.
- Die TP's werden durch eine eingebaute Support/Ressistance Funktion ausgewählt.
Alle verbesserungsvorschläge bitte per PN an @ridicolous
Update vom 2.9.2022
- Es wurde die möglichkeit mindest TP's zu setzen hinzugefügt
- Die FilterEMA kann nun aus einer Auswahl verschiedener MA's ausgewählt werden
- FilterMA längen können nun angepasstwerden
- Diese Aenderungen wurden hinzugefügt um das Skript auch auf höheren Timeframes laufen lassen zu können
MACD ULTRA with ALERTS - by OVARIDE WORK IN PROGRESS!
Coded by OVARIDE (littlegreenfish)
Made to be used with Dark Theme. Made to be used with Heikin Ashi bars (You can enable Real Price from chart settings). Test and use at your own risk. Not recommended for NEW/ INEXPERIENCED TRADERS using this for short-timeframe scalping. Bot integration is possible for high timeframes using the built-in alerts as a trigger via webhooks
Features
This is a reworked MACD code with added buffs for traders wanting more information from this basic indicator.
What this indicator does -
1. Plots a traditional MACD indicator with full input control from within the settings. All colors and values are editable , as you would expect from the standalone indicator.
2. Adds shape to the chart when MACD crosses over Signal line, while both MACD and Signal lines are below the ZERO line.
3. Adds shape to the chart when MACD crosses over ZERO line.
4. Highlights trend direction. Purple = Up Trend Likely , Yellow = Up Trend may end (use caution) , Red = Strong Down Trend Begins.
5. Ability to set alerts for -
a) When MACD crosses Signal Line.
b) When MACD crosses Zero line.
c) When an Up Trend is likely to begin.
d) When an Up Trend is slowing and may end.
e) When a Strong Down Trend begins.
Considerations -
1. Traders may use this indicator in conjunction with an existing strategy to confirm entries and exits. Traders may also use this indicator as a standalone indicator to assist with entries and exits.
2. Possible Long entries -
a) When MACD crosses Signal line while blow the Zero Line
b) When MACD crosses Zero
c) When Up Trend is Likely to begin and the background is highlighted in purple.
3. Possible stop-loss / exits (Omitted MACD crossing below Signal line and MACD crossing below Zero line)
a) When Up Trend Is slowing and the background is highlighted Yellow
b) When a Strong Down trend begins and the background is highlighted in Red. All open long position trades should be ended here.
4. The trend algorithm is hard-coded. Changing the MACD and Signal values from within the settings WILL NOT change the result of when and how the trend directions are highlighted.
5. Trend highlights are ONLY A GUIDE . You can still take entry positions in non-highlighted, yellow or red regions if your overall technical analysis tells you to.
UPDATE NOTES (IF ANY) WILL BE PUBLISHED BELOW

DB KCBB%D WavesDB KCBB%D Waves
What does the indicator do?
The indicator plots the percent difference between the low and high prices against a combined Kelpler Channel Bollinger Bands for the current timeframe. The low percent difference and the high percent difference each have their own waves plotted. A mirror mode default allows both waves to be visualized in a mirrored plot that clearly shows when outer bands are present and when they swap. Each percent difference band is displayed with a 1 bar lookback to visualize local tops/bottoms.
The overall trend is displayed using two sets of green/red colors on the percent difference waves so that each wave is recognizable, but the overall price trend is visible. A fast 3 SMA is taken of each percent difference wave to obtain the overall trend and then averaged together. The trend is then calculated based on direction from the previous bar period.
How should this indicator be used?
By default, the indicator will display in a mirror mode which will display both the low and high percent change waves mirrored to allow for the most pattern recognition possible. You will notice the percent difference waves swap from inner to outer, showing the overall market direction for that timeframe. When each percent difference wave interacts with the zero line, it indicates either buys or sells opportunities depending on which band is on the inside. When the inner wave crosses zero, special attention should be paid to the outer wave to know if it's a significant move. Likewise, when the outer wave peaks, it can indicate buy or sell opportunities depending on which wave is on the outside.
A zero line and other lines are displayed from the highest of the high percent difference wave over a long period of time. The lines can measure movement and possible oversold/overbought locations or large volatility. You can also use the lines for crossing points for either wave as alerts to know when to buy or sell zones are happening.
When individual percent difference waves are designed to be reviewed without mirroring, the mirror checkbox can be unchecked in the settings. Doing so will display both the high and low percent difference waves separately. Using this display, you can more cleanly review how each wave interacts with various line levels.
For those who desire to only have half of the mirror or one set of waves inverted against each other, check the "mirrored" and the "mirrored flipped" checkboxes in the settings. Doing so will display the top half of the mirror indicator, which is the low percent difference wave with the high percent difference wave inverted.
The indicator will also change the background color of its own pane to indicate possible buy/sell periods (work in progress).
Does the indicator include any alerts?
Yes, they are a work in progress but starting out with this release, we have:
NOTE: This is an initial release version of this indicator. Please do not use these alerts with bots yet, as they will repaint in real-time.
NOTE: A later release may happen that will delay firing the events until 1/2 of the current bar time has passed.
NOTE: As with any indicator watch your upper timeframe waves first before zooming into lower.
DB KCBB%D Buy Zone Alert
DB KCBB%D MEDIUM Buy Alert
DB KCBB%D STRONG Buy Alert
DB KCBB%D Sell Alert
DB KCBB%D STRONG Sell Alert
DB KCBB%D Trend Up Alert
DB KCBB%D Trend Down Alert
Use at your own risk and do your own diligence.
Enjoy!

Optimal Confidence Scalper [OCS]Introduction
OCS : Optimal Confidence Scalpers, Utilise the computational approach towards finding confidence estimating in signal generating process, It helps u enter and exit the financial markets quickly, It buy and sell many times in a day with the objective of making consistent profits from incremental movements in the traded security's price. As we all know Lag is very undesirable because a trading system. Late trades can many times be worse than no trades at all, Main aim of the System is to find optimal Entry and Exit points for a successful trade
Mathematics behind the indicator
The indicator use two fundamentals pillars :
Estimation of a Confidence Interval
In frequentist statistics, a confidence interval (CI) is a range of estimates for an unknown parameter. A confidence interval is computed at a designated confidence level; the 95% confidence level is most common, but other levels, such as 90% or 99%, are sometimes used.
Desired properties are Validity, Optimality and Invariance
Polynomial Filters
The polynomial filters are based on the orthogonal polynomials of Legendre and Laguerre. Orthogonal polynomials are widely used in applied mathematics, physics and engineering, and the Legendre and Laguerre polynomials are only two of infinitely many sets, each of which has its own weight function.
They can be characterized in three equivalent ways:
1. They are the optimal lowpass filters that minimize the NRR, subject to additional constraints than the DC unity-gain condition
2. They are the optimal filters that minimize the NRR whose frequency response H(ω) satisfies certain flatness constraints at DC
3. They are the filters that optimally fit, in a least-squares sense, a set of data points to polynomials of different degrees.
The System uses Predictive Differentiation Filters, as subset to Polynomial Filters
Components of the System
Buy Signal and Sell Signals
=====================
=====================------ HOW TO USE IT
=====================
ENTRY and EXITS
Momentum Bands
Confidence Levels
Indicator Properties
Provision For Alerts
1. Buy Signal Alert
2. Sell Signal Alert
3. Exit Alert if in Buy Trade
4. Exit Alert if in Sell Trade
Some Examples
What TimeFrames To Use
U can use any Timeframe, The indicator is Adaptive in Nature,
I personally use timeframes such as : 1m, 5m 10m, 15m, ..... 1D, 1W
How to Access
U will need to privately message me.
use comment box for constructive comments
Thanks
Stock Tech Bot One ViewTechnical indicators are not limited. Hence, here is another indicator with the combination of OBV, RSI, and MACD along with support, and resistance that follows the price while honoring the moving average of 200, 90 & 50.
The default lookback period of this indicator is 21 though it is changeable as per the user's desire.
The highest high and lowest low for the last 21 days lookback period proven to be the perfect Support & Resistance as the price of particular stock values are decided by market psychology. The support and resistance lines are very important to understand the market psychology which is very well proven with price action patterns and the lines are drawn based on,
Lower Extreme = 0.1 (Changeable)
Maximum Range = 21 days highest high - 21 days lowest low.
Support Line = 21 days lowest low + (Maximum Range * Lower Extreme)
Resistance Line = 21 days highest high - (Maximum Range * Lower Extreme)
RSI - Relative strength indicator is very famous to find the market momentum within the range of 0 - 100. Though the lookback period is changeable, the 14 days lookback period is the perfect match as the momentum of market movement for the last 3 weeks will always assist to identify the market regime. Here the momentum is just to highlight the indication (green up arrow under the candle for long and red down arrow above the candle for short) of market movement though it is not very important to consider if the price of the stock respect the support & resistance lines along with volume indicator (* = violet color).
OBV - Momentum:
The on-balance volume is always going indicator on any kind of tickers, which helps to identify the buying interest. Now, applying momentum on OBV with the positive movement for at least two consecutive days gives perfect confirmation for entry. A combination of the price along with this momentum(OBV) in the chart will help us to know the whipsaw in the price.
The Symbol "*" on top of each bar shows the market interest in that particular stock. If your ticker is fundamentally strong then you can see this "*" even when the market falls.
MACD:
One of the favorites and simple indicators widely used, where the thump of the rule is not to change the length even if it is allowed. It's OK to believe blindly in certain indicator and consider it while trading. That's why the indicator changes the bar color by following the MACD histogram.
Volume:
It may be the OBV works based on the open price and close price along with volume movement, it is wise to have the volume that is plotted along with price movement that should help you to decide whether the market is greedy or fearful.
The symbol "-" on top of each bar tells you a lot and don't ignore it.
Moving Average:
Moving average is a very good trend indicator as everyone considers seeing along with the price in the chart which is not omitted while we gauge the price movement alone with volume in this indicator. The 200, 90 & 50 MA's are everyone's favorite, and the same is plotted on the chart.
As explained above, the combination of all four indicators with price movement will give us very good confidence to take entry.
Candlestick Pattern:
You should admire the techniques of the candlestick pattern as you navigate the chart from right to left. Though there are a lot of patterns that exist, it is easy to enable and disable to view the signal as the label.
Further, last but not least, the exit always depends on individual conviction and how often the individual watch the price movement, if your conviction is strong then follow the down arrow red indication. If not, then exit with a trailing stop that indicates the bar with orange color.
Happy investing
Note: It is just a combination of multiple indicators and patterns to get one holistic view. So, the credit goes to all wise developers who publically published.

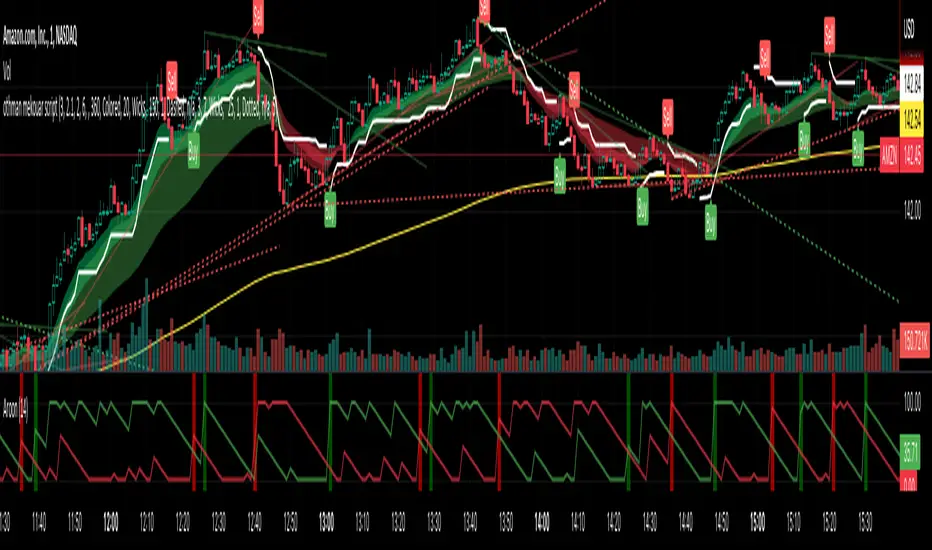
othman mekouar script version 4its a mix of ema, atr and ut bot alerts, its provide entries with the buy and sell signals
for me as a scalper the best time frame is the 1 min time frame
i took calls when the signal (buy) is above the 200 ema (the yellow line)
i took puts when the signal (sell) is bellow the 200 ema (the yellow line)
the taking profit or stop loss is the ATR line
i look also a lot at the trend lines, a signal with a break above or below the trend line confirms me a A+ setup
the think that i like the most about this strategy is your risk reward, usually i lose maybe 5 to 15% on a trade but i can win sometimes more than 100% in one trade)
There is also a lot of ways to adapt the indicator to the time frame you trade, as a scalper use the 1 min time frame, if you are a swing trader, you can use the 15min time frame or the 1h time frame, if you are a long term trader, you can use the 4h or daily time frame
feel free to contact me if you need any help
lets make money
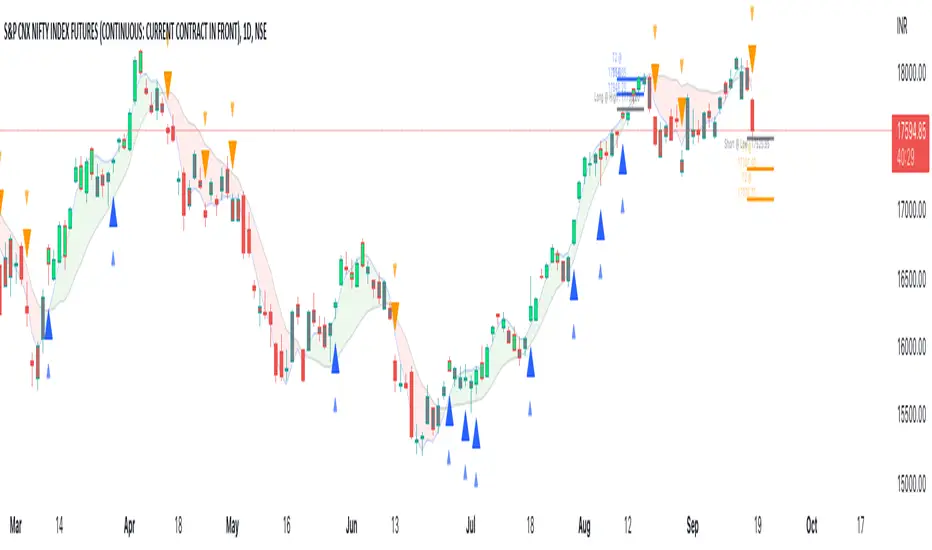
Unicorn X-AlgoUnicorn X-Algo is a multifunctional trading indicator. It is designed to help traders make real-time decisions using quantitative models.
Its core is a trend trading strategy based on our enhanced Trailing Stop-Loss algorithm. This strategy provides the user with position entry and exit signals. It is customizable and has a built-in instant backtesting feature.
For those who have difficulty with finding the good settings the indicator has the Automatic Mode. In this mode, there is no need for the user to adjust any settings. The indicator calculates optimized trading signals automatically.
In addition, the indicator provides a number of useful tools that aim to provide additional confirmation to the trading signals. They include: support and resistance levels forecast, price range prediction and institutional activity detection.
The script can send real-time alerts to the user’s Email and to the cell phone via notifications in the TradingView app.
The indicator can be used for various types of trend and swing trading, including positional trading, day trading and scalping.
Unicorn X-Algo allows users to:
forecast direction of trends with BUY and SELL signals;
determine the right time to close a position;
detect institutional activity in the market;
forecast key support and resistance levels;
predict the future price range for any market;
customize any settings and do a backtest with one click;
see historical trades on the chart;
use the fully Automatic Mode where the algorithm optimizes all its settings itself.
When using this script, keep in mind that past results do not necessarily reflect future results and that many factors influence trading results.
FEATURES
Trading signals
The feature calculates trend or swing entry and exit signals. The underlying strategy does not use fixed Take-Profit levels. It trails the price with a Trailing Stop-Loss to get as many pips as possible from price movements.
The feature is based on our custom Volatility Stop algorithm. It uses linear regressions instead of averaging. As our practice shows, this helps to reduce signal lag while keeping the number of false signals low.
Trading signals are customizable with Sensitivity and Trade Length parameters which determine the trading signals frequency and width of the Trailing-Stop levels, respectively.
Automatic Mode
The Trading Signals function has an automatic mode. When it is turned on, you do not need to adjust the trading signals settings. The algorithm tries to calculate the best settings automatically using an optimization algorithm.
In this mode, Buy and Sell signals are displayed as green and red triangles respectively. There are two types of exit signals displayed as circles and crosses. A circle signal means that a price reversal is expected and you can partially close the position. A cross signal means that a trading signal in the opposite direction is expected soon and you can partially or completely close your position.
Support and Resistance Levels
Support/Resistance levels forecasting model. The forecasted levels are non-repainting. Once calculated for a specified period in the future (day, week, month, etc.), they don't change during this period.
The feature allows the trader to plan trades and use the forecasted levels as entry levels and targets for opening and closing positions. Both intraday and higher timeframes are supported.
The forecasting model analyses the distribution of the price time series to find clusters in the data. These clusters are then used to make the key price levels forecast.
Big Money Activity detection
The Big Money Activity tool identifies areas on the price chart associated with instructional traders' activity in the market.
Institutional activity in a trending market can be a leading signal for upcoming reversal. Institutions could be fixing their profit, causing the price to move against the current trend.
Institutional activity in a sideways market can be due to positions accumulation and signal a new trend formation.
The algorithm uses tick volume, volume, and volatility data to forecast activity of institutional investors. The method develops the idea described in the Daigler & Wiley (2015) and Shalen (1993) works. It says that when institutional traders actively open or close their positions in the market, a divergence between volume and volatility time-series arises. It can be due to their use of position-splitting algorithms that reduce the impact of their positions on the market.
Trading Range Forecast
Trading Range Forecast feature predicts the price range of an asset for a selected period of time in the future, called Forecast Horizon. It can be the next day or 12-hour trading session. This function works if your chart timeframe is intraday (i.e. the timeframe below "D"). It shows the upper and lower bounds between which the price is going to stay in the upcoming Forecast Horizon period.
Instant Backtesting
After changing any settings, you can immediately see the performance of the strategy on the Instant Backtesting panel. Two metrics are displayed there - the percentage of profitable trades and the total return. This information, as well as the historical trades shown on the chart, will help you quickly and easily evaluate any settings you make.
SETTINGS
TRADING SIGNALS
Trade Length - defines the length of the trades the algorithm tries to make. Recommended values are from 1.0 to 6.0.
Sensitivity - controls the sensitivity of the trading signals algorithm. The sensitivity determines the density of trading signals and how close the trailing-stop levels follow the price. The higher the value of this parameter is, the less sensitive the algorithm is. High values of the Sensitivity parameters (100-500) can help to withstand large price swings to stay in longer price moves. Lower values (10-100) work well for short- and medium-term trades.
TRADING TOOLS
Big Money Activity - turns on and off the identification of the areas associated with institutional traders activity.
SUPPORТ AND RESISTANCЕ LEVELS
Show Support And Resistance Levels - turns on and off support and resistance levels calculation.
TRADING RANGE FORECAST
Show Trading Range Forecast - turns on/off trading range forecasting
Forecast Horizon - sets the period for which the trading range forecast is made
Forecasting Method - allows to choose a forecasting algorithm for the trading range forecast.
BACKTESTING
Use Starting Date - turns on/off the starting date for the strategy and backtests. When off, all available historical data is used.
Starting Date - sets the starting date for the strategy and backtests.
Show Instant Backtesting Dashboard - turns on/off a dashboard that shows the current strategy performance: the percentage of profitable trades and total return.
Leverage - sets the leverage that the strategy uses.

Unicorn QuantDeeply customizable trading algorithm with instant backtesting. It emulates real trading and displays all the actions it takes on the chart. For example, it shows when to enter or partially close a position, move Stop-Loss to breakeven, etc. The user can replicate these actions in their trading terminal in real time. The algorithm uses up to three Take-Profit levels, and a Stop-Loss level that can move in a trade to protect the floating profit.
The script can send real-time alerts to the user’s Email and to the cell phone via notifications in the TradingView app.
The indicator is designed to be used on all timeframes, including lower ones for intraday trading and scalping.
HOW TO USE
Set the Stop-Loss and up to three Take-Profit levels. Choose the rules for moving the Stop-Loss level in a trade. Adjust the sensitivity of the trading signals. And check the backtest result in the Instant Backtesting dashboard. If the performance of the strategy satisfies you, proceed with the forward testing or live trading.
When using this script, please, keep in mind that past results do not necessarily reflect future results and there are many factors that influence trading results.
FEATURES
Trading Signals
The feature calculates Buy and Sell signals for trend or swing trading. The user can change the Sensitivity parameter to control the frequency of the signals. This allows them to be adjusted for different markets and timeframes.
Position Manager
To make the Position Manager setup as easy as possible, the algorithm calculates Stop-Loss and Take-Profit levels in Average True Range (ATR) units. They are self-adjusting for any market and timeframe, since they account for its average volatility .
You don't have to worry about what market you are trading - Forex, Stocks, Crypto, etc. With the self-adjusting Stop-Loss and Take-Profit, you can find settings that work for one market and use the same numerical values as a starting point for a completely different market.
Instant Backtesting
After changing any settings, you can immediately see the performance of the strategy on the Instant Backtesting panel. Two metrics are displayed there - the percentage of profitable trades and the total return. This information, as well as the historical trades shown on the chart, will help you quickly and easily evaluate the settings.
SETTINGS
TRADING SIGNALS
Sensitivity - controls the sensitivity of the trading signals algorithm. It determines the frequency of the trading signals. The higher the value of this parameter, the less trading signals you get and the longer trends the algorithm tries to catch. The lower the sensitivity value, the more signals you receive. This can be useful if you want to profit from small price movements.
POSITION MANAGER
SL - sets the Stop-Loss level measured in ATR units.
TP1, TP2, TP3 - set the Take-Profit levels measured in the ATR units.
Close % at TP1, Close % at TP2, Close % at TP3 - set portions of the open position (as a percentage of the initial order size) to close at each of the TP levels.
At TP1 move SL to, At TP2 move SL to - set the rules for moving the Stop-Loss level in an open trade to protect the floating profit.
Show Open Position Dashboard - turns on/off a dashboard that shows the current Stop-Loss and Take-Profit levels for the open position.
BACKTESTING
Use Starting Date - turns on/off the starting date for the strategy and backtests. When off, all available historical data is used.
Starting Date - sets the starting date for the strategy and backtests.
Show Instant Backtesting Dashboard - turns on/off a dashboard that shows the current strategy performance: the percentage of profitable trades and total return.
Leverage - sets the leverage that the strategy uses.

Pyramiding Order Volume CalculatorThis is a script to calculate the order volume for the current symbol given your current portfolio value and how many orders you want to place. This is useful when using a strategy that places pyramiding orders and your bot won't automatically divide up your portfolio.
NLX Trading Bot Framework (+Trend Score & QQE)- Demo of my NLX Modular Trading Framework -
It includes all the common indicators and creates a positive or negative score, which can be used with my Modular Trading Framework and linked to an entry/exit indicator to filter out buy/sell signals if the trend is not favorable.
Combination of:
SuperTrend
VWAP Bands
Relative Strength Index ( RSI )
Commodity Channel Index ( CCI )
William Percent Range (WPR)
Directional Movement Index (DMI)
Elder Force Index ( EFI )
Momentum
Demarker
Parabolic SAR
- Getting Started -
1. Add this Trend Index to your Chart
2. Add one of my Indicator Modules to your Chart, such as the QQE++ Indicator
3. In the QQE Indicator Settings combine it with the Trend Index (and choose L1 Type)
4. Optional: Add the Noise Filter, and in the Noise Filter Settings you select the QQE Indicator as combination (and choose L2 for Type)
5. Add the Backtest Module to your Chart
6. Select the Noise Filter in the Backtest Settings
- Access -
Only as part of the NLX Framework - see my signature below for more info.

ATR alerts & backtestingThe Basics
Alert will trigger if the current (real time) price surpasses the high of the ATR of the previous bar. (can also be set for the Low of the ATR). Each time the follow up candle surpasses the high of the previous ATR, the background will be coloured orange. This makes back testing easier on the eye. This can be turned off.
- Colours can be changed.
- Can also set a color and alert when the current price surpasses the Low of the ATR of the previous bar.
- ATR distance can be changed.
- Can be used on different chart types.
- Can be used as entry or exits in combination with bots.
- Can display only ATR top or bottom or both.
Example
An alert will trigger if the price of the current bar surpasses the red dot (ATR) of the previous bar.
Alerts can be created on all timeframes, if this is within your Tradingview plan.
Final Words
Disclaimer: Please use it with care and at own risk. The owner of this indicator is not liable for any financial losses.
Past performance is no guarantee of future returns.

Date and Time ConfirmationCustom Date and Time Confirmation.
You can set which days you don't want the bot to trade, specific times of day, and custom date ranges.
A walkthrough lesson can be found here:

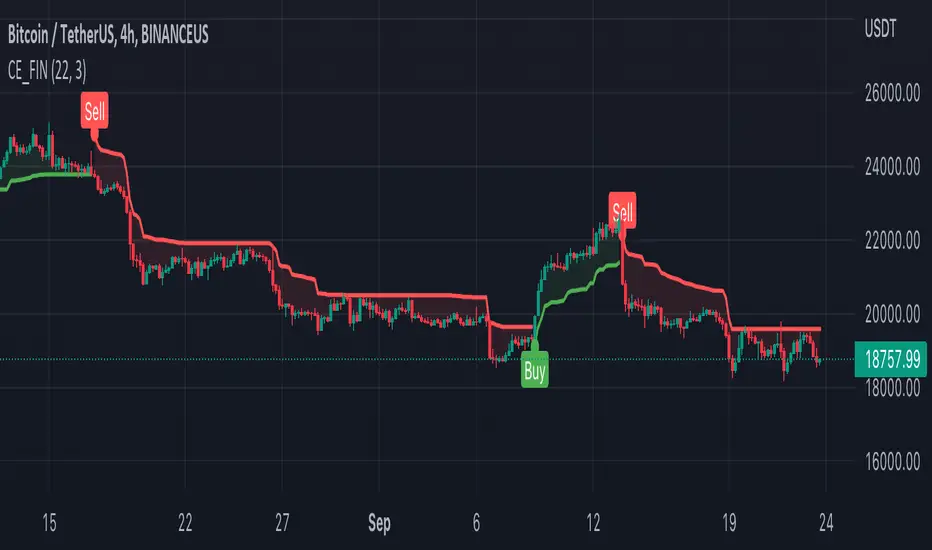
Gucci Sniper Trading Bot [Open]A simple Buy/Sell signal algo designed for a trading bot.
Uses ATR and EMA cross to get signals.

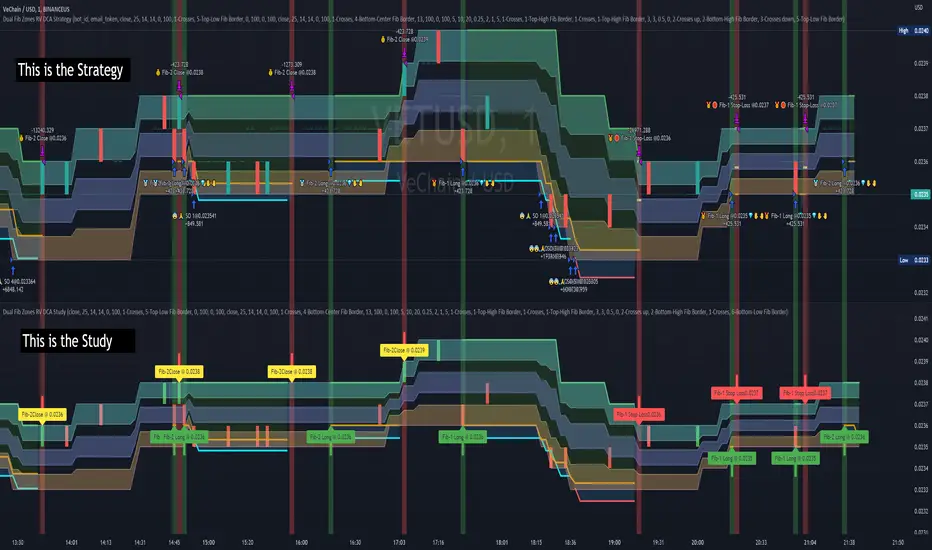
Dual Fibonacci Zones & Ranged Vol DCA Study - R3c0nTraderWhat does this do?
This signal script (aka Study) was created so it could be used with the corresponding strategy "Dual Fibonacci Zone & Ranged Vol DCA Strategy - R3c0nTrader" to create the buy and sell signals for 3Commas bots.
How to Use
Configure the study to match your settings you have set in the strategy. This script comes with an buy and sell alert conditions built-in. Just click to add alert and select Buy or Sell and paste in your bot messages.
Credits:
Thank you "EvoCrypto" for granting me permission to use "Ranged Volume" to create this study
Thank you "eykpunter" for granting me permission to use "Fibonacci Zones" to create this study
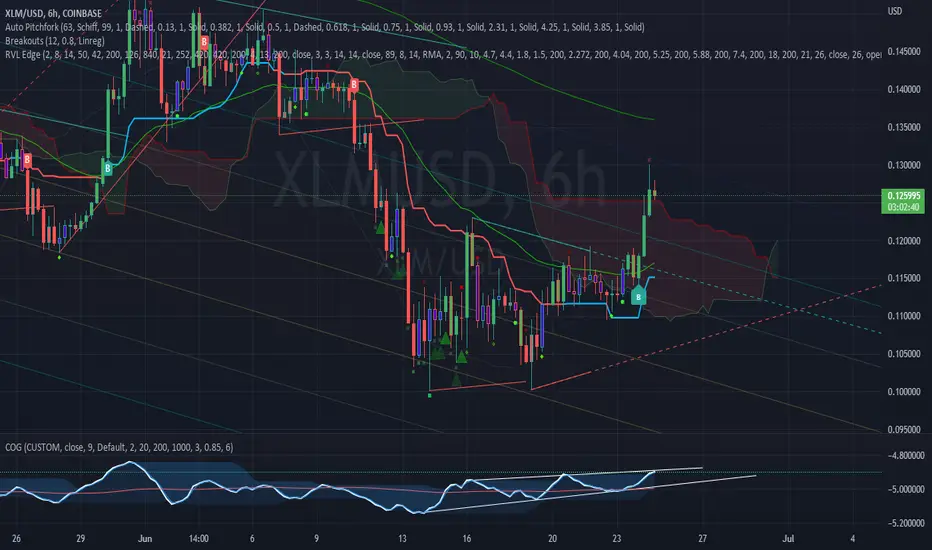
RVL Unreal Edge (concept build)Designed with a purpose, this script was intended for use by bots automating trading of XLM using a 6hr timeframe.
It's now being shaped into fantastic indicator on its own with very actionable signals and essentially zero lag. Much of the power behind it is derived from standard deviation/mean reversion strategies, and John Ehlers' incredible CG oscillator.
John Ehlers was an electrical engineer and Raytheon employee who began trading in the 1970's. He is best known for his work creating super-smoothing algorithms and methods of analysing cycle length and behaviour, and his work in the field of zero-lag indicators - indicators that don't follow the price action but are in fact capable of leading it actionably and responding with essentially zero lag.
By approaching the price action as a sine wave with a demonstrably fractal nature and thus subject to the phenomena of spectral dilation, Ehler's makes a number of important advancements. His CG indicator is derived from calculations typically used to derive the centre of gravity in a physical object. It effectively works as a band-pass filter, and is possibly one of the very best leading indicators available.
This script catches breakouts, tops and bottoms, leads reversals and the start/end of cycles. It functions as an excellent way to secure entries/exits around support and resistance. There are some methods of charting support and resistance built into the script currently, and lots more to add. One of the next major adjustments will be to hide or reduce the strength of buy/sell signals when price might be overextended (seen by the larger triangles, and + x symbols - these signal that a reversion back to the mean may be imminent).
The early version of this script had a 65% winrate and fantastic profit factor.
Stay tuned!
Support/Resistance:
The Ichimoku cloud, in this case has been custom tuned to the XLM 6 hour chart.
The 42 period EMA is a moving average that gets notable reactions from the price.
The 200 period EMA is the same.
The automatic Pitchfork almost always provides relevant Fibonacci based levels, but can sometimes require manually flicking through a few different presets to find a combination that fits the current price action. This will be automated in future.
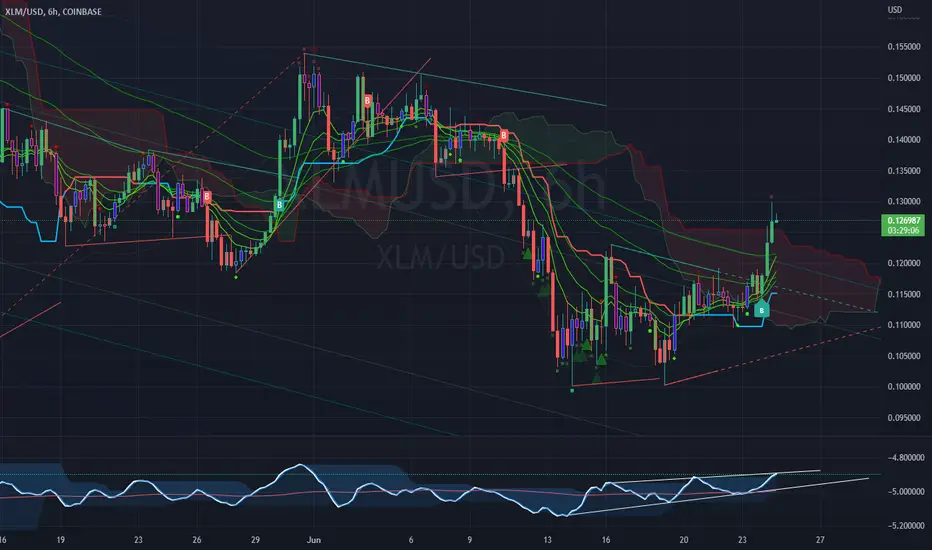
RVL Unreal Edge (concept build)Designed with a purpose, this script was intended for use by bots automating trading of XLM using a 6hr timeframe.
However the script has turned out to be a fantastic indicator on its own, and much of the power behind it is derived from John Ehler's incredible CG oscillator.
John Ehler was an electrical engineer, a Raytheon employee who began trading in the 1970's. He is best known for his work creating super-smoothing algorithms and methods of analysing cycle length and behaviour in price action, and his work in the field of zero-lag indicators - indicators that don't follow the price action, but are in fact capable of leading it actionably, and responding with essentially zero lag.
By approaching the price action as a sine wave with demonstrably a fractal nature, Ehler's makes a number of important advancements. His CG indicator is derived from calculations typically used to derive the centre of gravity in a physical object. It effectively works as a band-pass filter and is possibly one of the very best leading indicators avaliable.
Sherry on cryptoIf the price is above the 200 EMA, you are allowed to open only long positions and avoid shorts.
If the price is below the 200 EMA, you are allowed to open only short position and avoid longs. Don't use this indicator alone, use RSI, Stochastic RSI etc. Do not use this indicator like a bot, do TA and FA as well. This is just an indicator, do not always rely on it. It requires experience. This indicator has different winrate in different timeframes. Set its value accordingly.
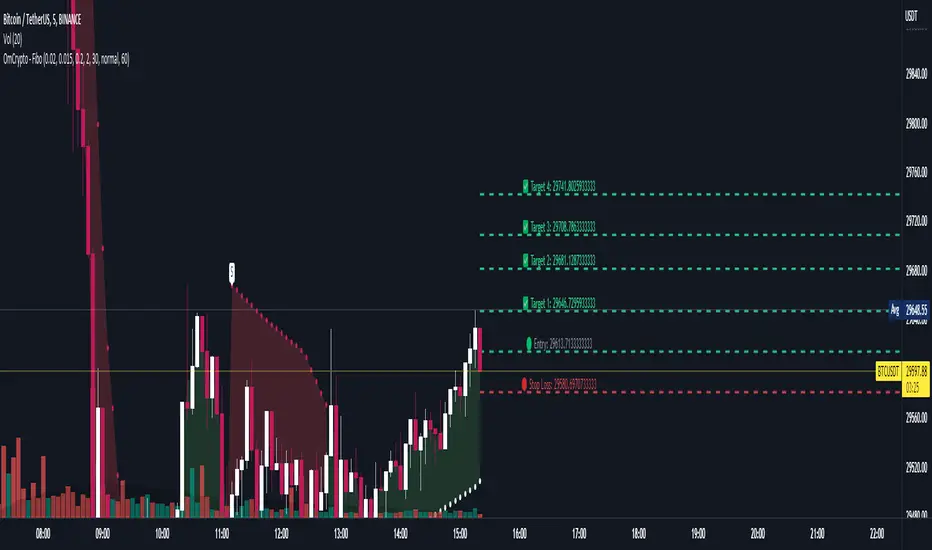
OmCrypto - PSAR with TargetOmCrypto - PSAR with Target
This script uses PSAR as it's main buy and sell signal with automatic target to take profit, entry and stop loss
It also supports alert so you can use it for bots
You can set your own period (timeframe) for the target lines in settings, default is 60 minutes (1h)