BEST Standalone Trade Manager with Automatic Take ProfitHello BEST traders
The BEST Trade Manager got upgraded with many more features
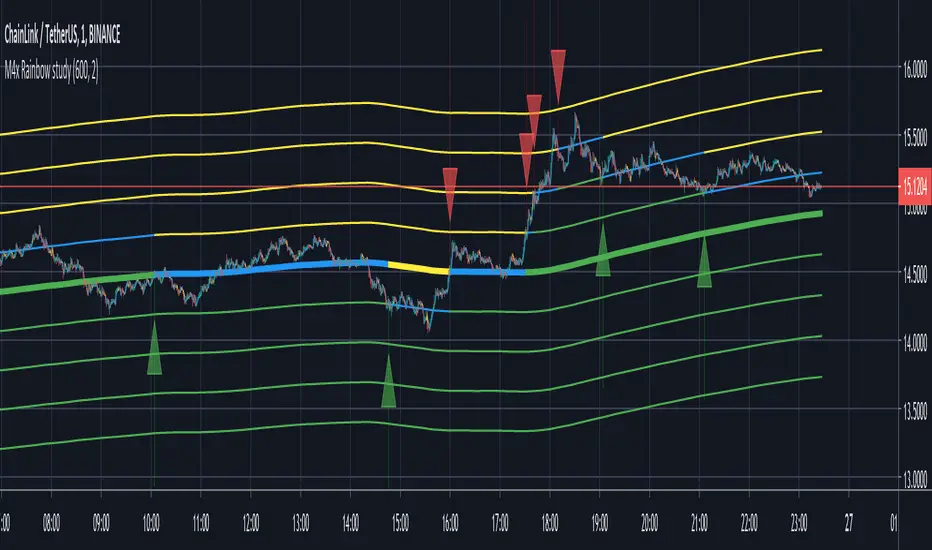
This version allows setting automatically the TP levels on either Daily/Weekly/Monthly Fibonacci/Traditional/Camarilla/Woodie pivots and Daily/Weekly/Monthly/Intraday Moving Averages
I. 💎 SCRIPTS ACCESS 💎
1. Available only with one-time payment on my website.
2. My website URL is in this script signature at the very bottom (you'll have to scroll down a bit and going past the long description) and in my profile status available here: Daveatt
3. Many video tutorials explaining clearly how all our indicators work are available on your website > guides section.
4. You may also contact me directly for more information
II. 🔎 What is the BEST Trade Manager?🔎
2.1 Concept
The BEST Trade Manager is compatible with any indicator.
Once connected, it adds another layer of good stuff with real-time user custom defined stop loss (8 available options), take profits (4 possible options) + alerts compatible for trading automation.
2.2 How hard is it to update your indicator?
We'll send to our customers, a comprehensive and easy tutorial, to make any indicator compatible.
I guarantee you, it should take no more than 2 minutes per indicator. We made it easy, fun, and awesome. #bolder #statement
III. The amazing benefits of our Plug&Play system
I hope you're ready to be impressed. Because, what I'm about to introduce, is my best-seller feature - and available across many of my indicators.
The BEST Trade manager can be connected to any external indicator
Let's assume you want to connect your RSI divergence to your Trade Manager.
I mentioned an RSI divergence but you may connect any oscillator ( MACD, On balance volume, stochastic RSI, True Strenght index, and many more..) or non-oscillatory (divergence, trendline break, higher highs/lower lows, candlesticks pattern, price action, harmonic patterns, ...) indicators.
THE SKY IS (or more likely your imagination) is the limit :)
Of course, this tool is compatible with my other indicators
We go in-depth on our website why the Plug&Play is an untapped opportunity for many traders out there - URL available on my profile status and signature
IV. 🧰 Features 🧰
Candles can be colored to highlight the trend direction better [/b [
4.1 Stop-Loss Management
For what's following, let's assume that 2 is the stop-loss value you inserted in the indicator, and the Algorithm Builder gives a BUY signal.
This is NOT a recommendation at all, only an example to explain how this feature works.
- %Trailing: The Stop-Loss starts 2% away from the entry price - and will move up (because we're on a BUY trade as per our example) every time your trade will gain 2% profit
- Pips Trailing: Same as above but using a distance in pips/USD value
- Percentage: The Stop-Loss stays static 2% away from the entry price. There is no trailing here
- TP Trailing: Trail your stop-loss every time a Take Profit level is hit
- Supertrend: embedded supertrend use as a trailing stop
- Fixed: Set the Stop-Loss at a fixed position (value should be in currency/units)
- ATR multiple: Set the Stop-loss at a multiple of ATR
- External connector: Let's say your indicator already contains embedded stop-loss levels, you can add them in the Trade Manager
4.2 Take Profits Management
You can manage up to 3 take profit levels defined as a percentage or price value or ATR multiple.
The expected input is in percentage value (for instance, setting the % target of TP1 to 2% will set the TP1 level 2% away from the entry price
This version allows setting automatically the TP levels on either Daily/Weekly/Monthly Fibonacci/Traditional/Camarilla/Woodie pivots and Daily/Weekly/Monthly/Intraday Moving Averages
4.3 Built-in Risk-to-Reward Panel with real-time analytics
The good stuff doesn't stop here.
You'll notice that this sometimes green (when in a LONG), sometimes red (when in a SHORT) panel at the right of your chart.
- Entry Price: the price when the Algorithm Builder will give a signal.
- The Trade PnL in percentage.
- Entry Stop Loss: Distance (in currency/units) between the selected stop-loss algorithm (percent, trailing, TP trailing, etc.) and the entry price.
- Entry TP1/TP2/TP3: Distance (in currency/units) between the entry price and the first take profit
- Risk/Reward TP1/TP2/TP3: Using the Stop-loss distance at entry, and Take Profit 1/2/3 at the entry to compute the risk-to-reward ratio.
- Max drawdown and Max opportunity (value and percentage): respectively the maximum loss and maximum win per trade
For more details, please check the guides section of my website. Links are in my signature and profile status.
V. 🔔 Alerts 🔔
We enabled the alerts on the:
1. Stop-Loss hit
2. Take Profit 1/2/3 hit
3. custom hard exits based on either MACD / RSI divergence/ MM cross
5.1 🤖 Compatible with trading bots? 🤖
It's compatible with all third-parties out there capturing alerts and forwarding them to the brokers.
We enabled TradingConnector and ProfitView alert templates so far.
If you have any doubts or questions, please hit me up directly or ask in the comments section of this script.
BEST regards,
Dave
在腳本中搜尋"bot"
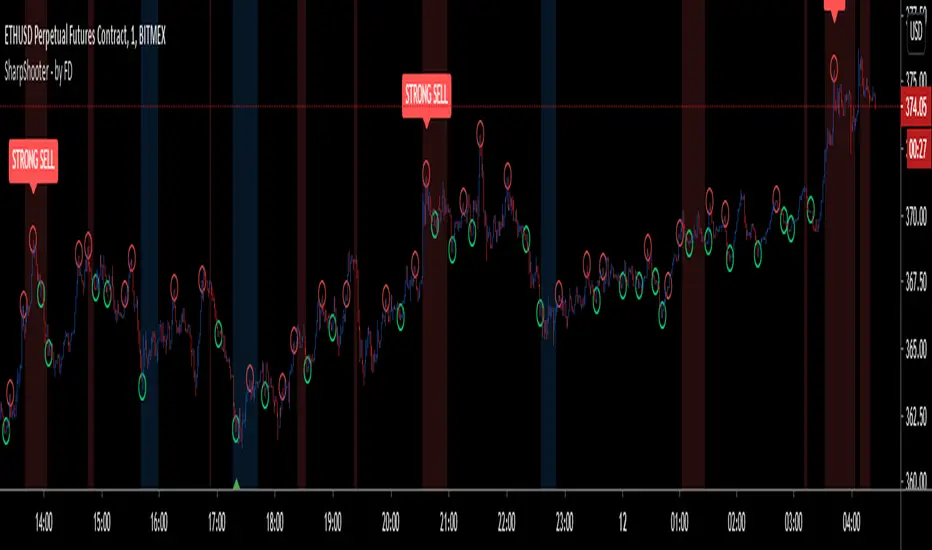
Sharp Shooter - by FiatDropoutThis is an experimental script and is intended to be used only on LTF charts for scalping. It may or may not be useful on other charts and time frame, but that is subject to back testing.
Now, coming back to this script. It has multiple features yet i tried to keep it as clean in representation as possible.
As obvious, few things are easily recognizable on chart, such as:
BUY - Go LONG
STRONG BUY - Heavy Uptrend is expected, Go LONG
SELL - Go SHORT
STRONG SHORT - Heavy Downtrend is expected, Go SHORT.
on addition to above signals, there are few other plot-shapes, which are:
Red Circle - Acts as TP for LONG during uptrend and acts as Add-On SHORT during downtrend
Green Circle - Acts as TP for SHORT during downtrend and acts as Add-on LONG during uptrend.
Red Background - Bearish Peak, potential start of downtrend
Blue Background - Bullish Peak, potential start of uptrend
------------------------------------------------------------------------------------------------------------------------------------------------------------------------------------
Now that plots are over, lets go to how to use them. As name of this script suggests, it intends to find most optimal entry and exit for long and short while taking profit on the way and adding to the position until trend changes.
Be aware that trend here is very much based on current time-frame and does not represent other time-frame's bias. Also, trend here is intended to be used as a scalp trend and not a swing trend.
Now once, you get a signal for BUY(example), then wait for "Bullish Peak"(blue background) to appear with either "STRONG BUY" or just "BUY" and take an entry at respective price, next look for "red circle" which acts as TP for long(refer sec, above) and either move stop to entry, or take partial profits or close position entirely.
Now every subsequent "green circle" will act as add-on for long and every "red circle" will act as TP for long, until "Bearish Peak" appears, which will reverse the order of how circles are used and direction of the trade. Now during "Bearish Peak" and until "Bullish Peak" appears, "red circle" will act as add-on for short and "green circle" will act as TP for short.
It might take some time to adjust to the plots, but i have decided to keep it that way in order to keep chart clean of too many signals.
------------------------------------------------------------------------------------------------------------------------------------------------------------------------------------
NOTE : Please use stops and be sure to place orders quickly as prices move faster on minute charts and you should be able to place orders and stop right away, so if you are new to trading and are currently in early stage of the business, scalping is strongly not advised, let alone this indicator. Also, past performance are not guarantee of future results and most importantly, this indicator does not repaint. By using this indicator, you accept that i am not responsible for any losses or gains made by user by trading with help of this bot.
Also, in next update, i will fix some bug, add some SS and also add alerts. Alerts are not being added currently because of high volatile nature of the bot signals which if tried on automation can give varied results. Once everything is set, i shall add alerts.
for any other queries, feel free to get back here on chat or DM.
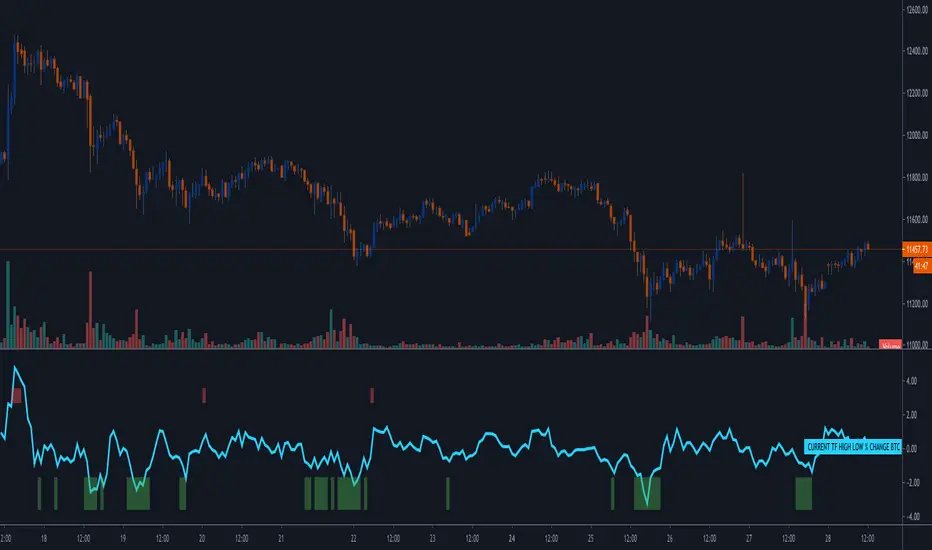
[ProfitTrailer:Feeder] High/Low % ChangeThis script was created to help people determine which HighLowPercentageChange settings work for them in the ProfitTrailer bot as well as set specific groupings in PTFeeder. For more in-depth knowledge on how it's calculated/works I would advice you to visit the ProfitTrailer and/or PtFeeder wiki pages. Massive thanks to NigglesSquiggles for creating the first version!
If you have any questions, please just let me know! Enjoy
[ProfitTrailer:Feeder] ATRThis script was created to help people determine which ATR settings work for them in the ProfitTrailer bot as well as set specific groupings in PTFeeder. For more in-depth knowledge on how it's calculated/works I would advice you to visit the ProfitTrailer and/or PtFeeder wiki pages.
If you have any questions, please just let me know! Enjoy

Real Grid Trend Multiplier & SMA Final Real Grid Trend Multiplier & SMA
"M4x Rainbow" is a Grid Trend Multiplier bot, who is following an adjustable SMA.
Settings:
- Profit % per Step (0-1000%)
- SMA lenght (0-4000)
Alerts: (one Alert is one step)
- longRain
- shortRAIN
The coloring of the lines is:
green = linestate is LONG
blue = linestate is WAIT
yellow = linestate is SHORT
!!! Tested only on 1 Minute Chart !!!
Give it a try and let me know.
...have fun ;-)
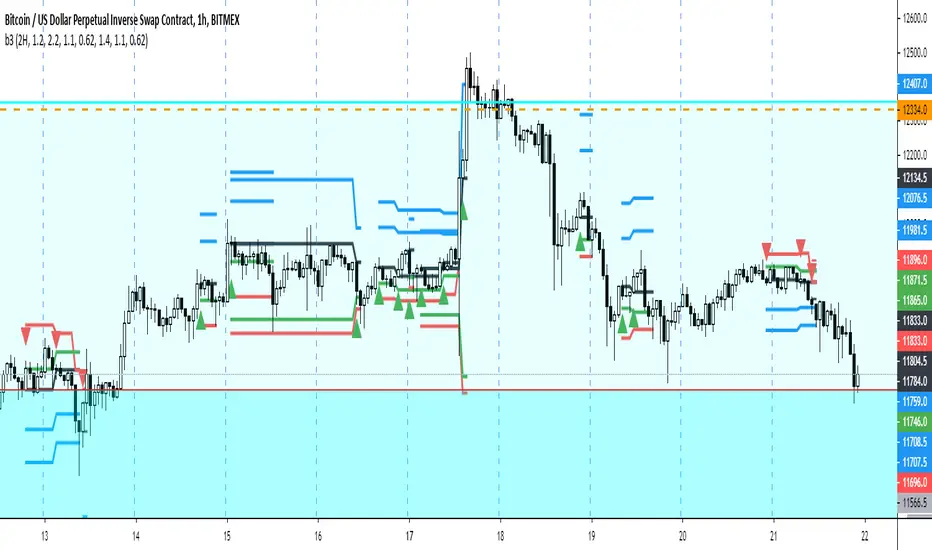
b3b3 combines the best of savvy trader and bot buddy. The indicator is using a customized signal based off volume, trend, customized averages and ATR. The indicator is meant to help traders know when to get into trades, where to place Stoplosses and where to TAKE PROFITS. The indicator will find all the locations and entries for you. In addition to this, the indicator is tracking trend (which is adjustable to different time frames) and only allowing signals that are flowing with the trend to help filter out any addition noise.
Green arrows are longs
Red arrows are shorts
Green lines are your best entries for limit orders
Blue lines are take profits
Red lines are SL's
Please PM me access
Tool: Chop and Trade Zones (v2)This is a refactored and advanced version of my filter tool "Chop and Trade Zones"
A simple yet powerful way to filter out choppy ranges or sideways moves without missing out on good trades.
It calculates the %-distance of the price to a moving average so you can ignore buy/sell signals around the center line.
The upper and lower line are thresholds to catch reversals of the trend when the distance to moving average is increasing.
New Features:
More than 60+ Moving Averages to choose from
Multi-Timeframe Selection with Repaint Protection
Signal Plot so you can access the signal from another TradingView study/strategy (0 = No Trade Zone / 1 = Long Only / 2 = Short Only / 3 = Long & Short Allowed)
Alerts for Long/Short Zones (you could enable/disable your trading bots automatically)

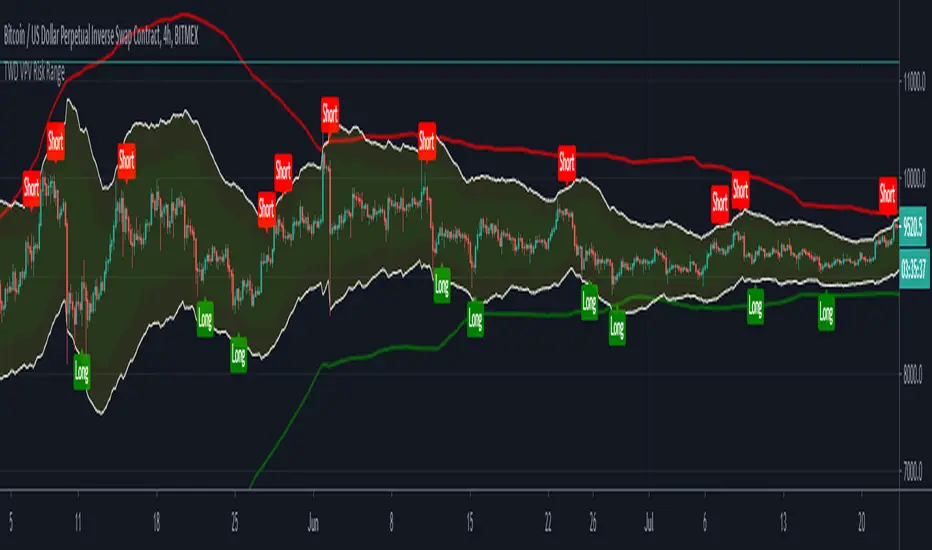
TWD VPV Risk RangeThe 'TradingWithDan Volume Price Volatility Risk Range' indicator identifies two risk ranges based on the volatility and volume of the underlying asset. It then uses those to identify when the trend towards the top or bottom of the risk range is potentially reversing and issues a 'long' or 'short' signal.
The larger risk range is identified by the red and green lines is used to visualise the larger context of the price movement so when the top of the smaller risk range approaches the larger risk range line then the upward trending movement is potentially reaching exhaustion and there is a greater risk of downside. The opposite is also true when the bottom of the smaller risk range approaches the lower larger risk range line.
This indicator is designed to be used in a trending market, either up or down and if for example you have identified an asset that is in an uptrend, or an asset you wish to accumulate, you can take partial position entries at the 'buy' signals and take partial profits at the 'sell' signals. You can use it effectively in a none trending market, taking the outright short or long potions, but you will be at risk of a trend developing.
The indicator isn't designed to identify trends, but to identify sell and buy entries that occurs due to the natural Brownian motion of the price action.
It is designed for my style of trading where I do not enter the entirety of my intended position in one go and will take partial profits when there are price movements towards the top of the risk range if I am long and then put more of the position back on towards bottom of the risk range and vice versa if I am short an asset. It is especially useful for managing my long term core positions and finally I use the alerts to trigger automated trading bots for my positions using the signals.
It can be used on a wide range of assets and on all time frames.
TA Night Bot AlertsThe absolutely most insane indicator for the Cryptoassets
With this script signals for short and long positions are recognized. It still has some false signals during extreme market movements, furthermore it runs best in the 15min & 5min chart. You can increase your risk limit in the settings. The indicator is based on different indicator values.
the indicator is a component of a superordinate algorithm and therefore not perfect.
who would like to test it pm
BTC
ETH
EOS
XRP

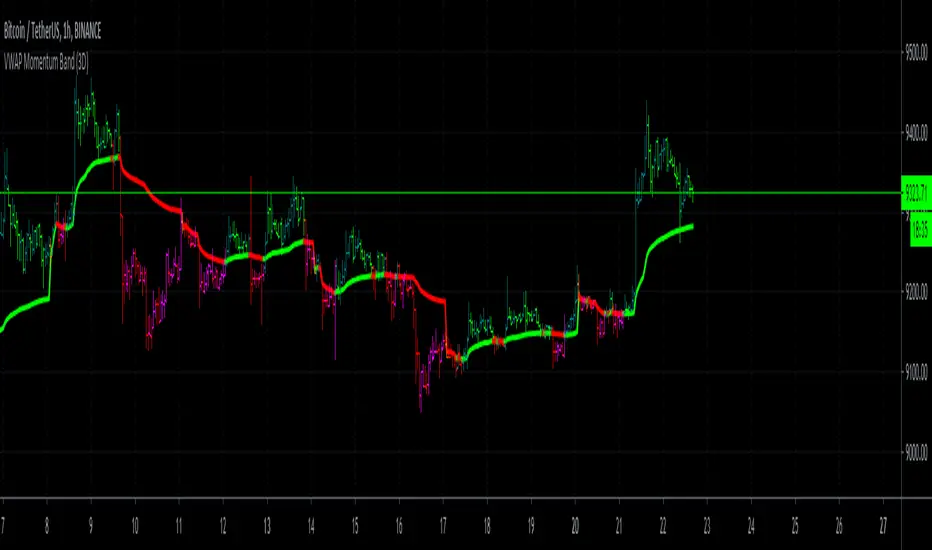
VWAP Momentum BandHow to use:
This should always be used in a bar chart. You as a trader actually just have to look for the color of the band in the middle, it tries to indicate you the coming up price action it also shows you where there is gaining momentum into your direction.
Band is green, what to do ?
Shown with the darker green candles and loosing momentum with the lighter green candles for the upward direction.
Band is red, what to do ?
Shown with the darker red color is momentum to the downwards direction and pink or lighter red color in the bars indicate loosing momentum to the downward direction.
If used correctly this indicator can also be used to feed trading bots via the Trading View Alerts.
Here are a few chart examples:
For example this for daytrading Tesla Stock.
Or daytrading NIO
If there are any questions left open, please send us a direct message!
HFT Momentum IndicatorDefault Settings are meant to be used in XBT/USD chart on 1 hour time frame. If you want to use for another asset on another time frame YOU MUST CHANGE THE SETTINGS
This is momentum-based strategy designed by HFT Research in order to take advantage of volatile, trending markets.
Use ADX
ADX stands for average directional index . It is an indicator that measures volatility in the market. Unfortunately, the worst market condition for this strategy is sideways market. ADX becomes a useful tool since it can detect trend. If the volatility is low and there is no real price movement, ADX will pick that up and will not let you get in trades during a sideways market. It will allow you to enter trades only when the market is trending.
Use MA CrossOver
This strategy’s main driver is the moving average cross over however, unlike many other indicators, this strategy has ALL the moving averages that are on trading view. Total of 13 different moving averages all calculated in a different fashion available in a drop-down menu. You are able to choose two different moving averages to cross for your entry as well as being able to adjust the length of each individual moving average.
Use MA Spread % Filter
As an extra protection, we introduced MA spread % filter. We all know that momentum strategy works when there is actually a trend that has momentum. When there is no trend and market side choppy, we get a lot of noisy signals. In order to battle that we have introduced MA spread % filter. Using this piece of setting, you will be able to chose how strong the cross over actually is. If price is moving sideways, the moving averages will cross each other barely. If the price has actually any steam and momentum, MA 1 will cross over MA 2 aggressively because it will be trending market.
First you chose what the minimum % difference there should be between your 2 moving averages. If you keep this too tight, it won’t be as useful and if you keep this too large then the script will not generate any signals. Trust us, there is a fine balance in between! Then you proceed to chose your moving averages that the bot should keep track of.
Check our website for more information.

Bitcoin1% : High Leverage Indicator______________________________________________________________________________________________________________________
NOTE: Bitcoin1% is designed to work EXCLUSIVELY on BYBIT BTCUSD PERPETUAL CONTRACT chart on 1min TimeFrame on regular Candles
______________________________________________________________________________________________________________________
Bitcoin1% is a specialised indicator suite designed to catch 1% Bitcoin moves in either direction for High Leverage Trading.
Example: At 10x leverage catching 1% Bitcoin move will yield 10% profit
__________________________________________________________
Mechanism Of Action:
1. Identify trend: The script observers multiple parameters on higher timeframes to identify general trend & strength.
2. Take position: Once the trend is identified the script intends to take high probability positions for a 1% move in the direction of the trend. Currently there are 21 conditions that use bespoke datasets, along with conventional datasets like RSI , MA, VWAP to filter & identify high probability entries.
3. Take profits: There are total 4 conditions for exits. Partial Exit & Total Exit for both Longs & Shorts. Although we recommend you book profit at 1% change in price of BTCUSD these 4 conditions will offer high volatility exits along the way, should you choose to hold for longer.
4. Evolving: We learn from mistakes when they happen, bad trades are dissected & studied. New conditions get added & bad trades get filtered out through updates. This keeps the script in sync with the market.
__________________________________________________________
Insight: The script performs best in trending markets, so it avoids trading structureless or sideways movement & expects reasonable judgement on the user's part to avoid trading unusual & directionless market conditions.
Trading Mindset: When Bitcoin1% indicates a long trade, it basically says "BTC is more likely to move up 1% than go down 1% form here" : The script only indicates direction of the next 1% which is all you need for High Leverage Trading. You can set target & stop at 1% & try different variations with experience.
Have Questions? Feel free to PM me on TradingView

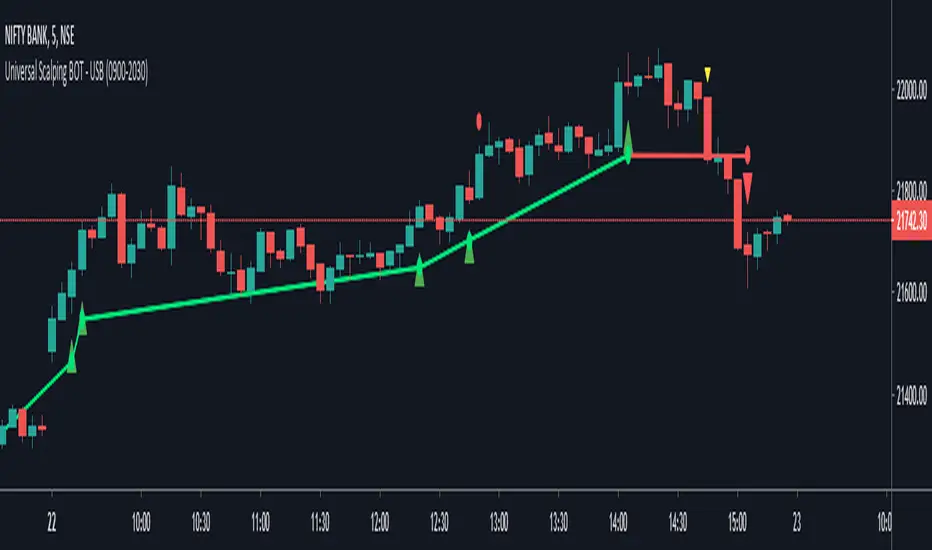
Universal Scalping BOT (USB) - With AlertsThis Study Is based on
• RSI
• Moving Average
• Candlestick price action and
• Bulls Bears calculation.
This Study is Also has alerts inbuilt.
Alerts are for:
• Buy Active
• Buy Profit Achieved
• Buy Loss Hit
• Sell Active
• Sell Profit Achieved
• Sell Loss Hit
How to trade ?
• When Green big Up triangle Comes, Buy that time and book profit at red small circle and book loss at yellow down small triangle.
• When Red big Down triangle Comes, Sell that time and book profit at green small circle and book loss at yellow up small triangle.
► Options Available In Setting:
To Show / Hide :
• Target Line
• Stop-Loss Line
• Define Trading Sessions
► Trailing SL is calculated on candle stick price action and not on Average True Range.
Test Yourself and give feedback.
PM us to obtain access.
[astropark] AltwalkerDear Followers,
since today you can enjoy Altwalker , a new Swing and Scalping Strategy based on a simple trend following theory , mainly designed for Cryptocurrencies, Altcoins and of course Bitcoin.
It works also on all timeframes, but it's suggested to use it on higher ones: 1D - 12h - 6h - 4h , not suggested to use it below 1h-30m.
Based on Moving Average, Altwalker dynamically identifies market resistance and support, so in which trend a cryptocurrency is during time:
green trendline and background means bullish trend , in fact it start with a "buy" signal
red trendline and background means bearish trend , in fact it start with a "sell" signal
if a series of buy and sell appears (this may happen especially in lower timeframes), this mean price is in consolidation or distribution phase, so be prepared for a new trending phase coming soon, always remembering that taking profits is awesome and managing your risk by defining you position size and having a stoploss is a must in trading
Altwalker integrates also 2 special tools besides the trend highlighter:
MoneyFlow Signals , which appear as Red and Green tiny Triangles , highlight when money are starting flowing in (green - bullish sing) or out (red - bearish sign)
Overbought and Oversold RSI Signals , which appear both as darker background (the darker the color, the more the price is in overbought/oversold) and green "ob"-"tp" / red "os"-"tp" labels (they optionally pop up only on a configurable stronger overbought/oversold condition)
You can edit many options in order to
enable/disable showing buy/sell signals
enable/disable showing trendline
enable/disable showing trend as background
enable/disable showing moneyflow signals
edit moneyflow period of analysis (I suggest a number between 70 and 100 in general)
enable/disable showing rsi signals
edit rsi length, overbought and oversold levels
The user who wants to use this strategy, especially via an automated bot, must always set a stoploss (example 150$ from entry on bitcoin) or use a proper risk management strategy .
This is not the "Holy Grail", so use it with caution. It's highly suggested to use a proper money management .
This script will let you set all notifications you may need in order to be alerted on each triggered signals.
Here there are some examples how Altwalker works and results you can get following its buy/sell trend suggestions.
LINKUSDT 1D
BNBUSDT 1D
ATOMUSDT 1D
XTZUSDT 1D
ETHBTC 6h
XBTUSD 1D
XLMUSDT 1h
VETBTC 6h
LTCBTC 6h
Here there are some examples how MoneyFlow signals give you a nice insight on near future trend - "Follow The Money" .
ETHUSD 1D
ETHBTC 1D
This is a premium indicator , so send me a private message in order to get access to this script.

BITMEX TOOL - open/close positions in BITMEX - JSBOTBitmex tool with risk management
- Open positions in Bitmex from tradingview by alerts
- Set order quantity(bitmex account’s percentage), entry P rice, stoploss, takeprofit, trade direction and type order
- The entry price and the stoploss are in the same alert, if you want only open a position without a stoploss you should set it in zero (0)
- Take profit is optional so is in other alert
- If you chose Limit, when the alert is triggered an order will placed at $5 below the entry price in longs positions or $5 above the entry price in short positions (the same with the take profit)
- This indicator works with JSBOT (jsbot.online)
If you need more flexibility use the JSBOTs commands to set any indicator as you want
MACD StrategyThis script sends buy and sell signals as alerts to 3Commas (online software with trading bots in cryptocurreny)
It's based on 2 indicators:
- MACD
- 12 EMA and 26 EMA
When the 12 EMA and 26 EMA crossover, the MACD line crosses above 0. The goal here is to look for buy signals when the MACD and Signal are below 0, the histogram is positive, and there was or will be a 12 EMA and 26 EMA crossover.
I struggle with the following:
- There are multiple ways to use this as a crossover signal. I want to calculate the win rate of every posibility.
- What should be my take profit and my stoploss?
I think a 2:1 R/R,and a 60% win rate would make a great strategy! I could use some advice.
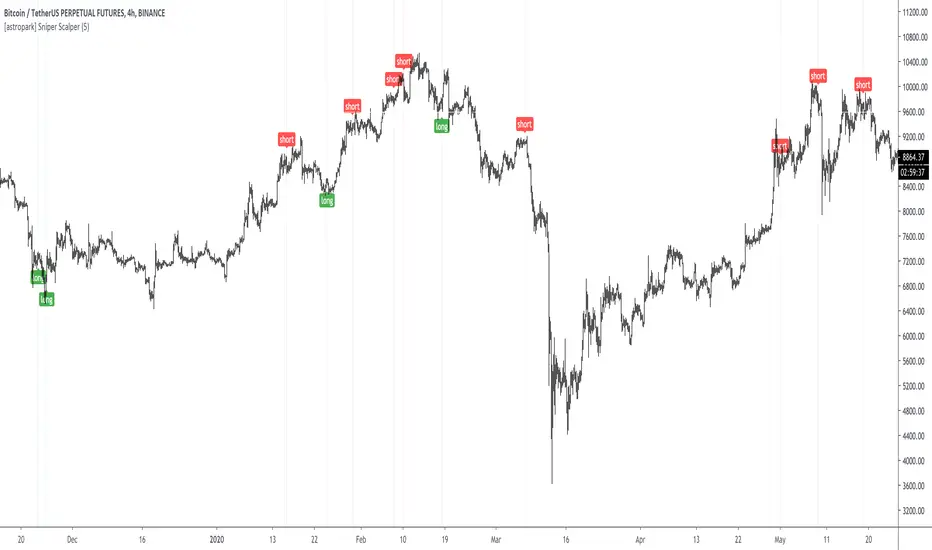
[astropark] Sniper ScalperDear Followers,
today a new Scalper Tool , which works great on all timeframes , from 1 minute to 1 month!
Keep in mind that this is a Scalper, so it's always a good idea to take or lock your profits, despite you may use it also for swing trading.
This tool has some cool features:
it works on all timeframes , from 1 minute to 1 month!
you can change a filter option from 1 (lowest) to 7 (highest)
Here some examples on how it performs on many timeframes and charts.
EURUSD 15m chart
AMZN 1h chart
Bitmex XBTUSD 4h chart
Bitfinex ETHUSD 1h chart
Binance Chainlink LINKBTC 1h chart
Binance Ethereum ETHBTC 1h chart
GOLD XAUUSD 15m chart
The user who wants to use this strategy, especially via an automated bot, must always manage to set a take profit and stoploss, as well as use a proper money and risk management strategies .
This is not the "Holy Grail", so use it with caution.
This is a premium indicator , so send me a private message in order to get access to this script.
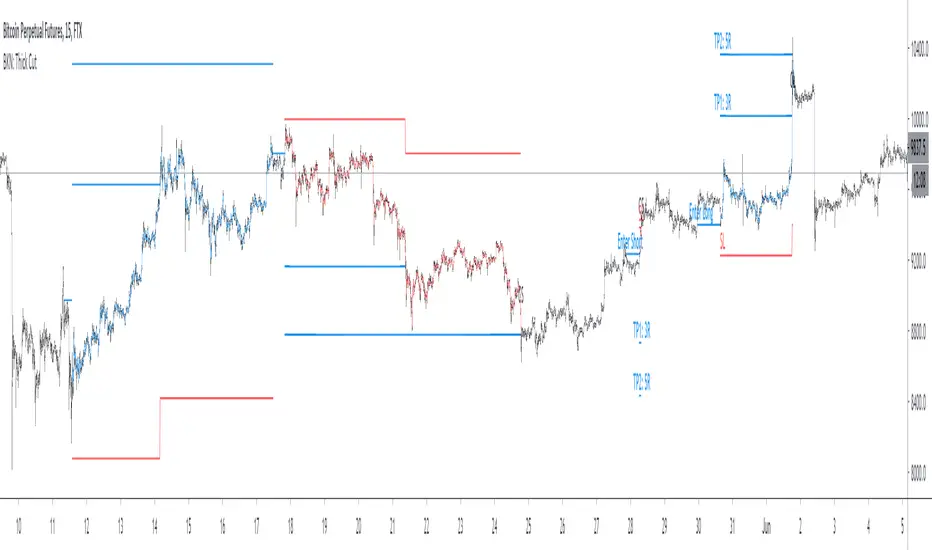
BKN: Thick CutThick Cut is the juiciest BKN yet. This indicator is created to take a profitable trading strategy and turn it into an automated system. We've built in several pieces that professional traders use every day and turned it into an algo that produces on timeframes as low as 1, 3, and 5 minutes!
Limit Order Entries: When criteria is met, an alert is signaled that will send a value to enter a position at a limit price.
Built in Stop Loss: A stop is built in and the value can be sent to your bot using the {{plot}} function or you can rely on a TradingView alert when the stop is hit.
Built in Take Profits: We've built in two separate take profits and the ability to move your stop loss to breakeven after the first take profit is hit. Even if you take 50% profit at 1R and move your stop loss, you already have a profitable trade. Test results show 50% profits at 2R and the remainder at higher returns result in exceptional results.
Position Sizing: We've built in a position size based on your own predetermined risk. Want to risk $100 per trade? Great, put in 100 in the inputs and reference a quantity of {{plot("Position Size")}} in your alert to send a position size to the bot. You can also reference {{plot("Partial Close")}} to pull 50% of the position size closing 50% at TP1 and 50% at TP2.
Backtest results shown are very short term since we are viewing a 15m chart. This can be a profitable strategy on many timeframes, but lower timeframes will maximize results.
A unique script with incredible results. Further forward testing is live.
***IMPORTANT***
For access, please do not comment below. Comments here will not be replied to. Please send a DM here or on my linked Twitter . At this time, this strategy is considered a Beta release as we continue to fine tune settings and more. Expecting 2 weeks of beta with official release around June 6.
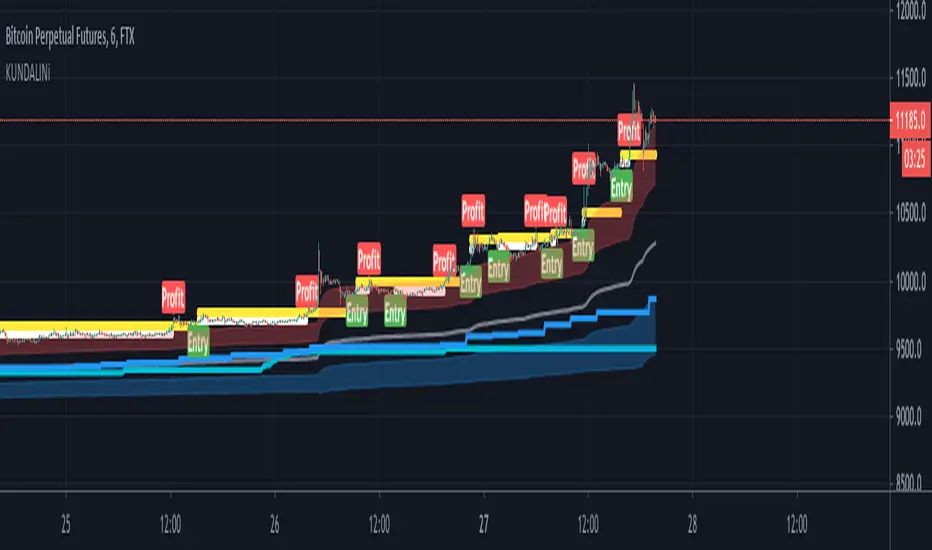
KUNDALINiThis is the STudy Version of The Kundalini is a technical indicator. Based on algorithm calculations, this indicator extrapolates the previous price for the next bar. Plus addition Multi time frame ATR volatility Reading environment for higher conditions
Here is how Dominator is calculated:
1. The study estimates the price projected for the next bar. The estimated price is based on the algorithm method.
2. The study extrapolates this value to find a projected price change for the next bar.
The resulting extrapolated value is shown as a histogram on a lower subgraph. By default, sections of the histogram where the extrapolated value is increasing are shown in green; sections corresponding to the decreasing value are shown in red.
Note: Value projection is purely mathematical as all calculations are based on algorithm averaging of previous values.
additional volatility models clouds on blue and red for bearish and bullish markets
Overlay True
The strategy includes 3 different adjustable levels for the ladder , plus automatic adjustable stop loss and takes profit calculated from your average entry price after each ladder adds.
Adjustable BAcktest Window.
1 long signals
3 ladder long add signals
1 short signals
3 ladder short add signals
1 dynamic stop calculated from your average entry price
1 dynamic take profit calculated from your average entry price
Please Private Msg me if you like more info about the script Full pdf available or if you need access to it
thx for your time and support
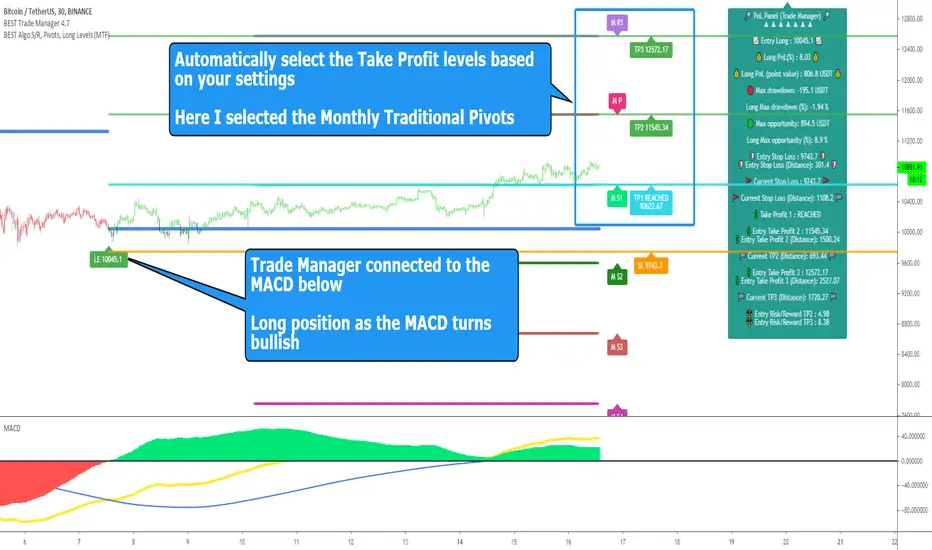
[Daveatt] BEST Trade Manager Pivots 1.0Hello BEST traders
The BEST Trade Manager got upgraded with many more features
This version allows setting automatically the TP levels on either Fibonacci/Traditional/Camarilla/Woodie pivots
I. 💎 SCRIPTS ACCESS 💎
1. Available only with one-time payment on my website.
2. My website URL is in this script signature at the very bottom (you'll have to scroll down a bit and going past the long description) and in my profile status available here: Daveatt
3. Many video tutorials explaining clearly how all our indicators work are available on your website > guides section.
4. You may also contact me directly for more information
II. 🔎 What is the BEST Trade Manager?🔎
2.1 Concept
The BEST Trade Manager is compatible with any indicator.
Once connected, it adds another layer of good stuff with real-time user custom defined stop loss (8 available options), take profits (4 possible options) + alerts compatible for trading automation.
2.2 How hard is it to update your indicator?
We'll send to our customers, a comprehensive and easy tutorial, to make any indicator compatible.
I guarantee you, it should take no more than 2 minutes per indicator. We made it easy, fun, and awesome. #bolder #statement
III. The amazing benefits of our Plug&Play system
I hope you're ready to be impressed. Because, what I'm about to introduce, is my best-seller feature - and available across many of my indicators.
The BEST Trade manager can be connected to any external indicator
Let's assume you want to connect your RSI divergence to your Trade Manager.
I mentioned an RSI divergence but you may connect any oscillator ( MACD, On balance volume, stochastic RSI, True Strenght index, and many more..) or non-oscillator (divergence, trendline break, higher highs/lower lows, candlesticks pattern, price action, harmonic patterns, ...) indicators.
THE SKY IS (or more likely your imagination) is the limit :)
We go in-depth on our website why the Plug&Play is an untapped opportunity for many traders out there - URL available on my profile status and signature
IV. 🧰 Features 🧰
Candles can be colored to highlight the trend direction better [/b [
4.1 Stop-Loss Management
For what's following, let's assume that 2 is the stop-loss value you inserted in the indicator, and the Algorithm Builder gives a BUY signal.
This is NOT a recommendation at all, only an example to explain how this feature works.
- %Trailing: The Stop-Loss starts 2% away from the entry price - and will move up (because we're on a BUY trade as per our example) every time your trade will gain 2% profit
- Pips Trailing: Same as above but using a distance in pips/USD value
- Percentage: The Stop-Loss stays static 2% away from the entry price. There is no trailing here
- TP Trailing: Trail your stop-loss every time a Take Profit level is hit
- Supertrend: embedded supertrend use as a trailing stop
- Fixed: Set the Stop-Loss at a fixed position (value should be in currency/units)
- ATR multiple: Set the Stop-loss at a multiple of ATR
- External connector: Let's say your indicator already contains embedded stop-loss levels, you can add them in the Trade Manager
4.2 Take Profits Management
You can manage up to 3 take profit levels defined as a percentage or price value or ATR multiple.
The expected input is in percentage value (for instance, setting the % target of TP1 to 2% will set the TP1 level 2% away from the entry price
This version allows setting automatically the TP levels on either Fibonacci/Traditional/Camarilla/Woodie pivots
4.3 Built-in Risk-to-Reward Panel with real-time analytics
The good stuff doesn't stop here.
You'll notice that this sometimes green (when in a LONG), sometimes red (when in a SHORT) panel at the right of your chart.
- Entry Price: the price when the Algorithm Builder will give a signal.
- The Trade PnL in percentage.
- Entry Stop Loss: Distance (in currency/units) between the selected stop-loss algorithm (percent, trailing, TP trailing, etc.) and the entry price.
- Entry TP1/TP2/TP3: Distance (in currency/units) between the entry price and the first take profit
- Risk/Reward TP1/TP2/TP3: Using the Stop-loss distance at entry, and Take Profit 1/2/3 at the entry to compute the risk-to-reward ratio.
- Max drawdown and Max opportunity (value and percentage): respectively the maximum loss and maximum win per trade
For more details, please check the guides section of my website. Links are in my signature and profile status.
V. 🔔 Alerts 🔔
We enabled the alerts on the:
1. Stop-Loss hit
2. Take Profit 1/2/3 hit
3. custom hard exits based on either MACD / RSI divergence/ MM cross
5.1 🤖 Compatible with trading bots? 🤖
It's compatible with all third-parties out there capturing alerts and forwarding them to the brokers.
We enabled TradingConnector and ProfitView alert templates so far.
If you have any doubts or questions, please hit me up directly or ask in the comments section of this script.
BEST regards,
Dave

The AlphaAll assets are dictated by buyers and sellers at the bid and offer. The conviction of the auctioning process is always determined by volume as it represents the willingness of participants to participate at certain prices. Volume is the key force behind markets and is key to identifying major moves. When volume increases sharply without a significant change in an assets price, the price will eventually jump upward or fall downward based on these internal dynamics. You can glean a lot about a trend based on the buy and sell volume balance, as it often provides clues on the direction of a break during periods of consolidation. A strong, rising volume force should accompany an uptrend and should taper off towards the latter stages of the trend. The same applies during a downtrend.
Using these principles, I designed the Alpha, which is a combination of multiple volume and momentum based oscillators, capable of identifying trend and providing volume signals before a shift in participation occurs. The Alpha was developed with opposing goals in mind: i) to be sensitive enough to signal shifts in momentum and identify short-term tops and bottoms; and ii) be accurate enough to identify the long-term in flows and outflows into any asset at certain prices through time. The Alpha is an all-in-one oscillator, and has been fine-tuned and smoothed for optimal results. When all of these indicators converge, Alpha projects a green pulse signal. The green signal is characterised by extreme selling momentum, and a shift in the money flow index.
How to use it:
The Alpha is one of 3 automated swing strategies I have personally running at present. The Alpha was designed to catch onto momentum shifts with the explicit intention of catching trending moves. While the signals can fluctuate in a bracketed environment, its efficacy comes from catching large moves (see image 1 below).
Many are accustomed to using indicators like the On-balance volume (OBV) indicator to gage momentum and volume changes to make inferences on sentiment and overall market direction. While I find it to be a useful indicator, it generally lags and often give meaningless signals that don't translate to actionable set ups on an intra-day basis. The Alpha not only is more receptive, it also is optimised to pick up divergences in momentum. Image 2 and 3 below aptly illustrate this point.
Recommended timeframe:
The automated strategy I have running is set on the D-2, D-3 and the H-12. That said, you can use it on the D-1, weekly or even the monthly to infer shifts in macro trend. The bot sets a hard stop and is designed to cut its losses rapidly whilst riding its winners. For this indicator, I would recommend using higher time periods mentioned above as this is what it was inherently designed for. That said, I recognise many want to trade on an intra-day basis, so my recommendations would be to use the H-12 or H-8. This indicator does not repaint once the candle has closed, however, it will provide an early signal if momentum is starting to shift. If you want to front run the close, you can be aggressive and take a position, however, my advise would be to wait for confirmation upon a candle close.

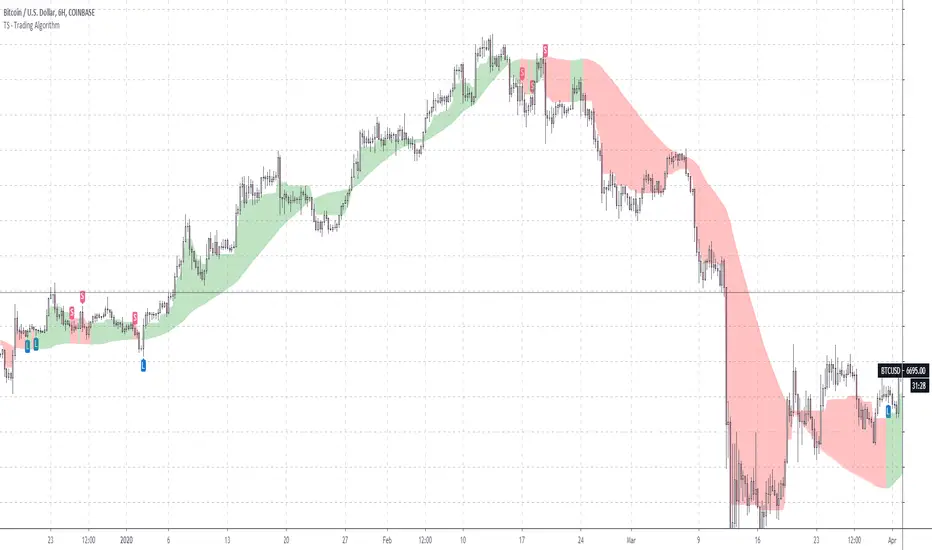
TS - Trading Algorithm - StrategyStrategy to the bespoke TS - Trading Algorithm . Highly profitable cryptocurrency trading model.
Access to both the backtesting strategy & indicator is paid - PM me for details.
Indicator does not repaint and has no discretionary approach - you can follow blindly and take advantage of the performance.
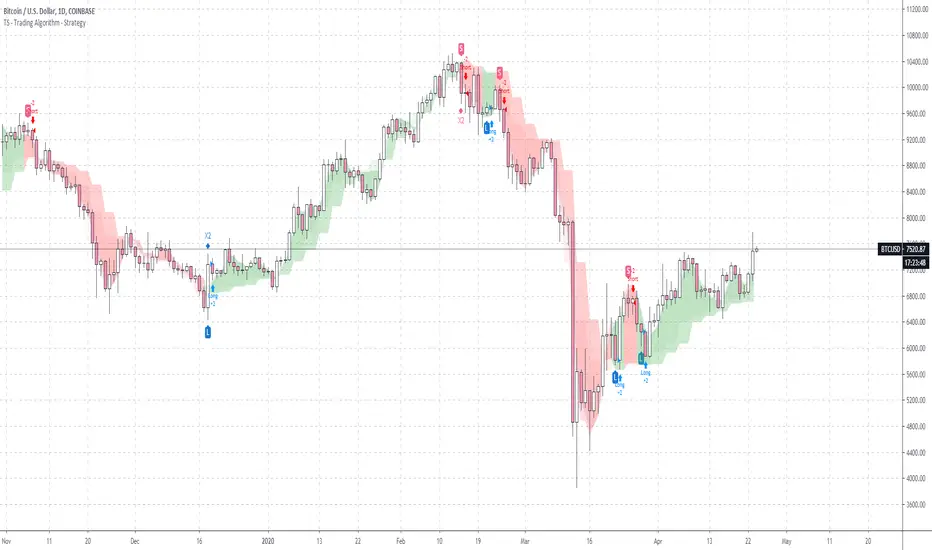
TS - Trading AlgorithmWhat is it?
The Tradespot MA Algo is an all in one, profitable moving average based trading strategy that presents long and short opportunities.
This indicator does not repaint. Once a bar has closed, the signal will remain permanently printed onto the chart.
What can I do with it?
Use on the following markets:
COINBASE:BTCUSD
COINBASE:ETHUSD
COINBASE:ETHBTC
Timeframe: 1D
What does each signal mean?
Long label is a strong buy signal
Short label is a strong sell signal
X's indicate a warning telling you that you should possibly exit your position. You should review these signals alongside other indicators such as volatility.
Review X signals?
Yes, there are concrete buys and sells but the X's indicate possible exits that might also be fakeouts, we can created the perfect indicator set up to review these with our TS - Trend Confirmation indicator and our TS - Volatility Screener indicator
How do I get access?
Please contact me on TradingView for details.