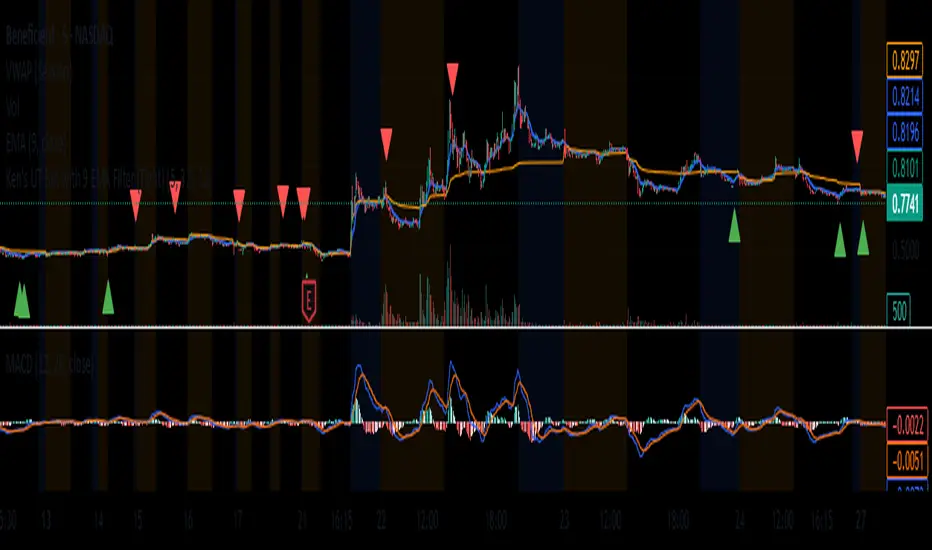
BoilerRoomColdCaller - 3Commas Grid Bot SignalThis is very similar to 3Commas' grid bot, the range is from the previous 7 days' lowest low decreased by 3% to the previous 7 days' highest high increased by 3%, you can also adjust if you want 7 days' highest/lowest close price as your range or highest high and lowest low as your range. 10 buys and 10 sells within the range, the unit price would be (high-low)/19.
The buy signals and the sell signals will be triggered if:
- The previous close is below one specific green line (buy line), and the current close is above that specific green line, or
- The previous close is above one specific green line (buy line), and the current close is below that specific green line
Thus, whether the price is dropping below these lines or rising above these lines, a buy or sell signal will be triggered when they cross green or red lines. Your entry price will be the next open price after this candle's close reaches the lines.
Big thanks to @glaz, who helped me a lot with this script. Please give a like button and share if you like this script. Let me know if you have questions, thanks guys.
在腳本中搜尋"bot"
Pump AlertsMy very first indicator in Pine Script with two alert conditions for trading bots.
It's based on " Pump Catcher " by @ joepegler
I modified some parts, hopefully improved the usability and enabled alerts, so you can use it to trigger bots like 3commas via webhooks.
Pump Alerts 🚀 attempts to "detect moments of abnormal and accelerating increase in volume" AKA "pumps". Small and big pumps.
I recommend using it on small timeframes like 1 to 15 min and tinkering with the lookback period as well as threshold values.
Other than that it's pretty self-explanatory and beginner-friendly.
Free and Open Source. Let me know how you use it!
HXRO Bot Backtest Time HighlightThis script allows you to highlight the HXROBot backtest interval with the possibility of fragmenting the view to better identify the key areas of your strategy
TradersAI_UTBotCREDITS to @HPotter for the orginal code.
CREDITS to @Yo_adriiiiaan for recently publishing the UT Bot study based on the original code -
I just added some simple code to turn it into a strategy. Now, anyone can simply add the strategy to their chart to see the backtesting results!
While @Yo_adriiiiaan mentions it works best on a 4-hour timeframe or above, I am happy to share that this seems to be working on a 15-minute chart on e-mini S&P 500 Index (using the KeyValue setting at 10)! You can play around with the different settings, and may be you might discover even better settings.
Hope this helps. Btw, if any of you play with different settings and discover great settings for a specific instrument, please share them with the community here - it will be rewarded back multiple times!
UT Bot No scammers allowed. I protect CT
This dude on Twitter @TradingScript(UT Bot) tried to take this free script and sell it.
All the inputs he put in are there to make it look complex and don't actually do anything.
The only thing that changes is "Key Value". This is the ATR multiplier and in basic terms determines the sensitivity on the indicator. The original setting by HPotter is 3.5 multiplier (key vaule) and an ATR period of 5.
So yeah I recreated the script.
**If you compare this to that scammers script 95% of the signals are the same, I don't know the exact setting he used..
**HPotter is a Legend
3 EMAs with Crossing Alerts & 2 SMAsHi all,
This is a simple indicator that plots 3 EMA lines and 2MAs of your choice to the screen and has built in alert triggers.
Features:
1) Alerts are triggered when EMAs 1 (Signal line) and 2 (Baseline) cross - a Long signal is called if the cross is above EMA 3 ( Trendline ), a short if the cross is below EMA3
2) Signals are represented visually as a triangle on the chart, below the candles is a long, above is a short
3) TradingView Alerts can be easily set as I have labelled the signals clearly as many other Indicators like this aren’t easy to work out if trying to create alerts to trigger a 3commas bot, for example!
Each EMA is fully customisable and if you wish to take advantage of the alerts, only a few simple rules need to be followed:
EMA1 needs to be less than EMA2.
EMA2 needs to be the same or greater than EMA3
That’s it, happy trading!
Dragon-Bot - Default ScriptDragon-Script is a framework to make it as easy as possible to test your own strategies and set alerts for external execution bots. This is the alerts version of the script.
The script has many features build in, like:
1) A ping/pong mechanism between longs and shorts
2) A stop-loss
3) Trailing Stops with several ways to calculate them.
4) 2 different ways to flip from long to short.
The script is divided into several parts.
The first part of the script is used to set all the variables. You should normally never change the first part except for the comments at the top.
The second part of the script is the part where you initialise all your indicators. Several indicators can be found on Tradingview and on other sites. Please keep in mind that all the variable names used in the indicator should be unique. (all the … = … parts)
The third part of the script, is the most important part of the script. Here you can create the entry and exit points.
Let’s look at the OPENLONG function to explain this part: The first variables are all the possible entries; These are longentry1 till longentry5. You can add many more if you like.
The variables are all initialised as being false. This way the script can set a value to true if an entry happens.
The if function is the actual logic: You could say “if this is true” then (the line below the if function) longentry1 := (becomes) true.
In this case we have said: “if this is true” then (the line below the if function) longentry1 := (becomes) true when the current close is larger than the close that is 1 back.
The last part is the makelong_funct. This part says that if any of the entries are true, the whole function is true.
The last part of the script is the actual execution. Here the alerts are plotted and the back test strategies are opened and closed.
We hope you guys like it and all feedback is welcome!
Dragon Bot - Default ScriptDragon Script is a framework to make it as easy as possible to test your own strategies and set alerts for external execution bots.
The script has many features build in, like:
1) A ping/pong mechanism between longs and shorts
2) A stop-loss
3) Trailing Stops with several ways to calculate them.
4) 2 different ways to flip from long to short.
The script is divided into several parts.
The first part of the script is used to set all the variables. You should normally never change the first part except for the comments at the top.
The second part of the script is the part where you initialise all your indicators. Several indicators can be found on Tradingview and on other sites. Please keep in mind that all the variable names used in the indicator should be unique. (all the … = … parts)
The third part of the script, is the most important part of the script. Here you can create the entry and exit points.
Let’s look at the OPENLONG function to explain this part: The first variables are all the possible entries; These are longentry1 till longentry5. You can add many more if you like.
The variables are all initialised as being false. This way the script can set a value to true if an entry happens.
The if function is the actual logic: You could say “if this is true” then (the line below the if function) longentry1 := (becomes) true.
In this case we have said: “if this is true” then (the line below the if function) longentry1 := (becomes) true when the current close is larger than the close that is 1 back.
The last part is the makelong_funct. This part says that if any of the entries are true, the whole function is true.
The last part of the script is the actual execution. Here the alerts are plotted and the back test strategies are opened and closed.
We hope you guys like it and all feedback is welcome!
[Alerts]QQE Cross v6.0 by JustUncleLDescription:
This is a major upgrade of my original QQE indicator Tool, this version is directed at Forex and Crypto Margin trading. This version can also be used with AutoView/ProfitView Chrome add-on in a semi-automatic (turn on only when conditions are favorable) or automatic way, with Signal to Signal or Signal to Close trading.
This is a Trend following indicator that uses fast QQE crosses to capture swings in direction of the main Trend. Alerts are filtered with Two Moving Average Ribbons and/or Direction of MAs. The QQE or Qualitative Quantitative Estimation is based on the relative strength index (RSI), but uses a smoothing technique as an additional transformation. Three crosses can be selected (all selected by default):
Smooth RSI signal crossing ZERO (XZ)
Smooth RSI signal crossing Fast QQE line (XQ), this is like an early warning swing signal.
Smooth RSI signal exiting the RSI Threshhold Channel (XC), this is like a confirmed swing signal. An optimal Smooth RSI threshold level is between 5% and 10% (default=10), it helps reduce the false swings.
These signals can be selected to Open Short/Long and/or Close a trade, default is XC open trade and XQ (or opposite open) to Close trade.
The (LONG/SHORT) alerts can be optionally filtered by the Moving Average Ribbons:
For LONG alert the Close must be above the fast MA Ribbon and fast MA Ribbon must be above the slow MA Ribbon.
For SHORT alert the Close must be below the fast MA Ribbon and fast MA Ribbon must be below the slow MA Ribbon.
and/or directional filter:
For LONG alert the Close must be above the medium MA and the directional of both MA ribbons must be Bullish.
For SELL alert the Close must be below the medium MA and the directional of both MA ribbons must be Bearish.
This indicator is designed to be used as a Signal to Signal trading BOT in automatic or semi-automatic way (start and stop when conditions are suitable).
For LONG and SHORT alerts I recommend you use "Once per Bar" alarm option
For CLOSE alerts I recommend you use "Once per Bar Close" alarm option
(* The script has been designed so that long/short signals come at start of candles *)
(* and close signals come at the end of candles *)
Build A BotThis is the Robot we built during the 60 Minute Build-A-Bot webinar on September 12, 2018. We had a great time, and a lot of participation and the best part was that we finished up this robot and even ran a backtest in exactly 60 minutes! We built this robot based on recommendations and suggestions from those who were attending live. Lots of pieces in this robot, but you can always tinker with it, remove stuff, add things, whatever you want!
This version uses the CCI as a trigger for trade entry. The other version uses the Hull Moving Average as a trigger for trade entry.
Build A Bot Hull TriggerThis is the automated trading system we built during the 60-Minute Build-A-Bot webinar on September 12, 2018. We had a lot of fun, and implemented a TON of indicators LIVE during this webinar! And the best part is that as a group we researched, designed, and built a profitable robot in exactly 60 minutes!
We started by voting on the type of trading system, and this is a trend following system because it got the most votes. Then, the attendees in the webinar sent in their suggestions for indicators and settings during the live webinar (still counting toward the 60 minutes). Once we had the indicators on the chart, and we discussed various settings we could use, we got to work building the robot, and ran the first strategy test...and it was profitable!
This version uses the Hull Moving Average as a trigger for initiating the trade, and everything else is the same for the filters. The other version uses the CCI as a trigger for the trade, and many other indicators as filters.
simple botthe AI=
value of close of candle < value of close of candle previous by 1 = sell
close > close1 = buy
closeorder on SL
closeorder on AutoProfit
closeorder on signal reverse (if openorder not in profit)
MACDouble + RSI (rec. 15min-2hr intrv) Uses two sets of MACD plus an RSI to either long or short. All three indicators trigger buy/sell as one (ie it's not 'IF MACD1 OR MACD2 OR RSI > 1 = buy", its more like "IF 1 AND 2 AND RSI=buy", all 3 match required for trigger)
The MACD inputs should be tweaked depending on timeframe and what you are trading. If you are doing 1, 3, 5 min or real frequent trading then 21/44/20 and 32/66/29 or other high value MACDs should be considered. If you are doing longer intervals like 2, 3, 4hr then consider 9/19/9 and 21/44/20 for MACDs (experiment! I picked these example #s randomly).
Ideal usage for the MACD sets is to have MACD2 inputs at around 1.5x, 2x, or 3x MACD1's inputs.
Other settings to consider: try having fastlength1=macdlength1 and then (fastlength2 = macdlength2 - 2). Like 10/26/10 and 23/48/20. This seems to increase net profit since it is more likely to trigger before major price moves, but may decrease profitable trade %. Conversely, consider FL1=MCDL1 and FL2 = MCDL2 + (FL2 * 0.5). Example: 10/26/10 and 22/48/30 this can increase profitable trade %, though may cost some net profit.
Feel free to message me with suggestions or questions.
TRADINGLibrary "TRADING"
This library is a client script for making a webhook signal formatted string to PoABOT server.
entry_message(password, percent, leverage, margin_mode, kis_number)
Create a entry message for POABOT
Parameters:
password (string) : (string) The password of your bot.
percent (float) : (float) The percent for entry based on your wallet balance.
leverage (int) : (int) The leverage of entry. If not set, your levereage doesn't change.
margin_mode (string) : (string) The margin mode for trade(only for OKX). "cross" or "isolated"
kis_number (int) : (int) The number of koreainvestment account. Default 1
Returns: (string) A json formatted string for webhook message.
order_message(password, percent, leverage, margin_mode, kis_number)
Create a order message for POABOT
Parameters:
password (string) : (string) The password of your bot.
percent (float) : (float) The percent for entry based on your wallet balance.
leverage (int) : (int) The leverage of entry. If not set, your levereage doesn't change.
margin_mode (string) : (string) The margin mode for trade(only for OKX). "cross" or "isolated"
kis_number (int) : (int) The number of koreainvestment account. Default 1
Returns: (string) A json formatted string for webhook message.
close_message(password, percent, margin_mode, kis_number)
Create a close message for POABOT
Parameters:
password (string) : (string) The password of your bot.
percent (float) : (float) The percent for close based on your wallet balance.
margin_mode (string) : (string) The margin mode for trade(only for OKX). "cross" or "isolated"
kis_number (int) : (int) The number of koreainvestment account. Default 1
Returns: (string) A json formatted string for webhook message.
exit_message(password, percent, margin_mode, kis_number)
Create a exit message for POABOT
Parameters:
password (string) : (string) The password of your bot.
percent (float) : (float) The percent for exit based on your wallet balance.
margin_mode (string) : (string) The margin mode for trade(only for OKX). "cross" or "isolated"
kis_number (int) : (int) The number of koreainvestment account. Default 1
Returns: (string) A json formatted string for webhook message.
manual_message(password, exchange, base, quote, side, qty, price, percent, leverage, margin_mode, kis_number, order_name)
Create a manual message for POABOT
Parameters:
password (string) : (string) The password of your bot.
exchange (string) : (string) The exchange
base (string) : (string) The base
quote (string) : (string) The quote of order message
side (string) : (string) The side of order messsage
qty (float) : (float) The qty of order message
price (float) : (float) The price of order message
percent (float) : (float) The percent for order based on your wallet balance.
leverage (int) : (int) The leverage of entry. If not set, your levereage doesn't change.
margin_mode (string) : (string) The margin mode for trade(only for OKX). "cross" or "isolated"
kis_number (int) : (int) The number of koreainvestment account.
order_name (string) : (string) The name of order message
Returns: (string) A json formatted string for webhook message.
in_trade(start_time, end_time, hide_trade_line)
Create a trade start line
Parameters:
start_time (int) : (int) The start of time.
end_time (int) : (int) The end of time.
hide_trade_line (bool) : (bool) if true, hide trade line. Default false.
Returns: (bool) Get bool for trade based on time range.
real_qty(qty, precision, leverage, contract_size, default_qty_type, default_qty_value)
Get exchange specific real qty
Parameters:
qty (float) : (float) qty
precision (float) : (float) precision
leverage (int) : (int) leverage
contract_size (float) : (float) contract_size
default_qty_type (string)
default_qty_value (float)
Returns: (float) exchange specific qty.
method set(this, password, start_time, end_time, leverage, initial_capital, default_qty_type, default_qty_value, margin_mode, contract_size, kis_number, entry_percent, close_percent, exit_percent, fixed_qty, fixed_cash, real, auto_alert_message, hide_trade_line)
Set bot object.
Namespace types: bot
Parameters:
this (bot)
password (string) : (string) password for poabot.
start_time (int) : (int) start_time timestamp.
end_time (int) : (int) end_time timestamp.
leverage (int) : (int) leverage.
initial_capital (float)
default_qty_type (string)
default_qty_value (float)
margin_mode (string) : (string) The margin mode for trade(only for OKX). "cross" or "isolated"
contract_size (float)
kis_number (int) : (int) kis_number for poabot.
entry_percent (float) : (float) entry_percent for poabot.
close_percent (float) : (float) close_percent for poabot.
exit_percent (float) : (float) exit_percent for poabot.
fixed_qty (float) : (float) fixed qty.
fixed_cash (float) : (float) fixed cash.
real (bool) : (bool) convert qty for exchange specific.
auto_alert_message (bool) : (bool) convert alert_message for exchange specific.
hide_trade_line (bool) : (bool) if true, Hide trade line. Default false.
Returns: (void)
method print(this, message)
Print message using log table.
Namespace types: bot
Parameters:
this (bot)
message (string)
Returns: (void)
method start_trade(this)
start trade using start_time and end_time
Namespace types: bot
Parameters:
this (bot)
Returns: (void)
method entry(this, id, direction, qty, limit, stop, oca_name, oca_type, comment, alert_message, when)
It is a command to enter market position. If an order with the same ID is already pending, it is possible to modify the order. If there is no order with the specified ID, a new order is placed. To deactivate an entry order, the command strategy.cancel or strategy.cancel_all should be used. In comparison to the function strategy.order, the function strategy.entry is affected by pyramiding and it can reverse market position correctly. If both 'limit' and 'stop' parameters are 'NaN', the order type is market order.
Namespace types: bot
Parameters:
this (bot)
id (string) : (string) A required parameter. The order identifier. It is possible to cancel or modify an order by referencing its identifier.
direction (string) : (string) A required parameter. Market position direction: 'strategy.long' is for long, 'strategy.short' is for short.
qty (float) : (float) An optional parameter. Number of contracts/shares/lots/units to trade. The default value is 'NaN'.
limit (float) : (float) An optional parameter. Limit price of the order. If it is specified, the order type is either 'limit', or 'stop-limit'. 'NaN' should be specified for any other order type.
stop (float) : (float) An optional parameter. Stop price of the order. If it is specified, the order type is either 'stop', or 'stop-limit'. 'NaN' should be specified for any other order type.
oca_name (string) : (string) An optional parameter. Name of the OCA group the order belongs to. If the order should not belong to any particular OCA group, there should be an empty string.
oca_type (string) : (string) An optional parameter. Type of the OCA group. The allowed values are: "strategy.oca.none" - the order should not belong to any particular OCA group; "strategy.oca.cancel" - the order should belong to an OCA group, where as soon as an order is filled, all other orders of the same group are cancelled; "strategy.oca.reduce" - the order should belong to an OCA group, where if X number of contracts of an order is filled, number of contracts for each other order of the same OCA group is decreased by X.
comment (string) : (string) An optional parameter. Additional notes on the order.
alert_message (string) : (string) An optional parameter which replaces the {{strategy.order.alert_message}} placeholder when it is used in the "Create Alert" dialog box's "Message" field.
when (bool) : (bool) An optional parmeter. Condition, deprecated.
Returns: (void)
method order(this, id, direction, qty, limit, stop, oca_name, oca_type, comment, alert_message, when)
It is a command to place order. If an order with the same ID is already pending, it is possible to modify the order. If there is no order with the specified ID, a new order is placed. To deactivate order, the command strategy.cancel or strategy.cancel_all should be used. In comparison to the function strategy.entry, the function strategy.order is not affected by pyramiding. If both 'limit' and 'stop' parameters are 'NaN', the order type is market order.
Namespace types: bot
Parameters:
this (bot)
id (string) : (string) A required parameter. The order identifier. It is possible to cancel or modify an order by referencing its identifier.
direction (string) : (string) A required parameter. Market position direction: 'strategy.long' is for long, 'strategy.short' is for short.
qty (float) : (float) An optional parameter. Number of contracts/shares/lots/units to trade. The default value is 'NaN'.
limit (float) : (float) An optional parameter. Limit price of the order. If it is specified, the order type is either 'limit', or 'stop-limit'. 'NaN' should be specified for any other order type.
stop (float) : (float) An optional parameter. Stop price of the order. If it is specified, the order type is either 'stop', or 'stop-limit'. 'NaN' should be specified for any other order type.
oca_name (string) : (string) An optional parameter. Name of the OCA group the order belongs to. If the order should not belong to any particular OCA group, there should be an empty string.
oca_type (string) : (string) An optional parameter. Type of the OCA group. The allowed values are: "strategy.oca.none" - the order should not belong to any particular OCA group; "strategy.oca.cancel" - the order should belong to an OCA group, where as soon as an order is filled, all other orders of the same group are cancelled; "strategy.oca.reduce" - the order should belong to an OCA group, where if X number of contracts of an order is filled, number of contracts for each other order of the same OCA group is decreased by X.
comment (string) : (string) An optional parameter. Additional notes on the order.
alert_message (string) : (string) An optional parameter which replaces the {{strategy.order.alert_message}} placeholder when it is used in the "Create Alert" dialog box's "Message" field.
when (bool) : (bool) An optional parmeter. Condition, deprecated.
Returns: (void)
method close_all(this, comment, alert_message, immediately, when)
Exits the current market position, making it flat.
Namespace types: bot
Parameters:
this (bot)
comment (string) : (string) An optional parameter. Additional notes on the order.
alert_message (string) : (string) An optional parameter which replaces the {{strategy.order.alert_message}} placeholder when it is used in the "Create Alert" dialog box's "Message" field.
immediately (bool) : (bool) An optional parameter. If true, the closing order will be executed on the tick where it has been placed, ignoring the strategy parameters that restrict the order execution to the open of the next bar. The default is false.
when (bool) : (bool) An optional parmeter. Condition, deprecated.
Returns: (void)
method cancel(this, id, when)
It is a command to cancel/deactivate pending orders by referencing their names, which were generated by the functions: strategy.order, strategy.entry and strategy.exit.
Namespace types: bot
Parameters:
this (bot)
id (string) : (string) A required parameter. The order identifier. It is possible to cancel an order by referencing its identifier.
when (bool) : (bool) An optional parmeter. Condition, deprecated.
Returns: (void)
method cancel_all(this, when)
It is a command to cancel/deactivate all pending orders, which were generated by the functions: strategy.order, strategy.entry and strategy.exit.
Namespace types: bot
Parameters:
this (bot)
when (bool) : (bool) An optional parmeter. Condition, deprecated.
Returns: (void)
method close(this, id, comment, qty, qty_percent, alert_message, immediately, when)
It is a command to exit from the entry with the specified ID. If there were multiple entry orders with the same ID, all of them are exited at once. If there are no open entries with the specified ID by the moment the command is triggered, the command will not come into effect. The command uses market order. Every entry is closed by a separate market order.
Namespace types: bot
Parameters:
this (bot)
id (string) : (string) A required parameter. The order identifier. It is possible to close an order by referencing its identifier.
comment (string) : (string) An optional parameter. Additional notes on the order.
qty (float) : (float) An optional parameter. Number of contracts/shares/lots/units to exit a trade with. The default value is 'NaN'.
qty_percent (float) : (float) Defines the percentage (0-100) of the position to close. Its priority is lower than that of the 'qty' parameter. Optional. The default is 100.
alert_message (string) : (string) An optional parameter which replaces the {{strategy.order.alert_message}} placeholder when it is used in the "Create Alert" dialog box's "Message" field.
immediately (bool) : (bool) An optional parameter. If true, the closing order will be executed on the tick where it has been placed, ignoring the strategy parameters that restrict the order execution to the open of the next bar. The default is false.
when (bool) : (bool) An optional parmeter. Condition, deprecated.
Returns: (void)
ticks_to_price(ticks, from)
Converts ticks to a price offset from the supplied price or the average entry price.
Parameters:
ticks (float) : (float) Ticks to convert to a price.
from (float) : (float) A price that can be used to calculate from. Optional. The default value is `strategy.position_avg_price`.
Returns: (float) A price level that has a distance from the entry price equal to the specified number of ticks.
method exit(this, id, from_entry, qty, qty_percent, profit, limit, loss, stop, trail_price, trail_points, trail_offset, oca_name, comment, comment_profit, comment_loss, comment_trailing, alert_message, alert_profit, alert_loss, alert_trailing, when)
It is a command to exit either a specific entry, or whole market position. If an order with the same ID is already pending, it is possible to modify the order. If an entry order was not filled, but an exit order is generated, the exit order will wait till entry order is filled and then the exit order is placed. To deactivate an exit order, the command strategy.cancel or strategy.cancel_all should be used. If the function strategy.exit is called once, it exits a position only once. If you want to exit multiple times, the command strategy.exit should be called multiple times. If you use a stop loss and a trailing stop, their order type is 'stop', so only one of them is placed (the one that is supposed to be filled first). If all the following parameters 'profit', 'limit', 'loss', 'stop', 'trail_points', 'trail_offset' are 'NaN', the command will fail. To use market order to exit, the command strategy.close or strategy.close_all should be used.
Namespace types: bot
Parameters:
this (bot)
id (string) : (string) A required parameter. The order identifier. It is possible to cancel or modify an order by referencing its identifier.
from_entry (string) : (string) An optional parameter. The identifier of a specific entry order to exit from it. To exit all entries an empty string should be used. The default values is empty string.
qty (float) : (float) An optional parameter. Number of contracts/shares/lots/units to exit a trade with. The default value is 'NaN'.
qty_percent (float) : (float) Defines the percentage of (0-100) the position to close. Its priority is lower than that of the 'qty' parameter. Optional. The default is 100.
profit (float) : (float) An optional parameter. Profit target (specified in ticks). If it is specified, a limit order is placed to exit market position when the specified amount of profit (in ticks) is reached. The default value is 'NaN'.
limit (float) : (float) An optional parameter. Profit target (requires a specific price). If it is specified, a limit order is placed to exit market position at the specified price (or better). Priority of the parameter 'limit' is higher than priority of the parameter 'profit' ('limit' is used instead of 'profit', if its value is not 'NaN'). The default value is 'NaN'.
loss (float) : (float) An optional parameter. Stop loss (specified in ticks). If it is specified, a stop order is placed to exit market position when the specified amount of loss (in ticks) is reached. The default value is 'NaN'.
stop (float) : (float) An optional parameter. Stop loss (requires a specific price). If it is specified, a stop order is placed to exit market position at the specified price (or worse). Priority of the parameter 'stop' is higher than priority of the parameter 'loss' ('stop' is used instead of 'loss', if its value is not 'NaN'). The default value is 'NaN'.
trail_price (float) : (float) An optional parameter. Trailing stop activation level (requires a specific price). If it is specified, a trailing stop order will be placed when the specified price level is reached. The offset (in ticks) to determine initial price of the trailing stop order is specified in the 'trail_offset' parameter: X ticks lower than activation level to exit long position; X ticks higher than activation level to exit short position. The default value is 'NaN'.
trail_points (float) : (float) An optional parameter. Trailing stop activation level (profit specified in ticks). If it is specified, a trailing stop order will be placed when the calculated price level (specified amount of profit) is reached. The offset (in ticks) to determine initial price of the trailing stop order is specified in the 'trail_offset' parameter: X ticks lower than activation level to exit long position; X ticks higher than activation level to exit short position. The default value is 'NaN'.
trail_offset (float) : (float) An optional parameter. Trailing stop price (specified in ticks). The offset in ticks to determine initial price of the trailing stop order: X ticks lower than 'trail_price' or 'trail_points' to exit long position; X ticks higher than 'trail_price' or 'trail_points' to exit short position. The default value is 'NaN'.
oca_name (string) : (string) An optional parameter. Name of the OCA group (oca_type = strategy.oca.reduce) the profit target, the stop loss / the trailing stop orders belong to. If the name is not specified, it will be generated automatically.
comment (string) : (string) Additional notes on the order. If specified, displays near the order marker on the chart. Optional. The default is na.
comment_profit (string) : (string) Additional notes on the order if the exit was triggered by crossing `profit` or `limit` specifically. If specified, supercedes the `comment` parameter and displays near the order marker on the chart. Optional. The default is na.
comment_loss (string) : (string) Additional notes on the order if the exit was triggered by crossing `stop` or `loss` specifically. If specified, supercedes the `comment` parameter and displays near the order marker on the chart. Optional. The default is na.
comment_trailing (string) : (string) Additional notes on the order if the exit was triggered by crossing `trail_offset` specifically. If specified, supercedes the `comment` parameter and displays near the order marker on the chart. Optional. The default is na.
alert_message (string) : (string) Text that will replace the '{{strategy.order.alert_message}}' placeholder when one is used in the "Message" field of the "Create Alert" dialog. Optional. The default is na.
alert_profit (string) : (string) Text that will replace the '{{strategy.order.alert_message}}' placeholder when one is used in the "Message" field of the "Create Alert" dialog. Only replaces the text if the exit was triggered by crossing `profit` or `limit` specifically. Optional. The default is na.
alert_loss (string) : (string) Text that will replace the '{{strategy.order.alert_message}}' placeholder when one is used in the "Message" field of the "Create Alert" dialog. Only replaces the text if the exit was triggered by crossing `stop` or `loss` specifically. Optional. The default is na.
alert_trailing (string) : (string) Text that will replace the '{{strategy.order.alert_message}}' placeholder when one is used in the "Message" field of the "Create Alert" dialog. Only replaces the text if the exit was triggered by crossing `trail_offset` specifically. Optional. The default is na.
when (bool) : (bool) An optional parmeter. Condition, deprecated.
Returns: (void)
percent_to_ticks(percent, from)
Converts a percentage of the supplied price or the average entry price to ticks.
Parameters:
percent (float) : (float) The percentage of supplied price to convert to ticks. 50 is 50% of the entry price.
from (float) : (float) A price that can be used to calculate from. Optional. The default value is `strategy.position_avg_price`.
Returns: (float) A value in ticks.
percent_to_price(percent, from)
Converts a percentage of the supplied price or the average entry price to a price.
Parameters:
percent (float) : (float) The percentage of the supplied price to convert to price. 50 is 50% of the supplied price.
from (float) : (float) A price that can be used to calculate from. Optional. The default value is `strategy.position_avg_price`.
Returns: (float) A value in the symbol's quote currency (USD for BTCUSD).
bot
Fields:
password (series__string)
start_time (series__integer)
end_time (series__integer)
leverage (series__integer)
initial_capital (series__float)
default_qty_type (series__string)
default_qty_value (series__float)
margin_mode (series__string)
contract_size (series__float)
kis_number (series__integer)
entry_percent (series__float)
close_percent (series__float)
exit_percent (series__float)
log_table (series__table)
fixed_qty (series__float)
fixed_cash (series__float)
real (series__bool)
auto_alert_message (series__bool)
hide_trade_line (series__bool)
ProfitView Strategy TemplateHello traders,
This script took me a full week of coding/testing, sweat, and tears - and I’m too nice as I’m giving it for free to the community.
If you're tired of manual trading and looking for a solid strategy template to pair with your indicators, look no further.
This Pine Script v5 strategy template is engineered for maximum customization and risk management.
Best part?
This Pine Script v5 template facilitates the dynamic construction of ProfitView alerts, sparing users the time and effort of mastering the ProfitView syntax and manually creating alert commands.
This powerful tool gives much power to those who don't know how to code in Pinescript and want to automate their indicators' signals via the ProfitView Chrome extension.
IMPORTANT NOTES
ProfitView is a trading bot software that forwards TradingView alerts to your brokers (examples: Binance, Oanda, Coinbase, Bybit, etc.) for automating trading.
Many traders don't know how to dynamically create ProfitView-compatible alerts using the data from their TradingView scripts.
Traders using trading bots want their alerts to reflect the stop-loss/take-profit/trailing-stop/stop-loss to break options from your script and then create the orders accordingly.
This script showcases how to create ProfitView alerts dynamically.
TRADINGVIEW ALERTS
1) You'll have to create one alert per asset X timeframe = 1 chart.
Example: 1 alert for EUR/USD on the 5 minutes chart, 1 alert for EUR/USD on the 15-minute chart (assuming you want your bot to trade the EUR/USD on the 5 and 15-minute timeframes)
2) Select the Order fills and alert() function calls condition
3) For each alert, the alert message is pre-configured with the text below
{{strategy.order.alert_message}}
Please leave it as it is.
It's a TradingView native variable that will fetch the alert text messages built by the script.
4) ProfitView doesn't use webhook technology, so setting a webhook URL from the alerts notifications tab is unnecessary.
KEY FEATURES
I) Modular Indicator Connection
* plug your existing indicator into the template.
* Only two lines of code are needed for full compatibility.
Step 1: Create your connector
Adapt your indicator with only 2 lines of code and then connect it to this strategy template.
To do so:
1) Find in your indicator where the conditions print the long/buy and short/sell signals.
2) Create an additional plot as below
I'm giving an example with a Two moving averages cross.
Please replicate the same methodology for your indicator, whether a MACD , ZigZag, Pivots , higher-highs, lower-lows or whatever indicator with clear buy and sell conditions.
//@version=5
indicator("Supertrend", overlay = true, timeframe = "", timeframe_gaps = true)
atrPeriod = input.int(10, "ATR Length", minval = 1)
factor = input.float(3.0, "Factor", minval = 0.01, step = 0.01)
= ta.supertrend(factor, atrPeriod)
supertrend := barstate.isfirst ? na : supertrend
bodyMiddle = plot(barstate.isfirst ? na : (open + close) / 2, display = display.none)
upTrend = plot(direction < 0 ? supertrend : na, "Up Trend", color = color.green, style = plot.style_linebr)
downTrend = plot(direction < 0 ? na : supertrend, "Down Trend", color = color.red, style = plot.style_linebr)
fill(bodyMiddle, upTrend, color.new(color.green, 90), fillgaps = false)
fill(bodyMiddle, downTrend, color.new(color.red, 90), fillgaps = false)
buy = ta.crossunder(direction, 0)
sell = ta.crossunder(direction, 0)
//////// CONNECTOR SECTION ////////
Signal = buy ? 1 : sell ? -1 : 0
plot(Signal, title = "Signal", display = display.data_window)
//////// CONNECTOR SECTION ////////
Important Notes
🔥 The Strategy Template expects the value to be exactly 1 for the bullish signal and -1 for the bearish signal
Now, you can connect your indicator to the Strategy Template using the method below or that one.
Step 2: Connect the connector
1) Add your updated indicator to a TradingView chart
2) Add the Strategy Template as well to the SAME chart
3) Open the Strategy Template settings, and in the Data Source field, select your 🔌Connector🔌 (which comes from your indicator)
Note it doesn’t have to be named 🔌Connector🔌 - you can name it as you want - however, I recommend an explicit name you can easily remember.
From then, you should start seeing the signals and plenty of other stuff on your chart.
🔥 Note that whenever you update your indicator values, the strategy statistics and visuals on your chart will update in real-time
II) BOT Risk Management:
- Max Drawdown:
Mode: Select whether the max drawdown is calculated in percentage (%) or USD.
Value: If the max drawdown reaches this specified value, set a value to halt the bot.
- Max Consecutive Days:
Use Max Consecutive Days BOT Halt: Enable/Disable halting the bot if the max consecutive losing days value is reached.
- Max Consecutive Days: Set the maximum number of consecutive losing days allowed before halting the bot.
- Max Losing Streak:
Use Max Losing Streak: Enable/Disable a feature to prevent the bot from taking too many losses in a row.
- Max Losing Streak Length: Set the maximum length of a losing streak allowed.
Margin Call:
- Use Margin Call: Enable/Disable a feature to exit when a specified percentage away from a margin call to prevent it.
Margin Call (%): Set the percentage value to trigger this feature.
- Close BOT Total Loss:
Use Close BOT Total Loss: Enable/Disable a feature to close all trades and halt the bot if the total loss is reached.
- Total Loss ($): Set the total loss value in USD to trigger this feature.
Intraday BOT Risk Management:
- Intraday Losses:
Use Intraday Losses BOT Halt: Enable/Disable halting the bot on reaching specified intraday losses.
Mode: Select whether the intraday loss is calculated in percentage (%) or USD.
- Max Intraday Losses (%): Set the value for maximum intraday losses.
Limit Intraday Trades:
- Use Limit Intraday Trades: Enable/Disable a feature to limit the number of intraday trades.
- Max Intraday Trades: Set the maximum number of intraday trades allowed.
Restart Intraday EA:
- Use Restart Intraday EA: Enable/Disable a feature to restart the bot at the first bar of the next day if it has been stopped with an intraday risk management safeguard.
III) Order Types and Position Sizing
- Choose between market, limit, or stop orders.
- Set your position size directly in the template.
Please use the position size from the “Inputs” and not the “Properties” tab.
I know it's redundant. - the template needs this value from the "Inputs" tab to build the alerts, and the Backtester needs it from the "Properties" tab.
IV) Advanced Take-Profit and Stop-Loss Options
- Choose to set your SL/TP in either pips or percentages.
- Option for multiple take-profit levels and trailing stop losses.
- Move your stop loss to break even +/- offset in pips for “risk-free” trades.
V) Miscellaneous
Retry order openings if they fail.
Order Types:
Select and specify order type and price settings.
Position Size:
Define the type and size of positions.
Leverage:
Leverage settings, including margin type and hedge mode.
Session:
Limit trades to specific sessions.
Dates:
Limit trades to a specific date range.
Trades Direction:
Direction: Specify the market direction for opening positions.
VI) Notifications (Telegram/Discord/Email/IFTTT/Twilio/SMS)
Customize notifications sent to Telegram, Discord, Email, IFTTT, Twilio, and ProfitView Logger.
VII) Logger
The ProfitView commands are logged in the TradingView logger.
You'll find more information about it in this TradingView blog post .
WHY YOU MIGHT NEED THIS TEMPLATE
1) Transform your indicator into a ProfitView trading bot more easily than before
Connect your indicator to the template
Create your alerts
Set your EA settings
2) Save Time
Auto-generated alert messages for ProfitView.
I tested them all and checked with the support team what could/couldn’t be done.
3) Be in Control
Manage your trading risks with advanced features.
4) Customizable
Fits various trading styles and asset classes.
REQUIREMENTS
* Make sure you have your ProfitView account and do the settings correctly in your Chrome extension. If you don't know how to do it, read the documentation + ask for help in the ProfitView Discord support channel.
* If there is any issue with the template, ask me in the comments section - I’ll answer quickly.
BACKTEST RESULTS FROM THIS POST
1) I connected this strategy template to a dummy Supertrend script.
I could have selected any other indicator or concept for this script post.
I wanted to share an example of how you can quickly upgrade your strategy, making it compatible with ProfitView.
2) The backtest results aren't relevant for this educational script publication.
I used realistic backtesting data but didn't look too much into optimizing the results, as this isn't the point of why I'm publishing this script.
This strategy is a template to be connected to any indicator - the sky is the limit. :)
3) This template is made to take 1 trade per direction at any given time.
Pyramiding is set to 1 on TradingView.
The strategy default settings are:
* Initial Capital: 100000 USD
* Position Size: 1%
* Commission Percent: 0.075%
* Slippage: 1 tick
* No margin/leverage used
Best regards,
Dave
TradingView.To Strategy Template (with Dyanmic Alerts)Hello traders,
If you're tired of manual trading and looking for a solid strategy template to pair with your indicators, look no further.
This Pine Script v5 strategy template is engineered for maximum customization and risk management.
Best part?
This Pine Script v5 template facilitates the dynamic construction of TradingView.TO alerts, sparing users the time and effort of mastering the TradingView.TO syntax and manually create alert commands.
This powerful tool gives much power to those who don't know how to code in Pinescript and want to automate their indicators' signals via TradingView.TO bot.
IMPORTANT NOTES
TradingView.TO is a trading bot software that forwards TradingView alerts to your brokers (examples: Binance, Oanda, Coinbase, Bybit, Metatrader 4/5, ...) for automating trading.
Many traders don't know how to create TradingView.TO dynamically-compatible alerts using the data from their TradingView scripts.
Traders using trading bots want their alerts to reflect the stop-loss/take-profit/trailing-stop/stop-loss to break options from your script and then create the orders accordingly.
This script showcases how to create TradingView.TO alerts dynamically.
TRADINGVIEW ALERTS
1) You'll have to create one alert per asset X timeframe = 1 chart.
Example: 1 alert for BTC/USDT on the 5 minutes chart, 1 alert for BTC/USDT on the 15-minute chart (assuming you want your bot to trade the BTC/USDT on the 5 and 15-minute timeframes)
2) Select the Order fills and alert() function calls condition
3) For each alert, the alert message is pre-configured with the text below
{{strategy.order.alert_message}}
Please leave it as it is.
It's a TradingView native variable that will fetch the alert text messages built by the script.
4) TradingView.TO uses webhook technology - setting a webhook URL from the alerts notifications tab is required.
KEY FEATURES
I) Modular Indicator Connection
* plug your existing indicator into the template.
* Only two lines of code are needed for full compatibility.
Step 1: Create your connector
Adapt your indicator with only 2 lines of code and then connect it to this strategy template.
To do so:
1) Find in your indicator where the conditions print the long/buy and short/sell signals.
2) Create an additional plot as below
I'm giving an example with a Two moving averages cross.
Please replicate the same methodology for your indicator, whether a MACD , ZigZag, Pivots , higher-highs, lower-lows or whatever indicator with clear buy and sell conditions.
//@version=5
indicator("Supertrend", overlay = true, timeframe = "", timeframe_gaps = true)
atrPeriod = input.int(10, "ATR Length", minval = 1)
factor = input.float(3.0, "Factor", minval = 0.01, step = 0.01)
= ta.supertrend(factor, atrPeriod)
supertrend := barstate.isfirst ? na : supertrend
bodyMiddle = plot(barstate.isfirst ? na : (open + close) / 2, display = display.none)
upTrend = plot(direction < 0 ? supertrend : na, "Up Trend", color = color.green, style = plot.style_linebr)
downTrend = plot(direction < 0 ? na : supertrend, "Down Trend", color = color.red, style = plot.style_linebr)
fill(bodyMiddle, upTrend, color.new(color.green, 90), fillgaps = false)
fill(bodyMiddle, downTrend, color.new(color.red, 90), fillgaps = false)
buy = ta.crossunder(direction, 0)
sell = ta.crossunder(direction, 0)
//////// CONNECTOR SECTION ////////
Signal = buy ? 1 : sell ? -1 : 0
plot(Signal, title = "Signal", display = display.data_window)
//////// CONNECTOR SECTION ////////
Important Notes
🔥 The Strategy Template expects the value to be exactly 1 for the bullish signal and -1 for the bearish signal
Now, you can connect your indicator to the Strategy Template using the method below or that one.
Step 2: Connect the connector
1) Add your updated indicator to a TradingView chart
2) Add the Strategy Template as well to the SAME chart
3) Open the Strategy Template settings, and in the Data Source field, select your 🔌Connector🔌 (which comes from your indicator)
Note it doesn’t have to be named 🔌Connector🔌 - you can name it as you want - however, I recommend an explicit name you can easily remember.
From then, you should start seeing the signals and plenty of other stuff on your chart.
🔥 Note that whenever you update your indicator values, the strategy statistics and visuals on your chart will update in real-time
II) BOT Risk Management:
- Max Drawdown:
Mode: Select whether the max drawdown is calculated in percentage (%) or USD.
Value: If the max drawdown reaches this specified value, set a value to halt the bot.
- Max Consecutive Days:
Use Max Consecutive Days BOT Halt: Enable/Disable halting the bot if the max consecutive losing days value is reached.
- Max Consecutive Days: Set the maximum number of consecutive losing days allowed before halting the bot.
- Max Losing Streak:
Use Max Losing Streak: Enable/Disable a feature to prevent the bot from taking too many losses in a row.
- Max Losing Streak Length: Set the maximum length of a losing streak allowed.
Margin Call:
- Use Margin Call: Enable/Disable a feature to exit when a specified percentage away from a margin call to prevent it.
Margin Call (%): Set the percentage value to trigger this feature.
- Close BOT Total Loss:
Use Close BOT Total Loss: Enable/Disable a feature to close all trades and halt the bot if the total loss is reached.
- Total Loss ($): Set the total loss value in USD to trigger this feature.
Intraday BOT Risk Management:
- Intraday Losses:
Use Intraday Losses BOT Halt: Enable/Disable halting the bot on reaching specified intraday losses.
Mode: Select whether the intraday loss is calculated in percentage (%) or USD.
- Max Intraday Losses (%): Set the value for maximum intraday losses.
Limit Intraday Trades:
- Use Limit Intraday Trades: Enable/Disable a feature to limit the number of intraday trades.
- Max Intraday Trades: Set the maximum number of intraday trades allowed.
Restart Intraday EA:
III) Order Types and Position Sizing
- Choose between market or limit orders.
- Set your position size directly in the template.
Please use the position size from the “Inputs” and not the “Properties” tab.
I know it's redundant. - the template needs this value from the "Inputs" tab to build the alerts, and the Backtester needs it from the "Properties" tab.
IV) Advanced Take-Profit and Stop-Loss Options
- Choose to set your SL/TP in either USD or percentages.
- Option for multiple take-profit levels and trailing stop losses.
- Move your stop loss to break even +/- offset in USD for “risk-free” trades.
V) Miscellaneous:
Retry order openings if they fail.
Order Types:
Select and specify order type and price settings.
Position Size:
Define the type and size of positions.
Leverage:
Leverage settings, including margin type and hedge mode.
Session:
Limit trades to specific sessions.
Dates:
Limit trades to a specific date range.
Trades Direction:
Direction: Specify the market direction for opening positions.
VI) Logger
The TradingView.TO commands are logged in the TradingView logger.
You'll find more information about it in this TradingView blog post .
WHY YOU MIGHT NEED THIS TEMPLATE
1) Transform your indicator into a TradingView.TO trading bot more easily than before
Connect your indicator to the template
Create your alerts
Set your EA settings
2) Save Time
Auto-generated alert messages for TradingView.TO.
I tested them all and checked with the support team what could/couldn’t be done.
3) Be in Control
Manage your trading risks with advanced features.
4) Customizable
Fits various trading styles and asset classes.
REQUIREMENTS
* Make sure you have your TradingView.TO account
* If there is any issue with the template, ask me in the comments section - I’ll answer quickly.
BACKTEST RESULTS FROM THIS POST
1) I connected this strategy template to a dummy Supertrend script.
I could have selected any other indicator or concept for this script post.
I wanted to share an example of how you can quickly upgrade your strategy, making it compatible with TradingView.TO.
2) The backtest results aren't relevant for this educational script publication.
I used realistic backtesting data but didn't look too much into optimizing the results, as this isn't the point of why I'm publishing this script.
This strategy is a template to be connected to any indicator - the sky is the limit. :)
3) This template is made to take 1 trade per direction at any given time.
Pyramiding is set to 1 on TradingView.
The strategy default settings are:
* Initial Capital: 100000 USD
* Position Size: 1%
* Commission Percent: 0.075%
* Slippage: 1 tick
* No margin/leverage used
Ranged Volume DCA Strategy - R3c0nTraderUpdate: Republishing this as Public Open-Source script.
Credits:
Thank you "EvoCrypto" for granting me permission to use "Ranged Volume" to create this strategy.
Thank you "junyou0424" for granting me permission to use "DCA Bot with SuperTrend Emulator" which I used for adding bot inputs, calculations, and strategy
What does this do?
This script is mainly used for backtesting a Ranged Volume strategy to see how a 3Commas bot would perform.
I created this script out of necessity and I wanted a way to test a 3Commas DCA bot with a strategy based on “Volume.”
I came across "EvoCrypto’s" "Ranged Volume" study and strategy in TradingView and I liked it. I wanted to configure it so it can be used for DCA bot backtesting. I used parts from "junyou0424’s" "DCA Bot with SuperTrend Emulator" to add the following:
1. The Start Time and End Time
2. Price deviation to open safety orders (%)
3. Target Take Profit (%)
4. Trailing deviation
5. Base Order and Safety Order
6. Safety order volume scale
7. Safety order step scale
8. Max safety orders
In addition to the above, I also added chart indicators for "Take Profit" as well as "Safety Order"
Pre-requisites:
You can use this script without a 3Commas account and see how 3Commas DCA Bot and Ranged Volume strategy would perform vs. a non-DCA strategy. However, I highly recommend signing up for their free account and going through their training. This would give you a base understanding on the settings you will see in this strategy and why you will need to know them.
That said these are the pre-requisites I suggest you have:
1. Base Knowledge of 3Commas DCA bots
2. Base knowledge of settings such as “Max safety trades count”, “safety order volume scale” and “safety order step scale”. If these are alien to you, I suggest you read up on these.
3. Knowledge of setting up a Single-pair 3Commas bot for receiving custom TradingView signal.
4. A paper-bot to test your ideas. (Do not use a real money bot until you have tested it sufficiently with a paper-bot. You alone are responsible for your results!)
5. Add the study I created called "R3c0nTrader’s Ranged Volume Study” which adds a separate chart in its own pane showing the volume spikes. It will also generate the “buy” signals for your bot. NOTE: The study also has the same color scheme as this strategy and having the colors in both the strategy and the study will make things easier to see. If you use EvoCrypto’s Ranged Volume Study instead, just keep in mind that the colors won’t match, and you will have to manually match them.
6. Make your buy signals from your strategy are the same as in your study! To do this, use the same “Volume Range Length” you entered in the STRATEGY and enter that value for the “Volume Range Length” in the STUDY. Also ensure you have the same settings for “Heikin Ashi” (On or Off).
Comparisons of Ranged Volume Strategy vs Ranged Volume DCA Strategy
BTCUSD
Beware of Strategies that claim super high profits. This can easily be done by lowering the initial capital to something unrealistic. If I did that with this strategy and set the initial capital $100 and base order size to $100, I get a net profit of 2,864% which is not realistic.
How to Use
1. On the “Inputs” tab:
a. Set your Start and End Time to backtest against.
b. Set your “Volume Range Length” (number of bars to look back)
c. “Heikin Ashi Colors” – Usually I leave this enabled
d. “Show Bar Colors” – Leave enabled
e. “Show Break-Out” – Leave enabled
f. “Show Range” – Leave enabled
g. Set your other inputs which are those settings you would find in your 3Commas bot that you want to test (e.g., Price deviation to open safety orders, Target Take Profit, Base order, Safety order, etc.).
h. Quick Example for BTCUSD on 2hr chart:
i. Price deviation to open safety orders (%) = 6
ii. Target Take Profit (%) = 14
iii. Trailing deviation = 0
iv. Base order = 100
v. Safety order = 200
vi. Safety order volume scale = 2
vii. Safety order step scale = 1.4
viii. Max safety order = 5
2. On the “Properties” tab, set your initial capital, base currency, etc.
a. Initial capital – Default is 10,000 (Please use realistic values here. The amount here should be able to cover ALL your safety orders if they were triggered. Ideally, you should have funds left over and not use all trade capital.)
b. Base currency – Select your currency
c. Order Size - Not used. Use the “Inputs” tab to change your base order size.
d. Leave “Pyramiding” set to 999. This acts as a ceiling to the “Max safety orders” on the “Inputs” tab. It must always be higher than your “Max safety orders.” For example, if you set your “Max safety orders” to “4” and “Pyramiding” to “4” then it effectively means you have “3” “Max safety orders” and not “4” because it is counting each successive entry including the initial order.
e. “Commission” - Optional
f. “Verify price for limit orders” – Leave at zero. This does not change anything that I can tell.
g. Optional - Enter a value for “Commission”
h. Slippage – Optional. Slippage does not occur in backtesting but does occur in real trading but it can be simulated. Example use case for tracking performance of a real money bot: You enter the start date and time of your bot’s trade into this strategy and you notice some values are a little off due to slippage (average price, take profit, safety orders are not lining up) then you would go back here and increase the slippage until those lines up close enough with your actuals.
i. Margin for long positions – I don’t use this honestly.
j. Margin for short positions – I don’t use this honestly.
k. Recalculate “After order is filled” and “On every tick” – I don’t use this honestly.
3. “Style” tab
a. Ranged Volume Bar Coloring - You must disable bar coloring in any studies you added or this may not work properly
i. Color 0 – Default Yellow; appears when a volume breakout occurs
ii. Color 1 – Default Red; appears when a volume breakdown occurs
iii. Color 2 – Light Blue; appears when Close is higher than the Open
iv. Color 3 – Dark Blue; appears when the Close is lower than the Open
b. Take profit – Default Green; take profit line
c. Safety order – Default Light Blue; safety order line
d. No Safety Orders left – Default Red; when a trade runs out of safety orders, the line turns red and there is no safety orders left underneath to catch any further falling price movements.
e. Avg Position Price – Default Orange; your average position price for any given trade.
f. Take Profit Plot Area – Default Green; creates a highlighted area for your take profit
g. SO Plot Area – Default Light Blue; creates a highlighted area for your safety orders
h. Trades on chart – Show or hide your trades on the chart
i. Signal labels – Show or hide the trade signal labels on the chart
j. Quantity – Show or hide the trade quantity on the chart
Explanation of Chart lines and colors on chart
Cipher Twister - Long and ShortINTRO / NOTES:
This script is based on Market Cipher B Oscillator by Falcon
The difference in this script is that only the useful points are printed on the indicator, namely Long and Short Trade Execution signals to be used by a bot, namely the PT Bot.
The script also differs from the original that it has been upgraded to Pinescript v4
This oscillator can be used with ALL time frames, but generally works the best on 15 minute and 1 hour charts on ANY market, no matter, stock, forex, crypto, spot, futures, derivatives, Nasdaq etc...
DEFINITIONS:
This oscillator forms the foundation of Buy and Exit of Long and Short Trades.
There are 2 'Red' Lines at the top of the channel and 2 Green Lines at the bottom of the channel.
These two channels are set at default to be +53 / -53 and +60 / -60 respectively. These two lines will serve as the threshold point if one is to make cautious trades only.
There is a center line which divides the Oscillator into two parts. Above the center line, the market is in over bought territory and Below the center line is in over sold territory.
'Red' dots are drawn by the indicator to represent a potential Short (or a signal to exit from a Long position)
'Green' dots are drawn by the indicator to represent a potential Long (or a signal to exit from a Short position)
The 'Red' and 'Green' dots are draw when a Cross between both wt1 & wt2 cross, thus providing a fantastic indication of potential trend reversal and entry/exit of a position.
STRATEGY NOTES:
The strategy to use this indicator with for realistic and proper results would be to use it with an automated Trading Bot such as Profit Trailer (PT-BOT)
You could use this strategy manually, however it would mean you would need to sit in front of the screen all day and night long and activate the trades immediately after the 'red'/'green' dots are drawn. Usually this will result in non-optimal entries and exits as well as loss on various instances when a 'red' and 'green' dot are printed close together (which is usually when the market goes into correction/consolidation) and slow entries/exits will result in a loss rather than a small profit or exit at BE (Break Even)
ACTUAL STRATEGY (For use with automated bot)
To be used in conjunction with Heikin Ashi Candles for added cautionary measures
For LONGs ONLY
--------------------
1/ When 'Green' dot is drawn, ACTIVATE Long Position
(Use 1.5% Risk Management for each trade)
(Use Lot size based on 1.5% risk management and xLeverage (if any))
2/ Make sure bot Opens an SL (Stop Loss) value based on 1.5% Risk Management
3/ When 'Red' dot is drawn, CLOSE Long Position.
*If you want to add extra caution to your trade, only activate the trade if the 'Green' dot is BELOW the 'Green' Markers
*For added caution, use color coded Heikin Ashi candles to 'confirm' Activation and Closing of a trade in the bot configuration
---------------------------------------------------------------------------------------------------
For SHORTs ONLY
--------------------
1/ When 'Red' dot is drawn, ACTIVATE Short Position
(Use 1.5% Risk Management for each trade)
(Use Lot size based on 1.5% risk management and xLeverage (if any))
2/ Make sure bot Opens an SL (Stop Loss) value based on 1.5% Risk Management
3/ When 'Green' dot is drawn, CLOSE Short Position
*If you want to add extra caution to your trade, only activate the trade if the 'Red' dot is Above the Red Markers
*For added caution, use color coded Heikin Ashi candles to 'confirm' Activation and Closing of a trade in the bot configuration
---------------------------------------------------------------------------------------------------
Supplementary Notes:
Make sure that your bot configuration will only activate ONE TRADE when the 'Green'/'Red' dot appears.
Occasionally during high volatility , 'red'/'green' dots will appear intermittently before remaining drawn, thus the oscillator 'redraws' the dots during market movement.
There will be times where occasionally a 'green' dot or a 'red' dot will appear, the trade will be opened, but the trade will fail due to the market manipulation (algorithm/market maker bots/fake volume etc), to wipe out those trading on derivatives and futures markets using leverage. Do not worry about this, no bot can make 100% wins, no strategy will achieve 100% win ratio and one necessarily doesn't need a high win ratio when using strict money management practices with your trading for SL and lot size.
If you use this method, you will see great results, but again I must stress, using this method with a fully automated bot is the only way to achieve proper results.
Volatility Calculator for Daily Top and Bottom RangeWith the usage of ATR, applied on the close of the daily candle, I am calculated the volatility channels for the TOP and BOTTOM
Based on this logic, we can estimate, with a huge confidence factor, where the prices are going to be compressed for the trading day.
Having said that, lets take a look at the data gathered among the most important financial markets:
SPX
TOP CROSSES : 2116
BOT CROSSES : 1954
Total Daily Candles : 18908
Occurance ratio = 0.215
NDX
TOP CROSSES : 1212
BOT CROSSES : 1183
Total Daily Candles : 9386
Occurance ratio = 0.255
DIA
TOP CROSSES : 759
BOT CROSSES : 769
Total Daily Candles : 6109
Occurance ratio = 0.25
DXY
TOP CROSSES : 1597
BOT CROSSES : 1598
Total Daily Candles : 13156
Occurance ratio = 0.243
DAX
TOP CROSSES : 1878
BOT CROSSES : 1848
Total Daily Candles : 13155
Occurance ratio = 0.283
BTC USD
TOP CROSSES : 416
BOT CROSSES : 417
Total Daily Candles : 4290
Occurance ratio = 0.194
ETH USD
TOP CROSSES : 247
BOT CROSSES : 268
Total Daily Candles : 2452
Occurance ratio = 0.21
EUR USD
TOP CROSSES : 820
BOT CROSSES : 805
Total Daily Candles : 7489
Occurance ratio = 0.217
GOLD
TOP CROSSES : 1722
BOT CROSSES : 1569
Total Daily Candles : 13747
Occurance ratio = 0.239
USOIL
TOP CROSSES : 1077
BOT CROSSES : 1089
Total Daily Candles : 10231
Occurance ratio = 0.212
US 10Y
TOP CROSSES : 1302
BOT CROSSES : 1365
Total Daily Candles : 9075
Occurance ratio = 0.294
Based on this, we can assume with a very high confidence ( 70-80%) that the market is going to stay, within the range created from the BOT and TOP ATR points.
Bober XM v2.0# ₿ober XM v2.0 Trading Bot Documentation
**Developer's Note**: While our previous Bot 1.3.1 was removed due to guideline violations, this setback only fueled our determination to create something even better. Rising from this challenge, Bober XM 2.0 emerges not just as an update, but as a complete reimagining with multi-timeframe analysis, enhanced filters, and superior adaptability. This adversity pushed us to innovate further and deliver a strategy that's smarter, more agile, and more powerful than ever before. Challenges create opportunity - welcome to Cryptobeat's finest work yet.
## !!!!You need to tune it for your own pair and timeframe and retune it periodicaly!!!!!
## Overview
The ₿ober XM v2.0 is an advanced dual-channel trading bot with multi-timeframe analysis capabilities. It integrates multiple technical indicators, customizable risk management, and advanced order execution via webhook for automated trading. The bot's distinctive feature is its separate channel systems for long and short positions, allowing for asymmetric trade strategies that adapt to different market conditions across multiple timeframes.
### Key Features
- **Multi-Timeframe Analysis**: Analyze price data across multiple timeframes simultaneously
- **Dual Channel System**: Separate parameter sets for long and short positions
- **Advanced Entry Filters**: RSI, Volatility, Volume, Bollinger Bands, and KEMAD filters
- **Machine Learning Moving Average**: Adaptive prediction-based channels
- **Multiple Entry Strategies**: Breakout, Pullback, and Mean Reversion modes
- **Risk Management**: Customizable stop-loss, take-profit, and trailing stop settings
- **Webhook Integration**: Compatible with external trading bots and platforms
### Strategy Components
| Component | Description |
|---------|-------------|
| **Dual Channel Trading** | Uses either Keltner Channels or Machine Learning Moving Average (MLMA) with separate settings for long and short positions |
| **MLMA Implementation** | Machine learning algorithm that predicts future price movements and creates adaptive bands |
| **Pivot Point SuperTrend** | Trend identification and confirmation system based on pivot points |
| **Three Entry Strategies** | Choose between Breakout, Pullback, or Mean Reversion approaches |
| **Advanced Filter System** | Multiple customizable filters with multi-timeframe support to avoid false signals |
| **Custom Exit Logic** | Exits based on OBV crossover of its moving average combined with pivot trend changes |
### Note for Novice Users
This is a fully featured real trading bot and can be tweaked for any ticker — SOL is just an example. It follows this structure:
1. **Indicator** – gives the initial signal
2. **Entry strategy** – decides when to open a trade
3. **Exit strategy** – defines when to close it
4. **Trend confirmation** – ensures the trade follows the market direction
5. **Filters** – cuts out noise and avoids weak setups
6. **Risk management** – controls losses and protects your capital
To tune it for a different pair, you'll need to start from scratch:
1. Select the timeframe (candle size)
2. Turn off all filters and trend entry/exit confirmations
3. Choose a channel type, channel source and entry strategy
4. Adjust risk parameters
5. Tune long and short settings for the channel
6. Fine-tune the Pivot Point Supertrend and Main Exit condition OBV
This will generate a lot of signals and activity on the chart. Your next task is to find the right combination of filters and settings to reduce noise and tune it for profitability.
### Default Strategy values
Default values are tuned for: Symbol BITGET:SOLUSDT.P 5min candle
Filters are off by default: Try to play with it to understand how it works
## Configuration Guide
### General Settings
| Setting | Description | Default Value |
|---------|-------------|---------------|
| **Long Positions** | Enable or disable long trades | Enabled |
| **Short Positions** | Enable or disable short trades | Enabled |
| **Risk/Reward Area** | Visual display of stop-loss and take-profit zones | Enabled |
| **Long Entry Source** | Price data used for long entry signals | hl2 (High+Low/2) |
| **Short Entry Source** | Price data used for short entry signals | hl2 (High+Low/2) |
The bot allows you to trade long positions, short positions, or both simultaneously. Each direction has its own set of parameters, allowing for fine-tuned strategies that recognize the asymmetric nature of market movements.
### Multi-Timeframe Settings
1. **Enable Multi-Timeframe Analysis**: Toggle 'Enable Multi-Timeframe Analysis' in the Multi-Timeframe Settings section
2. **Configure Timeframes**: Set appropriate higher timeframes based on your trading style:
- Timeframe 1: Default is now 15 minutes (intraday confirmation)
- Timeframe 2: Default is 4 hours (trend direction)
3. **Select Sources per Indicator**: For each indicator (RSI, KEMAD, Volume, etc.), choose:
- The desired timeframe (current, mtf1, or mtf2)
- The appropriate price type (open, high, low, close, hl2, hlc3, ohlc4)
### Entry Strategies
- **Breakout**: Enter when price breaks above/below the channel
- **Pullback**: Enter when price pulls back to the channel
- **Mean Reversion**: Enter when price is extended from the channel
You can enable different strategies for long and short positions.
### Core Components
### Risk Management
- **Position Size**: Control risk with percentage-based position sizing
- **Stop Loss Options**:
- Fixed: Set a specific price or percentage from entry
- ATR-based: Dynamic stop-loss based on market volatility
- Swing: Uses recent swing high/low points
- **Take Profit**: Multiple targets with percentage allocation
- **Trailing Stop**: Dynamic stop that follows price movement
## Advanced Usage Strategies
### Moving Average Type Selection Guide
- **SMA**: More stable in choppy markets, good for higher timeframes
- **EMA/WMA**: More responsive to recent price changes, better for entry signals
- **VWMA**: Adds volume weighting for stronger trends, use with Volume filter
- **HMA**: Balance between responsiveness and noise reduction, good for volatile markets
### Multi-Timeframe Strategy Approaches
- **Trend Confirmation**: Use higher timeframe RSI (mtf2) for overall trend, current timeframe for entries
- **Entry Precision**: Use KEMAD on current timeframe with volume filter on mtf1
- **False Signal Reduction**: Apply RSI filter on mtf1 with strict KEMAD settings
### Market Condition Optimization
| Market Condition | Recommended Settings |
|------------------|----------------------|
| **Trending** | Use Breakout strategy with KEMAD filter on higher timeframe |
| **Ranging** | Use Mean Reversion with strict RSI filter (mtf1) |
| **Volatile** | Increase ATR multipliers, use HMA for moving averages |
| **Low Volatility** | Decrease noise parameters, use pullback strategy |
## Webhook Integration
The strategy features a professional webhook system that allows direct connectivity to your exchange or trading platform of choice through third-party services like 3commas, Alertatron, or Autoview.
The webhook payload includes all necessary parameters for automated execution:
- Entry price and direction
- Stop loss and take profit levels
- Position size
- Custom identifier for webhook routing
## Performance Optimization Tips
1. **Start with Defaults**: Begin with the default settings for your timeframe before customizing
2. **Adjust One Component at a Time**: Make incremental changes and test the impact
3. **Match MA Types to Market Conditions**: Use appropriate moving average types based on the Market Condition Optimization table
4. **Timeframe Synergy**: Create logical relationships between timeframes (e.g., 5min chart with 15min and 4h higher timeframes)
5. **Periodic Retuning**: Markets evolve - regularly review and adjust parameters
## Common Setups
### Crypto Trend-Following
- MLMA with EMA or HMA
- Higher RSI thresholds (75/25)
- KEMAD filter on mtf1
- Breakout entry strategy
### Stock Swing Trading
- MLMA with SMA for stability
- Volume filter with higher threshold
- KEMAD with increased filter order
- Pullback entry strategy
### Forex Scalping
- MLMA with WMA and lower noise parameter
- RSI filter on current timeframe
- Use highest timeframe for trend direction only
- Mean Reversion strategy
## Webhook Configuration
- **Benefits**:
- Automated trade execution without manual intervention
- Immediate response to market conditions
- Consistent execution of your strategy
- **Implementation Notes**:
- Requires proper webhook configuration on your exchange or platform
- Test thoroughly with small position sizes before full deployment
- Consider latency between signal generation and execution
### Backtesting Period
Define a specific historical period to evaluate the bot's performance:
| Setting | Description | Default Value |
|---------|-------------|---------------|
| **Start Date** | Beginning of backtest period | January 1, 2025 |
| **End Date** | End of backtest period | December 31, 2026 |
- **Best Practice**: Test across different market conditions (bull markets, bear markets, sideways markets)
- **Limitation**: Past performance doesn't guarantee future results
## Entry and Exit Strategies
### Dual-Channel System
A key innovation of the Bober XM is its dual-channel approach:
- **Independent Parameters**: Each trade direction has its own channel settings
- **Asymmetric Trading**: Recognizes that markets often behave differently in uptrends versus downtrends
- **Optimized Performance**: Fine-tune settings for both bullish and bearish conditions
This approach allows the bot to adapt to the natural asymmetry of markets, where uptrends often develop gradually while downtrends can be sharp and sudden.
### Channel Types
#### 1. Keltner Channels
Traditional volatility-based channels using EMA and ATR:
| Setting | Long Default | Short Default |
|---------|--------------|---------------|
| **EMA Length** | 37 | 20 |
| **ATR Length** | 13 | 17 |
| **Multiplier** | 1.4 | 1.9 |
| **Source** | low | high |
- **Strengths**:
- Reliable in trending markets
- Less prone to whipsaws than Bollinger Bands
- Clear visual representation of volatility
- **Weaknesses**:
- Can lag during rapid market changes
- Less effective in choppy, non-trending markets
#### 2. Machine Learning Moving Average (MLMA)
Advanced predictive model using kernel regression (RBF kernel):
| Setting | Description | Options |
|---------|-------------|--------|
| **Source MA** | Price data used for MA calculations | Any price source (low/high/close/etc.) |
| **Moving Average Type** | Type of MA algorithm for calculations | SMA, EMA, WMA, VWMA, RMA, HMA |
| **Trend Source** | Price data used for trend determination | Any price source (close default) |
| **Window Size** | Historical window for MLMA calculations | 5+ (default: 16) |
| **Forecast Length** | Number of bars to forecast ahead | 1+ (default: 3) |
| **Noise Parameter** | Controls smoothness of prediction | 0.01+ (default: ~0.43) |
| **Band Multiplier** | Multiplier for channel width | 0.1+ (default: 0.5-0.6) |
- **Strengths**:
- Predictive rather than reactive
- Adapts quickly to changing market conditions
- Better at identifying trend reversals early
- **Weaknesses**:
- More computationally intensive
- Requires careful parameter tuning
- Can be sensitive to input data quality
### Entry Strategies
| Strategy | Description | Ideal Market Conditions |
|----------|-------------|-------------------------|
| **Breakout** | Enters when price breaks through channel bands, indicating strong momentum | High volatility, emerging trends |
| **Pullback** | Enters when price retraces to the middle band after testing extremes | Established trends with regular pullbacks |
| **Mean Reversion** | Enters at channel extremes, betting on a return to the mean | Range-bound or oscillating markets |
#### Breakout Strategy (Default)
- **Implementation**: Enters long when price crosses above the upper band, short when price crosses below the lower band
- **Strengths**: Captures strong momentum moves, performs well in trending markets
- **Weaknesses**: Can lead to late entries, higher risk of false breakouts
- **Optimization Tips**:
- Increase channel multiplier for fewer but more reliable signals
- Combine with volume confirmation for better accuracy
#### Pullback Strategy
- **Implementation**: Enters long when price pulls back to middle band during uptrend, short during downtrend pullbacks
- **Strengths**: Better entry prices, lower risk, higher probability setups
- **Weaknesses**: Misses some strong moves, requires clear trend identification
- **Optimization Tips**:
- Use with trend filters to confirm overall direction
- Adjust middle band calculation for market volatility
#### Mean Reversion Strategy
- **Implementation**: Enters long at lower band, short at upper band, expecting price to revert to the mean
- **Strengths**: Excellent entry prices, works well in ranging markets
- **Weaknesses**: Dangerous in strong trends, can lead to fighting the trend
- **Optimization Tips**:
- Implement strong trend filters to avoid counter-trend trades
- Use smaller position sizes due to higher risk nature
### Confirmation Indicators
#### Pivot Point SuperTrend
Combines pivot points with ATR-based SuperTrend for trend confirmation:
| Setting | Default Value |
|---------|---------------|
| **Pivot Period** | 25 |
| **ATR Factor** | 2.2 |
| **ATR Period** | 41 |
- **Function**: Identifies significant market turning points and confirms trend direction
- **Implementation**: Requires price to respect the SuperTrend line for trade confirmation
#### Weighted Moving Average (WMA)
Provides additional confirmation layer for entries:
| Setting | Default Value |
|---------|---------------|
| **Period** | 15 |
| **Source** | ohlc4 (average of Open, High, Low, Close) |
- **Function**: Confirms trend direction and filters out low-quality signals
- **Implementation**: Price must be above WMA for longs, below for shorts
### Exit Strategies
#### On-Balance Volume (OBV) Based Exits
Uses volume flow to identify potential reversals:
| Setting | Default Value |
|---------|---------------|
| **Source** | ohlc4 |
| **MA Type** | HMA (Options: SMA, EMA, WMA, RMA, VWMA, HMA) |
| **Period** | 22 |
- **Function**: Identifies divergences between price and volume to exit before reversals
- **Implementation**: Exits when OBV crosses its moving average in the opposite direction
- **Customizable MA Type**: Different MA types provide varying sensitivity to OBV changes:
- **SMA**: Traditional simple average, equal weight to all periods
- **EMA**: More weight to recent data, responds faster to price changes
- **WMA**: Weighted by recency, smoother than EMA
- **RMA**: Similar to EMA but smoother, reduces noise
- **VWMA**: Factors in volume, helpful for OBV confirmation
- **HMA**: Reduces lag while maintaining smoothness (default)
#### ADX Exit Confirmation
Uses Average Directional Index to confirm trend exhaustion:
| Setting | Default Value |
|---------|---------------|
| **ADX Threshold** | 35 |
| **ADX Smoothing** | 60 |
| **DI Length** | 60 |
- **Function**: Confirms trend weakness before exiting positions
- **Implementation**: Requires ADX to drop below threshold or DI lines to cross
## Filter System
### RSI Filter
- **Function**: Controls entries based on momentum conditions
- **Parameters**:
- Period: 15 (default)
- Overbought level: 71
- Oversold level: 23
- Multi-timeframe support: Current, MTF1 (15min), or MTF2 (4h)
- Customizable price source (open, high, low, close, hl2, hlc3, ohlc4)
- **Implementation**: Blocks long entries when RSI > overbought, short entries when RSI < oversold
### Volatility Filter
- **Function**: Prevents trading during excessive market volatility
- **Parameters**:
- Measure: ATR (Average True Range)
- Period: Customizable (default varies by timeframe)
- Threshold: Adjustable multiplier
- Multi-timeframe support
- Customizable price source
- **Implementation**: Blocks trades when current volatility exceeds threshold × average volatility
### Volume Filter
- **Function**: Ensures adequate market liquidity for trades
- **Parameters**:
- Threshold: 0.4× average (default)
- Measurement period: 5 (default)
- Moving average type: Customizable (HMA default)
- Multi-timeframe support
- Customizable price source
- **Implementation**: Requires current volume to exceed threshold × average volume
### Bollinger Bands Filter
- **Function**: Controls entries based on price relative to statistical boundaries
- **Parameters**:
- Period: Customizable
- Standard deviation multiplier: Adjustable
- Moving average type: Customizable
- Multi-timeframe support
- Customizable price source
- **Implementation**: Can require price to be within bands or breaking out of bands depending on strategy
### KEMAD Filter (Kalman EMA Distance)
- **Function**: Advanced trend confirmation using Kalman filter algorithm
- **Parameters**:
- Process Noise: 0.35 (controls smoothness)
- Measurement Noise: 24 (controls reactivity)
- Filter Order: 6 (higher = more smoothing)
- ATR Length: 8 (for bandwidth calculation)
- Upper Multiplier: 2.0 (for long signals)
- Lower Multiplier: 2.7 (for short signals)
- Multi-timeframe support
- Customizable visual indicators
- **Implementation**: Generates signals based on price position relative to Kalman-filtered EMA bands
## Risk Management System
### Position Sizing
Automatically calculates position size based on account equity and risk parameters:
| Setting | Default Value |
|---------|---------------|
| **Risk % of Equity** | 50% |
- **Implementation**:
- Position size = (Account equity × Risk %) ÷ (Entry price × Stop loss distance)
- Adjusts automatically based on volatility and stop placement
- **Best Practices**:
- Start with lower risk percentages (1-2%) until strategy is proven
- Consider reducing risk during high volatility periods
### Stop-Loss Methods
Multiple stop-loss calculation methods with separate configurations for long and short positions:
| Method | Description | Configuration |
|--------|-------------|---------------|
| **ATR-Based** | Dynamic stops based on volatility | ATR Period: 14, Multiplier: 2.0 |
| **Percentage** | Fixed percentage from entry | Long: 1.5%, Short: 1.5% |
| **PIP-Based** | Fixed currency unit distance | 10.0 pips |
- **Implementation Notes**:
- ATR-based stops adapt to changing market volatility
- Percentage stops maintain consistent risk exposure
- PIP-based stops provide precise control in stable markets
### Trailing Stops
Locks in profits by adjusting stop-loss levels as price moves favorably:
| Setting | Default Value |
|---------|---------------|
| **Stop-Loss %** | 1.5% |
| **Activation Threshold** | 2.1% |
| **Trailing Distance** | 1.4% |
- **Implementation**:
- Initial stop remains fixed until profit reaches activation threshold
- Once activated, stop follows price at specified distance
- Locks in profit while allowing room for normal price fluctuations
### Risk-Reward Parameters
Defines the relationship between risk and potential reward:
| Setting | Default Value |
|---------|---------------|
| **Risk-Reward Ratio** | 1.4 |
| **Take Profit %** | 2.4% |
| **Stop-Loss %** | 1.5% |
- **Implementation**:
- Take profit distance = Stop loss distance × Risk-reward ratio
- Higher ratios require fewer winning trades for profitability
- Lower ratios increase win rate but reduce average profit
### Filter Combinations
The strategy allows for simultaneous application of multiple filters:
- **Recommended Combinations**:
- Trending markets: RSI + KEMAD filters
- Ranging markets: Bollinger Bands + Volatility filters
- All markets: Volume filter as minimum requirement
- **Performance Impact**:
- Each additional filter reduces the number of trades
- Quality of remaining trades typically improves
- Optimal combination depends on market conditions and timeframe
### Multi-Timeframe Filter Applications
| Filter Type | Current Timeframe | MTF1 (15min) | MTF2 (4h) |
|-------------|-------------------|-------------|------------|
| RSI | Quick entries/exits | Intraday trend | Overall trend |
| Volume | Immediate liquidity | Sustained support | Market participation |
| Volatility | Entry timing | Short-term risk | Regime changes |
| KEMAD | Precise signals | Trend confirmation | Major reversals |
## Visual Indicators and Chart Analysis
The bot provides comprehensive visual feedback on the chart:
- **Channel Bands**: Keltner or MLMA bands showing potential support/resistance
- **Pivot SuperTrend**: Colored line showing trend direction and potential reversal points
- **Entry/Exit Markers**: Annotations showing actual trade entries and exits
- **Risk/Reward Zones**: Visual representation of stop-loss and take-profit levels
These visual elements allow for:
- Real-time strategy assessment
- Post-trade analysis and optimization
- Educational understanding of the strategy logic
## Implementation Guide
### TradingView Setup
1. Load the script in TradingView Pine Editor
2. Apply to your preferred chart and timeframe
3. Adjust parameters based on your trading preferences
4. Enable alerts for webhook integration
### Webhook Integration
1. Configure webhook URL in TradingView alerts
2. Set up receiving endpoint on your trading platform
3. Define message format matching the bot's output
4. Test with small position sizes before full deployment
### Optimization Process
1. Backtest across different market conditions
2. Identify parameter sensitivity through multiple tests
3. Focus on risk management parameters first
4. Fine-tune entry/exit conditions based on performance metrics
5. Validate with out-of-sample testing
## Performance Considerations
### Strengths
- Adaptability to different market conditions through dual channels
- Multiple layers of confirmation reducing false signals
- Comprehensive risk management protecting capital
- Machine learning integration for predictive edge
### Limitations
- Complex parameter set requiring careful optimization
- Potential over-optimization risk with so many variables
- Computational intensity of MLMA calculations
- Dependency on proper webhook configuration for execution
### Best Practices
- Start with conservative risk settings (1-2% of equity)
- Test thoroughly in demo environment before live trading
- Monitor performance regularly and adjust parameters
- Consider market regime changes when evaluating results
## Conclusion
The ₿ober XM v2.0 represents a significant evolution in trading strategy design, combining traditional technical analysis with machine learning elements and multi-timeframe analysis. The core strength of this system lies in its adaptability and recognition of market asymmetry.
### Market Asymmetry and Adaptive Approach
The strategy acknowledges a fundamental truth about markets: bullish and bearish phases behave differently and should be treated as distinct environments. The dual-channel system with separate parameters for long and short positions directly addresses this asymmetry, allowing for optimized performance regardless of market direction.
### Targeted Backtesting Philosophy
It's counterproductive to run backtests over excessively long periods. Markets evolve continuously, and strategies that worked in previous market regimes may be ineffective in current conditions. Instead:
- Test specific market phases separately (bull markets, bear markets, range-bound periods)
- Regularly re-optimize parameters as market conditions change
- Focus on recent performance with higher weight than historical results
- Test across multiple timeframes to ensure robustness
### Multi-Timeframe Analysis as a Game-Changer
The integration of multi-timeframe analysis fundamentally transforms the strategy's effectiveness:
- **Increased Safety**: Higher timeframe confirmations reduce false signals and improve trade quality
- **Context Awareness**: Decisions made with awareness of larger trends reduce adverse entries
- **Adaptable Precision**: Apply strict filters on lower timeframes while maintaining awareness of broader conditions
- **Reduced Noise**: Higher timeframe data naturally filters market noise that can trigger poor entries
The ₿ober XM v2.0 provides traders with a framework that acknowledges market complexity while offering practical tools to navigate it. With proper setup, realistic expectations, and attention to changing market conditions, it delivers a sophisticated approach to systematic trading that can be continuously refined and optimized.
[laoowai]BNB_USDT_3m_3Commas_Bollinger_MACD_RSI_StrategyBNB_USDT _3m
Release Notes:
Time: 3min
Pair: BNB_USDT
Use: {{strategy.order.alert_message}}
What's the difference with 3Commas Bollinger Strategy by tedwardd:
1. Initial capital: 1210 USDT (10$ Base order / 400$*3 Safety order), if you will change, please change JUST safety order volume or number of safety orders 2-3
2. Using just 2(3) safety order (original script 4)
3. More high-performance strategy for BNB_USDT
4. Using MACD to sell order (original script take profit by scale), thanks Drun30 .
5. Using RSI to analyze the market conditions.
Need to change:
bot_id = input(title="3Commas Bot ID", defval=" YOUR DATA ")
email_token = input(title="Bot Email Token", defval=" YOUR DATA ")
---------------------------------------------------------------------------------------------------------------------------------------------------------------------------------------------------
FAQ copy from tedwardd
---------------------------------------------------------------------------------------------------------------------------------------------------------------------------------------------------
This strategy is intended for use as a way of backtesting various parameters available on 3commas.
The primary inputs for the strategy are:
---------------------------------------------------------------------------------------------------------------------------------------------------------------------------------------------------
// USER INPUTS
Short MA Window - The length of the Short moving average
Long MA Window - The length of the Long moving average
Upper Band Offset - The offset to use for the upper bollinger offset
Lower Band Offset - The offset to use for the lower bollinger offset
Long Stop Loss % - The stop loss percentage to test
Long Take Profit % - The Take profit percentage to test
Initial SO Deviation % - The price deviation percentage required to place to first safety order
Safety Order Vol Step % - The volume scale to test
3Commas Bot ID - (self-explanatory)
Bot Email Token - Found in the deal start message for your bot (see link in the previous section for details)
3Commas Bot Trading Pair - The pair to include for composite bot start deals (should match the format of 3commas, not TradingView IE. USDT_BTC not BTCUSDT )
---------------------------------------------------------------------------------------------------------------------------------------------------------------------------------------------------
Start Date, Month, Year and End Date, Month, and Year all apply to the backtesting window. By default, it will use as much data as it can give the current period select (there is less historical data available for periods below 1H) back as far as 2016 (there appears to be no historical data on Trading view much before this). If you would like to test a different period of time, just change these values accordingly.
---------------------------------------------------------------------------------------------------------------------------------------------------------------------------------------------------
Composite bot using a Bollinger band type trading strategy. While its primary intention is to provide users a way of backtesting bot parameters, it can also be used to trigger a deal start by either using the {{strategy.order.alert_message}} field in your alert and providing the bot details in the configuration screen for the strategy or by including the usual deal start message provided by 3commas.
---------------------------------------------------------------------------------------------------------------------------------------------------------------------------------------------------
Original script:
1. 3Commas Bollinger Strategy by tedwardd
2. Momentum Strategy ( BTC /USDT; 1h) - MACD (with source code) by Drun30