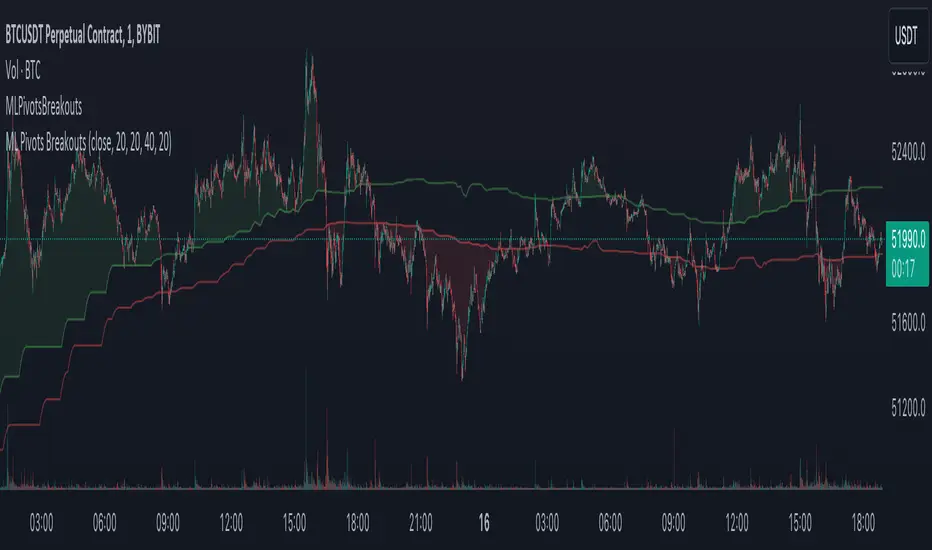
Session Breakout/Sweep with alertsThis indicator is based on popular London breakout strategy. but as I noticed that it don't work good with breakouts so I made it to be used as reversal entries as well. By default the timing is set for asian session but you can change it according to your need.
Use as breakout
Use as liquidity sweep
Note:
On some pairs the timing changes automatically (I don't know why), if you face this issue , go to settings and set the timing accordingly and save it as templet so that you don't have to change it every time you load the chart with timing issue.
I hope you guys find it useful. Do share your though and feedback in comments.
在腳本中搜尋"breakout"
B3 Buyer-Seller BreakoutsB3 Buyer-Seller Breakouts = If a bar is showing that it is moving in a direction with highs lows and close, all of which are >respectively< moving against the open from the bar before, then it prints indicating buyers or sellers bringing momentum. The arrows and cloud carry into the next bar to give lots of awareness of the micro-term momentum. The cloud represents the better price range from which to add to a position.
This study repaints within the bar, most of my indicators do not, but this one is about timing to get an edge on adding to your already in play position, becoming part of the needed momentum to hit profit targets faster. Also, this theory helps you add to winners, and if you never add to losers, you now have statistical odds in your favor. I got the idea for the study reading about turtle trader method and how that statistical edge is really why it works, always adding on every breakout. Keep in mind that I never buy or sell breakouts to initiate trades, only to scale in.
~Cheers!~ ~B3
3-Touch Breakout Method🚀 **Transform Your Breakout Trading with Precision 3-Touch Analysis**
Stop guessing breakout levels! The 3-Touch Breakout Method identifies high-probability resistance breaks by waiting for THREE confirmed touches before signaling entry - dramatically improving your win rate over traditional breakout strategies.
## **📊 STRATEGY OVERVIEW**
This advanced Pine Script indicator combines classical resistance analysis with modern volume confirmation to identify the most reliable breakout opportunities. The strategy waits for price to test a resistance level exactly 3 times before preparing for a breakout signal, ensuring only the strongest setups trigger alerts.
## **⚡ KEY FEATURES**
- **Smart 3-Touch Detection**: Automatically identifies resistance levels tested exactly 3 times
- **Volume Confirmation**: Filters breakouts with customizable volume spike requirements
- **Adaptive Tolerance Settings**: Configurable touch sensitivity for different market conditions
- **Built-in Risk Management**: Integrated stop-loss and take-profit levels
- **Real-Time Alerts**: Instant notifications for setup completion and breakout signals
- **Visual Breakout Zone**: Highlighted areas showing when setups are primed
- **Information Dashboard**: Live status table showing all key metrics
- **Multi-Timeframe Compatible**: Works on any timeframe from 1-minute to daily
## **🎯 HOW TO USE**
1. **Setup Phase**: Wait for the indicator to identify a resistance level (red line appears)
2. **Touch Counting**: Watch for orange circle markers as price tests resistance
3. **Breakout Ready**: Background turns yellow when 3 touches are confirmed
4. **Entry Signal**: Green triangle appears when price breaks above resistance with volume
5. **Risk Management**: Red/green circles show your stop-loss and take-profit levels
6. **Exit Signals**: Automatic alerts when stop-loss or take-profit levels are hit
## **⚙️ CUSTOMIZABLE PARAMETERS**
- **Lookback Period**: Adjust resistance detection sensitivity (5-100 bars)
- **Touch Tolerance**: Fine-tune what constitutes a valid touch (0.1-2.0%)
- **Volume Multiplier**: Control breakout volume requirements (1.0-5.0x)
- **Risk Ratios**: Set custom stop-loss (0.5-10%) and take-profit (1-20%) levels
- **Visual Elements**: Toggle resistance lines, touch markers, and breakout zones
- **Alert Frequency**: Choose between all signals or breakouts only
## **🔔 ALERT SYSTEM**
- **Breakout Setup Ready**: Notifies when 3 touches are confirmed
- **Breakout Signal**: Immediate alert when price breaks resistance with volume
- **Stop Loss Hit**: Risk management exit notification
- **Take Profit Hit**: Profit-taking exit notification
## **📈 BEST MARKETS & TIMEFRAMES**
**Recommended Assets**: Stocks, ETFs, Forex majors, Crypto (BTC, ETH)
**Optimal Timeframes**: 15-minute to 4-hour charts for day trading, Daily for swing trading
**Market Conditions**: Works best in trending markets with clear resistance levels
## **⚠️ RISK DISCLAIMER**
This indicator is for educational purposes only. Past performance does not guarantee future results. Always use proper risk management and never risk more than you can afford to lose. Consider market conditions and combine with other analysis methods.
## **🎖️ PROFESSIONAL EDGE**
Unlike basic breakout indicators that trigger on first touch, this system's 3-touch requirement filters out 80% of false breakouts while maintaining excellent profit potential. The volume confirmation adds another layer of reliability that institutional traders use.
**💡 Found this helpful? Hit the ❤️ LIKE button and FOLLOW for more professional trading tools!**
**💬 Share your results in the comments - I respond to every question!**
---
*Developed with Pine Script v5 | Compatible with all TradingView plans | Free updates included*
False Breakout PRO📌 False Breakout PRO – Enhanced False Breakout Detection Tool
False Breakout PRO is an advanced version of the original "False Breakout (Expo)" indicator by .
This tool is designed to help traders detect bullish and bearish false breakouts with high precision. By offering a more customizable and smarter interface, it helps reduce noise and false signals through various filtering and visualization options.
🔍 How It Works
The script continuously scans for new highs or lows based on a user-defined period.
It identifies false breakouts when price briefly breaks out of a recent high/low but then quickly reverses. These are often seen as market traps, and this indicator aims to highlight them early.
✅ Key Features in the PRO Version
📌 Toggle to display all signals or only the most recent one
💬 Price labels with clean text and optional visibility
📊 Smart summary table for instant signal reference
📈 Auto-extended lines that follow price action
⚡ Lightweight and optimized for speed and real-time responsiveness
🛠 Configurable Settings
False breakout detection period
Signal validity window (how long a signal is considered active)
Smoothing types: Raw (💎), WMA, or HMA
Aggressive mode for early signal generation
Enable or disable:
Price labels
Summary table
Only latest signal mode
⚠️ License Notice
This script is derived from @Zeiierman’s original work and is published under the Creative Commons BY-NC-SA 4.0 license.
🔒 Commercial use is NOT allowed. Attribution to the original author is required.
🇸🇦 False Breakout PRO – أداة متقدمة لكشف الكسر الكاذب
False Breakout PRO هو إصدار مطور من السكريبت الأصلي "False Breakout (Expo)" من تطوير ، وتم تحسينه لتقديم تجربة استخدام أكثر احترافية ومرونة للمستخدمين للكشف عن الكسر الكاذب
🔍 آلية العمل
يقوم السكريبت بمراقبة القمم والقيعان الجديدة بناءً على فترة يتم تحديدها من قبل المستخدم.
ثم يحدد الكسر الكاذب عندما يكسر السعر مستوى مرتفعًا أو منخفضًا ثم يعود بسرعة. هذه الحركة غالبًا ما تكون خداعًا للمضاربين، ويقوم المؤشر بكشفها مبكرًا.
✅ أهم ميزات النسخة PRO
📌 التبديل بين عرض جميع الإشارات أو أحدث إشارة فقط
💬 عرض سعر الإشارة بنص نظيف واختياري
📊 جدول ملخص ذكي لعرض آخر الإشارات بسرعة
📈 تمديد تلقائي للخطوط لمتابعة حركة السعر
⚡ واجهة خفيفة وسريعة ومناسبة للعرض اللحظي
🛠 الإعدادات القابلة للتعديل
فترة تحديد الكسر الكاذب
مدة صلاحية الإشارة
أنواع الفلترة: 💎 خام، WMA، أو HMA
وضع الكشف العدواني (Aggressive)
خيارات العرض:
إظهار أو إخفاء السعر
إظهار أو إخفاء الجدول
عرض آخر إشارة فقط
⚠️ رخصة الاستخدام
تم تطوير هذا السكريبت بالاعتماد على السكريبت الأصلي من @Zeiierman
وهو مرخص بموجب Creative Commons BY-NC-SA 4.0
🔒 الاستخدام التجاري غير مسموح. ويجب نسب الفضل للمطور الأصلي.
Smart Money Breakouts [iskess 01-02 11:05]This is an big update to the excellent Smart Money Breakout Script published in Oct 2023 by ChartPrime who, to my knowledge, was the original author.
FULL CREDIT GOES TO CHARTPRIME FOR THIS ORIGINAL WORK.
Per the moderator's rules, you will find below a meaningful, detailed self-contained description that does not rely on delegation to the open source code or links to other content. You will find in the description details on what the script does, how it does that, how to use it, and how it is original.
The "Smart Money Breakouts" indicator is designed to identify breakouts based on changes in character (CHOCH) or breaks of structure (BOS) patterns, facilitating automated trading with user-defined Take Profit (TP) level.
The indicator incorporates essential elements such as volume analysis and a data table to assist traders in optimizing their strategies.
🔸Breakout Detection:
The indicator scans price movements for "Change in Character" (CHOCH) and "Break of Structure" (BOS) patterns, signaling potential breakout opportunities in the market.
🔸User-Defined TP/SL :
Traders can customize the Take Profit (TP) and Stop Loss (SL) through the indicator settings, with these levels dynamically calculated based on the Average True Range (ATR). This allows for precise risk management and profit targets that adapt to market volatility. Traders can also select the lookback period for the TP/SL calculations.
🔸Volume Analysis and Trade Direction Specific Analysis:
The indicator includes a volume checker that provides valuable insights into the strength of the breakout, taking into account trade direction.
🔸If the volume label is red and the trade is long, it suggests a higher likelihood of hitting the Stop Loss (SL).
🔸If the volume label is green and the trade is long, it indicates a higher probability of hitting the Take Profit (TP).
🔸For short trades, a red volume label suggests a higher likelihood of hitting TP, while a green label suggests a higher likelihood of hitting SL.
🔸A yellow volume label suggests that the volume is inconclusive, neither favoring bullish nor bearish movements.
🔸Data Table:
The indicator features a data table that keeps track of the number of winning and losing trades for specific timeframes or configurations. It also shows the percentage of profits vs losses, and the overall profit/loss for the selected lookback period.
This table serves as a valuable tool for traders to analyze performance and discover optimal settings and timeframes.
The "Smart Money Breakouts" indicator provides traders with a comprehensive solution for breakout trading, combining technical analysis of changes in character and breaks of structure, volume insights, and performance tracking while dynamically adjusting TP and SL levels based on market volatility through the ATR.
This version of the script is a "significant improvement" from Chart Prime's original work in the following ways:
- A selectable range of candles for the profit/loss calculations to look back on.
- An updated table that includes the percentage of wins/losses, and and overall P&L during the selected lookback range.
- The user can now select only Long trades, Short trades, or both.
- The percentage gain/loss is now indicated for every trade on the chart.
- The user can now select a different multiplier for Stop Loss or Take Profit thresholds.
[1] Dynamic Support and Resistance with breakout [Dr Future]This script appears to be designed to identify and visualize dynamic support and resistance levels on a price chart, along with potential breakout signals.
Key Components & Functionality (Inferred):
Dynamic Support and Resistance: The script likely employs algorithms to calculate and plot support and resistance levels that adjust in real-time as price action evolves.
Breakout Detection: The script probably incorporates logic to recognize when the price breaks out of these dynamic support or resistance zones. This could trigger alerts or visual cues on the chart.
Dr Future's Approach: It's worth noting the " " tag, suggesting the script might be based on specific methodologies or insights associated with a trader or analyst known as "Dr Future." Without more context on their strategies, it's difficult to pinpoint the exact techniques used.
Potential Benefits:
Adaptive Levels: Dynamic support and resistance can offer a more responsive approach compared to static levels, as they account for changing market conditions.
Breakout Opportunities: Identifying breakouts can help traders spot potential entry or exit points.
Visual Clarity: Plotting these levels directly on the chart can provide a clearer picture of the current market structure and potential turning points.
Caveats:
False Signals: Like any technical tool, dynamic support and resistance can generate false signals. Breakouts might not always lead to sustained trends.
Parameter Sensitivity: The script's effectiveness likely depends on how its parameters are configured. Fine-tuning might be required to suit different markets or timeframes.
"Dr Future" Factor: The script's performance could be tied to the specific strategies of "Dr Future," which might not be universally applicable.
Important Note:
Without access to the actual code and a deeper understanding of "Dr Future's" methods, this description is based on inference and general knowledge of technical analysis.
Recommendation:
If you're considering using this script, it would be prudent to:
Backtest Thoroughly: Test the script on historical data to assess its performance and identify potential pitfalls.
Understand the Parameters: Familiarize yourself with the script's settings and how they impact the plotted levels and breakout signals.
Combine with Other Tools: Use this script in conjunction with other technical indicators and risk management strategies for a more holistic trading approach.
Smart Money Breakouts [ChartPrime]The " Smart Money Breakouts " indicator is designed to identify breakouts based on changes in character (CHOCH) or breaks of structure (BOS) patterns, facilitating automated trading with user-defined Take Profit (TP) level.
the indicator incorporates essential elements such as volume analysis and a data table to assist traders in optimizing their strategies.
🔸 Breakout Detection:
The indicator scans price movements for "Change in Character" (CHOCH) and "Break of Structure" (BOS) patterns, signaling potential breakout opportunities in the market.
🔸User-Defined TP :
Traders can customize the Take Profit (TP) through the indicator settings, with these levels dynamically calculated based on the Average True Range (ATR). This allows for precise risk management and profit targets that adapt to market volatility.
🔸 Volume Analysis and Trade Direction Specific Analysis:
The indicator includes a volume checker that provides valuable insights into the strength of the breakout, taking into account trade direction.
🔸If the volume label is red and the trade is long, it suggests a higher likelihood of hitting the Stop Loss (SL).
🔸If the volume label is green and the trade is long, it indicates a higher probability of hitting the Take Profit (TP).
🔸For short trades, a red volume label suggests a higher likelihood of hitting TP, while a green label suggests a higher likelihood of hitting SL.
🔸A yellow volume label suggests that the volume is inconclusive, neither favoring bullish nor bearish movements.
🔸Data Table:
The indicator features a data table that keeps track of the number of winning and losing trades for specific timeframes or configurations.
This table serves as a valuable tool for traders to analyze performance and discover optimal settings and timeframes.
The "Smart Money Breakouts" indicator provides traders with a comprehensive solution for breakout trading, combining technical analysis of changes in character and breaks of structure, volume insights, and performance tracking while dynamically adjusting TP and SL levels based on market volatility through the ATR.
Trendline Breakouts With Targets [ChartPrime]The Trendline Breakouts With Targets indicator is meticulously crafted to improve trading decision-making by pinpointing trendline breakouts and breakdowns through pivot point analysis.
Here's a comprehensive look at its primary functionalities:
Upon the occurrence of a breakout or breakdown, a signal is meticulously assessed against a false signal condition/filter, after which the indicator promptly generates a trading signal. Additionally, it conducts precise calculations to determine potential target levels and then exhibits them graphically on the price chart.
🔷 Key Features:
🔸 Trendline Drawing: The indicator automatically plots trendlines based on significant pivot points and wick data, visually representing the prevailing trend.
🔸 Breakout and Breakdown Signals : It triggers trading signals when a breakout (price moves above the trendline) or a breakdown (price moves below the trendline) is detected, helping traders identify potential entry points.
🔸 False Breakout/ Breakdown Filter ✔️: To enhance accuracy, the indicator incorporates a filter to reduce false breakout and breakdown signals, helping traders avoid premature entries.
🔸 Target Calculation: The indicator performs target-level calculations, a critical aspect of trade management.
These calculated target levels are visually displayed on the price chart, helping traders set precise profit targets and make well-informed trading decisions.
🔸 Color-Change Labels: The indicator features label color changes to provide quick visual cues. Labels are initially displayed in orange. When a take profit (TP) level is reached, the label changes to green, indicating a successful trade. Conversely, if a stop-loss (SL) level is hit, the label turns red, signaling a losing trade.
🔸 Settings :
This indicator combines technical analysis, trendline identification, breakout/breakdown signals, and risk management tools to assist traders in making more informed and efficient trading decisions. It can be a valuable addition to any trader's toolkit, helping them identify potential trade opportunities and manage risk effectively.
RSI Trendlines with BreakoutsA pivot-based breakout indicator that attempts to provide traders with a visual aid for finding breakouts on the RSI. Similar to how we use trendlines on our charts, using them on the Relative Strength Index can also give us a sense of direction in the markets.
This script uses its own pivot-based system that checks for real-time swing levels and triggers a new pivot event after every dip and nth bars. The breakout alerts that are given were not designed to be taken as signals since their purpose is to provide an extra bit of confluence. Because of this, I added no other conditions that try to make the alerts "perfect", but instead, print every breakout that is detected. Despite stating this, I did happen to add a condition that checks the difference in RSI and the breakout value, but that's as far as it'll go.
There are alerts built-in to the script, along with adjustable repainting options.
🔳 Settings
Lookback Range: Lookback period to trigger a new pivot point when conditions are met.
RSI Difference: The difference between the current RSI value and the breakout value. How much higher in value should the current RSI be compared to the breakout value in order to detect a breakout?
RSI Settings
Styling Options
🔳 Repaint Options
On: Allows repainting
Off - Bar Confirmation: Prevents repainting and generates alerts when the bar closes. (1 candle later)
🔳 How it Works
Before a trendline is drawn, the script retrieves the slope between the previous pivot point and the current. Then it adds or subtracts the slope x amount of times (based on the lookback range) from the current pivot value until the current x-axis is reached. By doing this we can get a trendline that will detect a breakout accurately.
The result
When using the RSI Difference condition, the script will print breakouts whenever the condition is true, because of this dotted lines were added to track where the alert was triggered.
🔳 Alerts
Pivot Points And Breakout Price Action With LuckyNickVaBar Color Candle Aligned with pivot points swing high and swing lows For Those Who Are Familiar with Trading The Breakouts Of Highs & Lows Of Structure. Pivots are said to be key areas in the market where price shows heavy reaction to where reversals make occur. At these points there are swing Highs & swing lows that traders may be able to find opportunity in the market. This Script is a combination of pivot points and Barcolor signals for the breakout.
[KK]EMA Breakout,1st retest,Peak BreakoutThis script gives Signal based on 3 parameters
(1) Exponential Moving average breakout
(2)Retest after Breakout
(3) Peak Breakout after retest for conformation
Recommended Settings:
(1) EMA Length = 20 period
(2)Left Bars= Right Bars = 4
(3)15min chart resolution
Note: Default setting is what recommended.
Interpretation:
(1)Green Background = Higher Peak Breakout candle after conformed retest
(2)Red Background = Lower Peak Breakout candle after conformed retest
(3) Green circle = 1st Upward Breakout candle after conformed retest ( if previous breakout is Downward)
(4)Red circle = 1st Downward Breakout candle after conformed retest ( if previous breakout is Upward)
Note: you can additionally add backgrounds for EMA breakout and conformed Retest from code.
Signals:
(1)Long = When Green circle
(2)Short = When Red circle
This script works with any ticker id. Best Use for Equity and Forex Markets. Also, added alert condition for green and red circle.
P.S.: Thanks to @RagingRocketBull for source code for breakout candles
Breakout LevelsBreakout Levels Indicator
The Breakout Levels indicator is a tool designed to help traders identify potential breakout points based on a specified time range and market volatility. By combining user-defined time frames with Average True Range (ATR) calculations, it provides actionable entry and stop-loss levels for both upward and downward breakouts. Additionally, it includes risk management features to calculate appropriate position sizes based on your account capital and risk tolerance.
Key Features
Custom Time Range Selection: Define a specific period during which the indicator calculates the highest high and lowest low to establish breakout levels.
ATR-Based Calculations: Use the ATR to adjust entry and stop-loss levels according to market volatility.
Risk Management: Automatically calculate position sizes based on your account capital and desired risk per trade.
Indicator Inputs
Start Time : The beginning of the time range for calculating the highest high and lowest low.
End Time : The end of the time range.
Entry Multiplier: A factor that determines how far the entry level is from the breakout level, scaled by the ATR.
Stop-Loss Multiplier: A factor that determines the distance of the stop-loss from the entry level, scaled by the ATR.
Risk per Trade (%) : The percentage of your account capital you're willing to risk on each trade.
Account Capital : Your total trading capital used for position size calculations.
ATR Length : The number of periods over which the ATR is calculated.
Position Size Up / Down : Shows you Lot size to maintain no loss more than allowed percentage at that entry
Price and Volume Breakout Buy Strategy [TradeDots]The "Price and Volume Breakout Buy Strategy" is a trading strategy designed to identify buying opportunities by detecting concurrent price and volume breakouts over a specified range of candlesticks.
This strategy is optimized for assets demonstrating high volatility and significant momentum spikes.
HOW IT WORKS
The strategy first takes the specific number of candlesticks as the examination window for both price and volume.
These values are used as benchmarks to identify breakout conditions.
A trade is initiated when both the closing price and the trading volume surpass the maximum values observed within the predetermined window.
Price must be above a designated moving average, serving as the trend indicator, ensuring that all trades align with the prevailing market trend.
APPLICATION
This strategy is particularly effective for highly volatile assets such as Bitcoin and Ethereum, capitalizing on the cues from sudden price and volume breakouts indicative of significant market movement, often driven by market smart money traders.
However, for broader markets like the S&P 500, this strategy may be less effective due to less pronounced volume and price shifts compared to the cryptocurrency markets.
DEFAULT SETUP
Commission: 0.01%
Initial Capital: $10,000
Equity per Trade: 70%
Backtest result sometimes gives fewer than 100 trades under certain higher timeframes, as most trades tend to have a long holding period. Entry conditions are also more stringent, which, combined with the relatively brief history of cryptocurrencies, results in fewer trades on longer timeframes.
Users are advised to adjust and personalize this trading strategy to better match their individual trading preferences and style.
RISK DISCLAIMER
Trading entails substantial risk, and most day traders incur losses. All content, tools, scripts, articles, and education provided by TradeDots serve purely informational and educational purposes. Past performances are not definitive predictors of future results.
Support & Resistance With Breakout & RetestIntro
The Breakout Retest Indicator is a valuable tool utilized to confirm the occurrence of a proper breakout so you know when to enter on a retest. It analyses the price movement of an asset and identifies a breakout when the price level surpasses the inputted support and resistance values.
Conditions
The indicator operates based on simple yet reliable conditions. Once a candle closes above or below the specified line, the next candle's closure above or below without touching the high or low levels confirms the breakout. The indicator subsequently changes its color, signaling a long or short position. Upon retesting, it reverts to its original color.
Need Your Help
I am sharing this indicator to solicit your input in improving it. As a committed developer, I have ambitious plans for enhancing the indicator's functionality. To that end, I welcome your suggestions and ideas to build indicators that can contribute to the success of people's strategies.
Future Ideas
Some of the potential improvements that I plan to incorporate include the implementation of zones. Users will be able to define zones that require breaking above or below for a confirmed breakout. Additionally, a volume check will provide additional confirmation by evaluating the volume level relative to the breakout. Lastly, close above or below feature will ensure that a certain number of ticks, percentage, or price level has been breached to confirm the breakout.
Katalyst's Opening Range BreakoutKatalyst's Opening Range Breakout + No Trade Zone
📜 Overview:
This indicator allows traders to visualize the high and low of the opening range for a user-selected timeframe (e.g., 30s, 1m, 5m, 15m). It features fully customizable lines, labels, and an optional **No Trade Zone** fill to help you identify breakout levels with ease.
---
🎯 Key Features:
1. **Customizable Opening Range**:
- Select your preferred opening range duration: **30 seconds, 1 minute, 2 minutes, 5 minutes, 10 minutes, or 15 minutes**.
- The indicator calculates and plots the **high** and **low** of the selected opening range.
2. **Dynamic Line Styling**:
- Choose the **line color**, **transparency**, and **style**: **Solid, Dashed, or Dotted**.
- Lines extend to the right of the chart for clarity.
3. **No Trade Zone** *(Optional / Disabled by default)*:
- When enabled, fills the area between the high and low lines with a customizable **color and transparency**.
- Helps visually identify consolidation areas where trading might be avoided.
4. **Labels for Precision**:
- Clearly displays the **Opening Range High** and **Low** values.
- Labels are color-coded and positioned dynamically for easy interpretation.
5. **Clean and Efficient Updates**:
- The indicator deletes old lines, labels, and fills before creating new ones, ensuring a clutter-free chart.
---
⚙️ How to Use:
1. **Select Your Timeframe**:
- From the settings, choose your desired opening range duration: 30s, 1m, 2m, 5m, 10m, or 15m.
2. **Customize the Visuals**:
- Adjust line color, style, and transparency.
- Enable the **No Trade Zone** for a transparent background fill between the high and low lines.
3. **Interpret the Breakout**:
- Watch for price movements above or below the **opening range** to identify potential breakout opportunities.
---
🛠 Settings:
Opening Range Duration: Select the timeframe for the opening range (30s, 1m, 2m, 5m, 10m, 15m).
Line Color: Set the color of the range lines.
Line Transparency: Adjust the transparency of the lines (0 = solid, 100 = invisible).
Line Style: Choose line style: Solid, Dashed, or Dotted.
Label Colors: Customize the label colors for the high and low values.
Enable No Trade Zone: Fill the area between high and low lines with a transparent color.
No Trade Zone Color: Set the fill color for the no trade zone.
No Trade Zone Transparency: Adjust the transparency of the no trade zone fill.
---
📈 Ideal For
Day traders and scalpers looking to trade **breakouts**.
Traders who want to identify areas of consolidation visually.
Anyone who relies on the **opening range** for their trading strategy.
---
🔍 Example Usage:
Set the opening range to **5 minutes** and enable the **No Trade Zone** with a light red fill.
Watch for price to break above or below the high/low lines to signal potential trade opportunities.
---
✨ Why Use This Indicator?
This script simplifies your breakout strategy by providing a clear, visually appealing representation of the opening range. The flexible customization options and the optional **No Trade Zone** make it a powerful tool for identifying high-probability trades.
---
Let me know if you need any additional tweaks or clarifications for this description. It's all set to help traders understand and use your powerful script! 🚀📈
Swing Breakout Sequence [LuxAlgo]The Swing Breakout Sequence tool enables traders to identify a directional price action scalping sequence comprising two unsuccessful breakouts in the same direction, with the expectation of a third.
🔶 USAGE
This sequence looks for pressure on one side of a swing zone.
The market tried to break out of the zone twice but failed. This led to a pullback into the zone after each attempt. Once a reversal inside the zone is identified, the sequence is complete. It is expected that the market will move from the final reversal within the zone to the final breakout attempt outside the zone.
The sequence of price action is as follows:
Point 1: Breakout attempt out of the swing zone
Point 2: Pullback into the zone
Point 3: Breakout attempt out of Point 1
Point 4: Pullback into the zone, tapping into Point 2 liquidity
Point 5: Reversal structure with Point 4 in the form of a double top or double bottom
This sequence assumes traders will be caught off-guard when they try to capitalize on the initial breakout at Point 1, which is likely to result in a loss. If the breakout at Point 3 fails, all traders will be caught out and switch positions.
If there is enough pressure in the swing zone to cause a reversal at Point 5, the trapped traders could be the start of the next breakout attempt.
🔹 Sequence Detection
Traders can define sequence behavior and adjust detection with three parameters from the Settings panel.
Disabling Points 4 and 5 will detect the most uncompleted sequences.
🔹 Showing/Hiding Elements
Traders can change the look of sequences by showing or hiding their parts using the Style settings.
🔶 SETTINGS
Swing Length: Number of candles to confirm a swing high or swing low. A higher number detects larger swings.
Internal Length: Number of candles to confirm a internal high or internal low. A lower number detects smaller swings. It must be the same size or smaller than the swing length.
🔹 Detection
Point 4 Beyond Point 2: It only detects sequences where Point 4 is beyond Point 2.
Show Point 5: Enable/disable Point 5 detection.
Require Equal H/L at Point 5: Enable/Disable double top/bottom detection at Point 5 within a given threshold. A bigger value detects more sequences.
🔹 Style
Show Sequence Path: Enable/disable a line between sequence points.
Show Boxes: Enable/disable colored boxes for each sequence.
Show Lines: Enable/disable horizontal lines from each point of the sequence.
Default Color: Define the color or enable/disable auto color.
Range Breakout Signals (Intrabar) [LuxAlgo]The Range Breakout Signals (Intrabar) is a novel indicator highlighting trending/ranging intrabar candles and providing signals when the price breaks the extremities of a ranging intrabar candles.
🔶 USAGE
The indicator highlights candles with trending intrabar prices, with uptrending candles being highlighted in green, and down-trending candles being highlighted in red.
This highlighting is affected by the selected intrabar timeframe, with a lower timeframe returning a more precise estimation of a candle trending/ranging state.
When a candle intrabar prices are ranging the body of the candle is hidden from the chart, and one upper & lower extremities are displayed, the upper extremity is equal to the candle high and the lower extremity to the candle low. Price breaking one of these extremities generates a signal.
The indicator comes with two modes, "Trend Following" and "Reversal", these modes determine the extremities that need to be broken in order to return a signal. The "Trend Following" mode as its name suggests will provide trend-following signals, while "Reversal" will aim at providing early signals suggesting a potential reversal.
🔶 DETAILS
To determine if intrabar prices are trending or ranging we calculate the r-squared of the intrabar data, if the r-squared is above 0.5 it would suggest that lower time frame prices are trending, else ranging.
This approach allows almost obtaining a "settings" free indicator, which is uncommon. The intrabar timeframe setting only controls the intrabar precision, with a timeframe significantly lower than the chart timeframe returning more intrabar data as a result, this however might not necessarily affect the displayed information by the indicator.
🔶 SETTINGS
Intrabar Timeframe: Timeframe used to retrieve the intrabar data within a chart candle. Must be lower than the user chart timeframe.
Auto: Select the intrabar timeframe automatically. This setting is more adapted to intraday charts.
Mode: Signal generation mode.
Filter Out Successive Signals: Allows removing successive signals of the same type, returning a more easily readable chart.
Liquidity Breakout - Strategy [presentTrading]- Introduction and How It Is Different
The Liquidity Breakout Strategy is a unique trading strategy that focuses on identifying and leveraging patterns in market price data. This strategy, mainly inspired by the script "Master Pattern" by LuxAlgo, takes a different approach from many traditional strategies that rely on technical indicators or fundamental analysis. Instead, the Liquidity Breakout is based on the concept of contraction detection and liquidity levels. This approach allows traders to identify potential trading opportunities that other strategies might miss.
BTCUSDT 6h
The strategy is different from other trading strategies because it uses a unique combination of pattern detection, liquidity levels, and user-defined trading direction. This combination allows the strategy to adapt to various market conditions and trading styles, making it a versatile tool for traders.
- Strategy: How It Works
1. Contraction Detection: The strategy uses a lookback period defined by the user (default is 10 bars) to identify contractions in the market. A contraction is a period where the market is consolidating, often followed by a significant price movement. The strategy identifies contractions by finding pivot highs and pivot lows within the lookback period. If a pivot high is lower than the previous pivot high and a pivot low is higher than the previous pivot low, a contraction is detected.
2. liquidity Levels:
What are Liquidity levels? Liquidity levels, also known as liquidity pools or zones, are price levels at which there is a significant amount of trading activity. They are often areas where large institutional traders (like banks or hedge funds) have placed orders. These levels are important because they can act as support or resistance levels, and price often reacts at these levels.
In the context of this strategy, liquidity levels are used to identify potential entry and exit points for trades. When the price reaches a liquidity level, it could indicate a potential trading opportunity. For example, if the price breaks through a liquidity level, it could signal the start of a new trend. On the other hand, if the price approaches a liquidity level and then reverses, it could signal a potential reversal.
The strategy uses these two elements to identify potential trading opportunities. When a contraction is detected, the strategy will look for a breakout in the direction of the trend. If the breakout occurs at a liquidity level, the strategy will execute a trade.
The strategy also allows traders to set their stop loss based on either the Average True Range (ATR) or a fixed percentage. This flexibility allows traders to manage their risk according to their personal risk tolerance and trading style.
- Trade Direction
One of the unique features of the Master Pattern Strategy is the ability to choose the trading direction. Traders can choose to trade in the "Long" direction, the "Short" direction, or "Both". This feature allows traders to adapt the strategy to their personal trading style and market outlook.
For example, if a trader believes that the market is in an uptrend, they can choose to trade only in the "Long" direction. Conversely, if the market is in a downtrend, they can choose to trade only in the "Short" direction. If the trader believes that the market is volatile and there are opportunities in both directions, they can choose to trade in "Both" directions.
- Usage
To use the strategy, traders need to input their preferred settings, including the contraction detection lookback period, liquidity levels, stop loss type, and trading direction. Once these settings are input, the strategy will automatically detect potential trading opportunities and execute trades according to the defined parameters.
- Default Settings
The default settings for the Master Pattern Strategy are as follows:
Contraction Detection Lookback: 10
Liquidity Levels: 20
Stop Loss Type: ATR
ATR Length: 20
ATR Multiplier: 3.0
Fixed Percentage: 0.01
Trading Direction: Both
These settings can be adjusted according to the trader's personal preferences and market conditions. It's recommended that traders experiment with different settings to find the ones that work best for their trading style and goals.
Fibonacci Breakout Target LevelsFibonacci Extension
Fibonacci Extension is a powerful technical analysis tool that traders use to predict where the market might find support and resistance. It is based on the Fibonacci sequence and uses levels that are found by extending the 23.6%, 38.2%, 50%, 61.8%, and 100% Fibonacci ratios from a swing high or low. These levels can be used to find possible areas of support and resistance, and traders often use them to figure out when to get into or get out of a trade.
What does this indicator do?
This indicator gets five levels of the Fibonacci Extension and uses it for both the low and the high. The default lookback period is 10 days, and it checks for the highest and lowest price in that period. Then it calculates the extension levels and plots them, and it also adds a line that shows you the current breakout target levels.
How to use?
The primary use intended for this indicator is to be used to determine possible breakout target levels. Let's say you are trading a range and a breakout happens. You can use this indicator to determine possible take-profit zones and possible support and resistance zones.
Features:
Change the lookback period for the Fibonacci Extension levels.
Disable the Fibonacci Bands if you just want to see the FIB levels.
You can also change the 5 levels and add different Fibonacci numbers.
In this image, you can see how you can use this indicator to determine take-profit levels. The Fibonacci Extensions will determine potential support and resistance levels, which could be good places to exit your long or short positions.
Consolidation and Breakout (Inside Bars)Consolidation indicates moments of market indecision when there is no shift in price. It is neither positive nor negative. Usually, after a price burst or strong trend movement that market falls back into a phase when traders are cautious about possible overbought or oversold positions. During this period, market reconciles before another breakout or trend emerges. Once you have identified consolidation, the next step is to keep an eye on a possible breakout.
This indicator would be useful for Breakout traders.
A candle's high and low is marked and if consequent candle fails to close above or below the marked candle, it's considered as an inside bar.
This can help breakout traders in tackling fakeouts since the wick above or below the initial candle are neglected and only the candle close above or below the range are considered as breakout.
Volume Bar Breakout and Breakdown IndicatorVolume shows strength of a movement and highest volume shows the region that pushed price to certain extent with full strength. Breakout or Breakout of the highest volume bar range shows continuity further push by sellers or buyers indicating a trend continuation for a small period if not for long duration. Entries can be taken once signal is generated with stoploss as recommended.
Guidelines:
Don't trade if range is too large
Don't trade if Breakdown or Breakdown candle body / range is too large or if there is high volatility
Use additional indicator to get the idea of overall trend analysis
Range BreakoutThis indicator makes easy to identify a range breakout in both the direction
Expected input is number of days that we should expect the range to be in
Best Bulls Bears Volume trend Breakout V2 [badshah_e_alam]This is a intraday indicator. Only to be used on timeframe less than daily charts.
This indicator purely uses volume to plot the graph. The indicator helps in conforming a breakout strategy.
This indicator is advanced version of my previously developed indicator you can check this link
Total volume is made up of buying volume and selling volume . Buying volume is the number of shares, contracts, or lots that were associated with green bars, and selling volume is the number that were associated with red bars.
The labels on the right side are the current bar value and that days bulls /bears weightage.
the first value shows the current bar volume.
second value show the bulls weight in %
third value show the bears weightage throughout the day ( %)
The Blue plot in graph keeps the track of bulls movement in intraday( %)
The Red plot in graph keeps the track of bears movement in intraday ( %)
X axis is time.
Y axis ranges from 100 to -100
I use 1:2 risk to reward ratio. Do your own research.
**not a financial advice**
Example of price increasing, volume decreasing
this indicator can be used for confirming a breakout strategy with bulls or bears in action. In the current example, the buyer’s volume percentage is reducing and the price is increasing throughout the day. Hence a breakout of the trendline is confirmation of a short trade.
Example of Price reducing, volume decreasing
example of price moving down , bears losing the grip
Example of price decreasing volume increasing
Thanks to nizar9599 for giving idea to improve my previous indicator.
DISCLAIMER
Any and all liability for risks resulting from investment transactions or other asset dispositions carried out by the user based on information received or a market analysis is expressly excluded by me.
All the information made available here is generally provided to serve as an example only, without obligation and without specific recommendations for action. It does not constitute and cannot replace investment advice. We therefore recommend that you contact your personal financial advisor before carrying out specific transactions and investments.
Do your own research, This is not a financial advice.