OPEN-SOURCE SCRIPT
B3 Buyer-Seller Breakouts
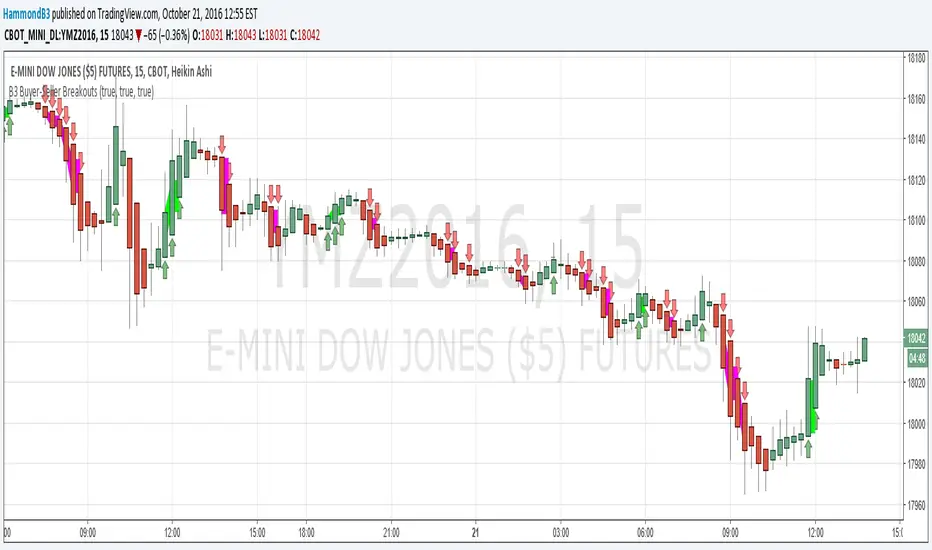
B3 Buyer-Seller Breakouts = If a bar is showing that it is moving in a direction with highs lows and close, all of which are >respectively< moving against the open from the bar before, then it prints indicating buyers or sellers bringing momentum. The arrows and cloud carry into the next bar to give lots of awareness of the micro-term momentum. The cloud represents the better price range from which to add to a position.
This study repaints within the bar, most of my indicators do not, but this one is about timing to get an edge on adding to your already in play position, becoming part of the needed momentum to hit profit targets faster. Also, this theory helps you add to winners, and if you never add to losers, you now have statistical odds in your favor. I got the idea for the study reading about turtle trader method and how that statistical edge is really why it works, always adding on every breakout. Keep in mind that I never buy or sell breakouts to initiate trades, only to scale in.
~Cheers!~ ~B3
開源腳本
本著TradingView的真正精神,此腳本的創建者將其開源,以便交易者可以查看和驗證其功能。向作者致敬!雖然您可以免費使用它,但請記住,重新發佈程式碼必須遵守我們的網站規則。
免責聲明
這些資訊和出版物並不意味著也不構成TradingView提供或認可的金融、投資、交易或其他類型的意見或建議。請在使用條款閱讀更多資訊。
開源腳本
本著TradingView的真正精神,此腳本的創建者將其開源,以便交易者可以查看和驗證其功能。向作者致敬!雖然您可以免費使用它,但請記住,重新發佈程式碼必須遵守我們的網站規則。
免責聲明
這些資訊和出版物並不意味著也不構成TradingView提供或認可的金融、投資、交易或其他類型的意見或建議。請在使用條款閱讀更多資訊。