BOS mark-out (by Lumiere)Advanced BOS Detection with Strict Swing Confirmation
This indicator implements BOS detection with several unique features:
🔹 Dual-Candle Swing Validation - Unlike most BOS indicators that use single candle swings, this uses a two-candle confirmation for swing highs/lows, analyzing both the candle wicks and body transitions.
🔹 Directional Lock System - Implements a state machine that prevents duplicate signals until an opposite-direction BOS occurs, reducing noise.
🔹 Precision Wick Analysis - Compares wicks between the reversal candle and confirmation candle to identify the true swing point.
🔹 Real-Time Update & Live Market Adaptation – The indicator continuously monitors price action and instantly updates BOS signals as new candles form, ensuring you never miss a BOS.
How It Differs From Other BOS Indicators:
Most public BOS indicators use simple HH/HL or LH/LL detection.
Many don't implement the directional locking mechanism.
Few use the two-candle wick comparison approach.
Wick-Based Precision uses the extreme wicks of two candles (not just the body).
Strict Confirmation requires a close beyond the swing point (no "wick breaks" counted).
Usage Examples:
🟦 Bullish BOS:
A green candle closes, followed by a red candle. This will be the new high, and if the next candle closes above the highest wick of those two, it will be a BOS (only if we had a bearish BOS before)
🟥 Bearish BOS:
A red candle closes, followed by a green candle. This will be the new low, and if the next candle closes below the lowest wick of those two, it will be a BOS (only if we had a Bullish BOS before)
Tool

Total Bars CalculatorThis indicator simply plots how much bars are available to the user in the respective chart.
For Example if plot shows 5000 , therefore you have total 5000 bars of OHLC available.

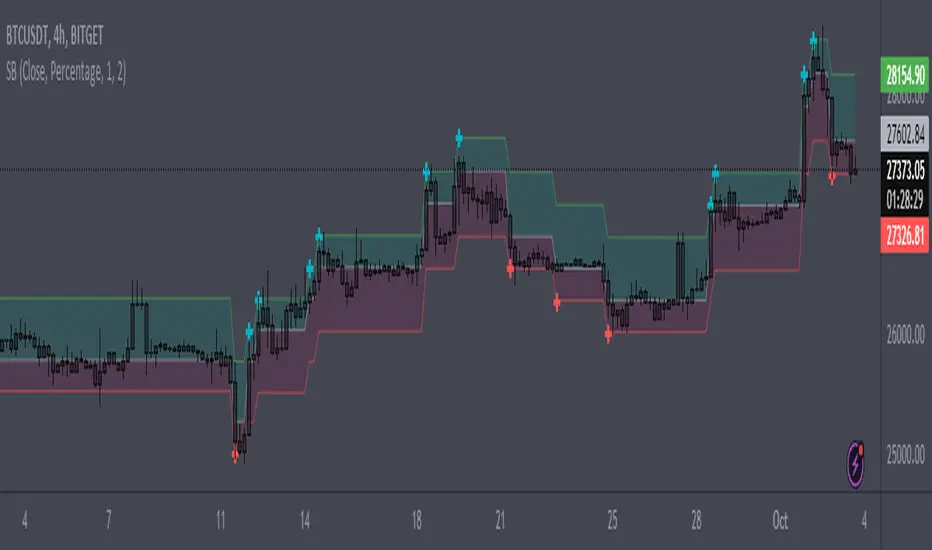
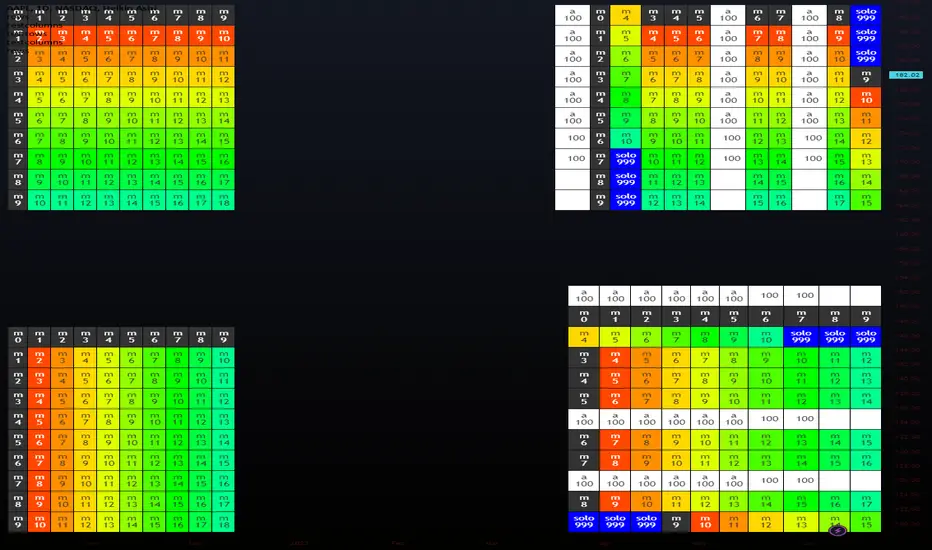
SizeblockPrice change indicator in the form of diagonal rows.
The calculation is based on the percentage or tick deviation of the price movement (indicated in the "Deviation" parameter), which is displayed on the chart in the form of rows.
The row consists of the base middle line, upper and lower limits:
The middle line is the basis for the upper and lower limits of the current row.
The upper and lower limits are deviations from the base middle line of the current row.
The base middle line is equal to the upper or lower limits of the previous row (if the price changes rapidly in one time interval, then the base middle line of the current row is greater than the upper limit of the previous row or less than the lower limit of the previous row by an equal number of deviations depending on the direction of price movement). At the beginning of the calculation, the base middle line is equal to the initial value of the first row.
The "Quantity" parameter determines the deviation for the upper or lower limits depending on the direction of the price movement, and the "U-turn" parameter determines the deviation for changing the direction of the price movement.
The rule for constructing a new row:
The "Source" parameter accepts, depending on the choice, the price of high, low values or the closing price from the time interval of the chart.
When the price reaches the upper or lower limits of the row and goes beyond them, a new row is formed with the same parameters for deviation of the upper and lower limits from the base middle line, depending on the direction of price movement.
By adjusting certain deviations, you can clearly see the local trend and reversal points on the chart.
A useful tool for tracking price direction.
Thanks for your attention!
Monthly Strategy Performance TableWhat Is This?
This script code adds a Monthly Strategy Performance Table to your Pine Script strategy scripts so you can see a month-by-month and year-by-year breakdown of your P&L as a percentage of your account balance.
The table is based on realized equity rather than open equity, so it only updates the metrics when a trade is closed.
That's why some numbers will not match the Strategy Tester metrics (such as max drawdown), as the Strategy Tester bases metrics like max drawdown on open trade equity and not realized equity (closed trades).
The script is still a work-in-progress, so make sure to read the disclaimer below. But I think it's ready to release the code for others to play around with.
How To Use It
The script code includes one of my strategies as an example strategy. You need to replace my strategy code with your own. To do that just copy the source code below into a blank script, delete lines 11 -> 60 and paste your strategy code in there instead of mine. The script should work with most systems, but make sure to read the disclaimer below.
It works best with a significant amount of historical data, so it may not work very effectively on intraday timeframes as there is a severe limitation of available bars on TradingView. I recommend using it on 4HR timeframes and above, as anything less will produce very little usable data. Having a premium TradingView plan will also help boost the number of available bars.
You can hover your mouse over a table cell to get more information in the form of tooltips (such as the Long and Short win rate if you hover over your total return cell).
Credit
The code in this script is based on open-source code originally written by QuantNomad, I've made significant changes and additions to the original script but all credit for the idea and especially the display table code goes to them - I just built on top of it:
Why Did I Make This?
None of this is trading or investment advice, just my personal opinion based on my experience as a trader and systems developer these past 6+ years:
The TradingView Strategy Tester is severely limited in some important ways. And unless you use complex Excel formulas on exported test data, you can't see a granular perspective of your system's historical performance.
There is much more to creating profitable and tradeable systems than developing a strategy with a good win rate and a good return with a reasonable drawdown.
Some additional questions we need to ask ourselves are:
What did the system's worst drawdown look like?
How long did it last?
How often do drawdowns occur, and how quickly are they typically recovered?
How often do we have a break-even or losing month or year?
What is our expected compounded annual growth rate, and how does that growth rate compare to our max drawdown?
And many more questions that are too long to list and take a lifetime of trading experience to answer.
Without answering these kinds of questions, we run the risk of developing systems that look good on paper, but when it comes to live trading, we are uncomfortable or incapable of enduring the system's granular characteristics.
This Monthly Performance Table script code is intended to help bridge some of that gap with the Strategy Tester's limited default performance data.
Disclaimer
I've done my best to ensure the numbers this code outputs are accurate, and according to my testing with my personal strategy scripts it appears to work fine. But there is always a good chance I've missed something, or that this code will not work with your particular system.
The majority of my TradingView systems are extremely simple single-target systems that operate on a closed-candle basis to minimize many of the data reliability issues with the Strategy Tester, so I was unable to do much testing with multiple targets and pyramiding etc.
I've included a Debug option in the script that will display important data and information on a label each time a trade is closed. I recommend using the Debug option to confirm that the numbers you see in the table are accurate and match what your strategy is actually doing.
Always do your own due diligence, verify all claims as best you can, and never take anyone's word for anything.
Take care, and best of luck with your trading :)
Kind regards,
Matt.
PS. If you're interested in learning how this script works, I have a free hour-long video lesson breaking down the source code - just check out the links below this script or in my profile.

[MiV] Trading SessionHello, everyone!
Today I want to present my new script, which I hope will help not only me!
I'm sure that many people, like me, went through such a stage as "building their strategy". This is when you sit and test on the history how you would enter or exit a trade.
Recently I was doing the same thing and realized that my "tests" involve night time, when in reality I would be asleep and not trading! So I decided to create an indicator that would display my "working hours" so that the backtest I conduct would be as realistic as possible.
Also this indicator is able to display sessions of major exchanges and forex working hours, so it will be useful not only for cryptocurrency lovers.
In addition, we don't always trade every day and, for example, I don't trade on Sunday. That's why we added a feature that "turns off" the day and does not highlight it in color if you're not planning to trade on that day.
And finally, I added a notification of the beginning and end of the trading session. A small thing, but it may also be a useful feature for those who like to sit at the chart!
I will be glad to receive any comments and suggestions!
-----
Всем привет!
Хочу сегодня представить свой новый скрипт, который, надеюсь, поможет не только мне!
Уверен, что многие, как и я, проходили такой этап как "постройка своей стратегии". Это когда ты сидишь и тестируешь на истории то как бы ты входил или выходил из сделки.
Вот недавно я ровно также занимался этим и осознал, что мои "тесты" затрагивают и ночное время, когда в реальности я бы спал и не торговал! Поэтому я решил создать индикатор, который будет отображать мои "рабочие часы", чтобы бектест, который я провожу, был максимально реалистичным.
Также данный индикатор умеет отображать сессии крупных бирж и время работы форекса, так что полезным он будет не только для любителей криптовалюты.
Кроме того, мы же не всегда торгуем каждый день и например я не торгую в воскресенье. Поэтому добавлен функционал, который "выключает" день и не подсвечивает его цветом, если ты в этот день не планируешь торговать.
Ну и в заключении, добавил уведомление о начале и завершении торговой сессии. Мелочь, а тоже может быть полезной фичей для тех кто любит засесть за графиком!
Буду рад любым замечаниям и предложениям!

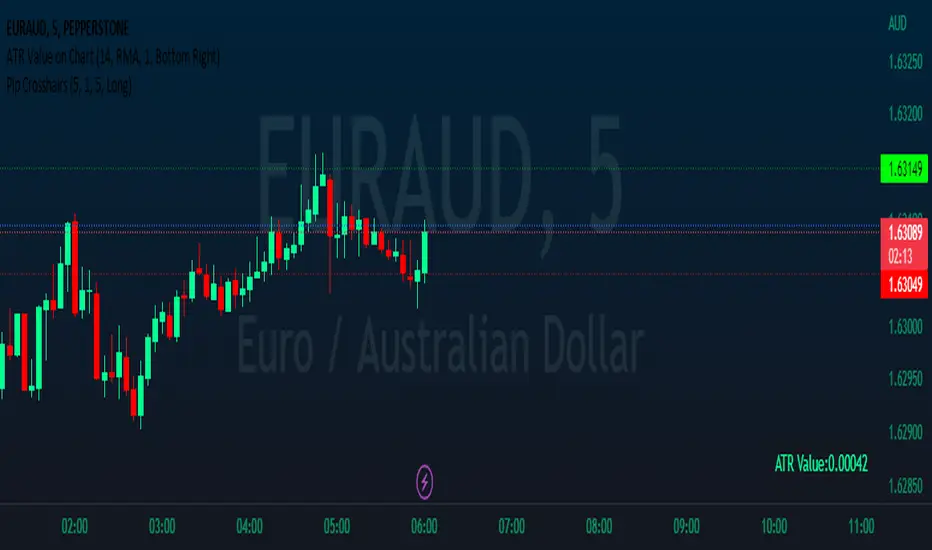
Pip CrosshairsThis is a simple tool designed to help you visualize your stop loss and take profit levels before entering a trade. The tool plots two lines on the chart - a green dotted line for take profit and a red dotted line for stop loss (similar to the price line) - with a simulated default spread of one pip factored in. The indicator has the option to toggle between long and short positions.
Please note that the spread used in the tool is not based on your actual spread and should be adjusted accordingly. As, to the best of my knowledge Pine Script does not have the ability to automatically include spread in an indicator, so you will need to input your spread manually. (if you can please let me know cause that would be a game changer).
Overall, should help save you a bit of time by not having to manually measure stop loss and take profit levels for each trade.
Happy hunting :)
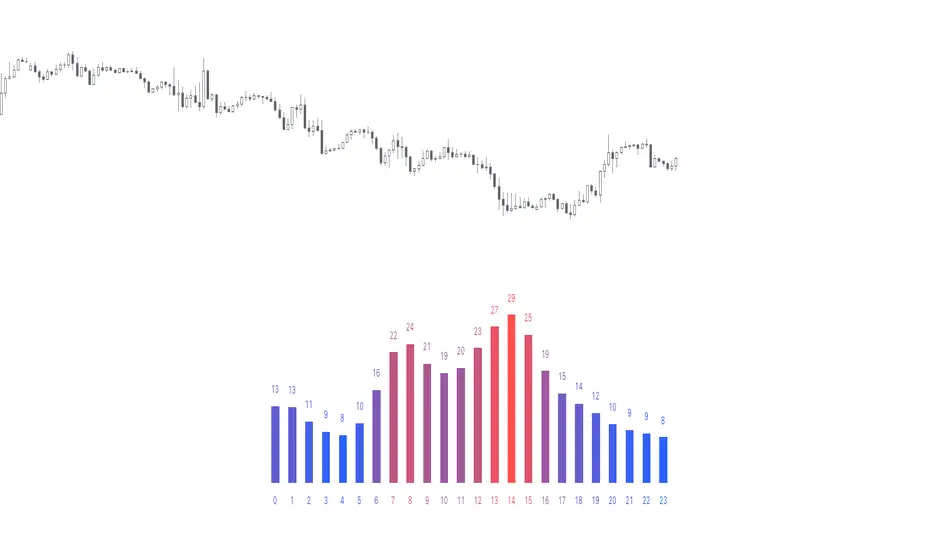
Time of Day - Volatility Report█ OVERVIEW
The indicator analyses the volatility and reports statistics by the time of day.
█ CONCEPTS
Around the world and at various times, different market participants get involved in the markets. How does this affect the market?
Knowing this gets you better prepared and improves your trading. Here are some ideas to explore:
When is the market busy and quiet?
What time is it the most volatile?
Which pairs in your watchlist are moving while you are actively trading?
Should you adjust your trading time? Should you change your trading pairs?
When does your strategy perform the best?
What entry times do your winners have in common? What about the exit times of your losers?
Is it worth keeping your trade open overnight?
Bitcoin (UTC+0)
Gold (UTC+0)
Tesla, Inc. (UTC+0)
█ FEATURES
Selectable time zones
Display the statistics in your geographical time zone (or other market participants), the exchange time zone, or UTC+0.
Configurable outputs
Output the report statistics as mean or median.
█ HOW TO USE
Plot the indicator and visit the 1H timeframe.
█ NOTES
Gaps
The indicator includes the volatility from gaps.
Calculation
The statistics are not reported from absolute prices (does not favor trending markets) nor percentage prices (does not depict the different periods of volatility that markets can go through). Instead, the script uses the prices relative to the average range of previous days (daily ATR).
Extended trading session
The script analyses extended hours when activated on the chart.
Daylight Saving Time (DST)
The exchange time or geographical time zone selected may observe Daylight Saving Time. For example, NASDAQ:TSLA always opens at 9:30 AM New York time but may see different opening times in another part of the globe (New York time corresponds to UTC-4 and UTC-5 during the year).
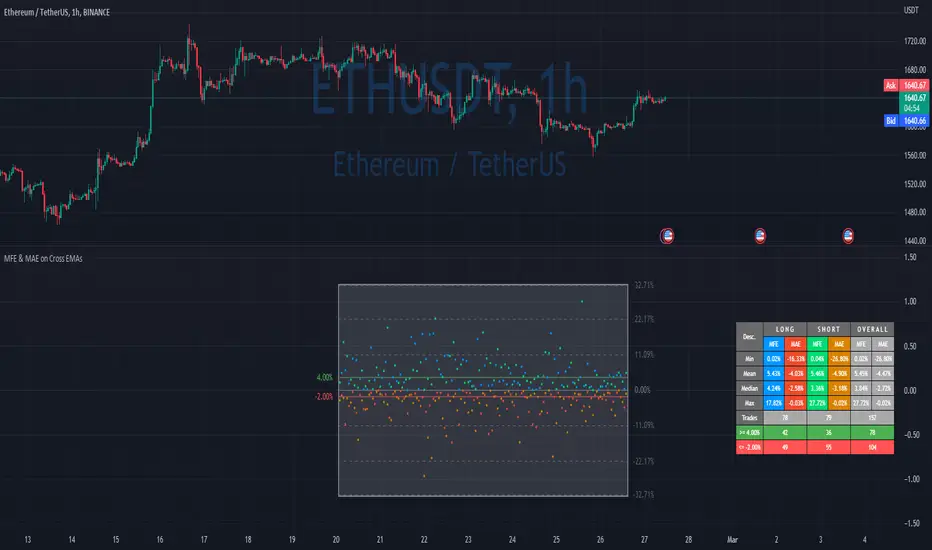
MFE & MAE ToolThis is a simple implementation of the MFE/MAE Tool for TradingView.
It's a quite powerful tool and pretty useful in systematic trading, but I don't see many trader using it these days.
It's created for EMA cross, but you can easily change it to use your own signals.
What is MAE/MFE Tool
MAE stands for Maximum Adverse Excursion - Worst P&L during the trade
MFE stands for Maximum Favorable Excursion - Best P&L during the trade
The idea is pretty simple. We take only signals without any position management or exits and measure the best/worst P&L for the next X bars after the signal was.
The primary use case for it is to understand how good your signals are .
If you'll add complicated money management tools, exits, and SL/PT to your strategy, it brings quite a lot of noise. After that, it's pretty tricky to understand if your signals bring much information about future price movements. In other words, bad money management can ruin good signals, and you might discard the entire strategy without knowing that. So this is why I think it's important to check the quality of your signals separately.
Another simple way to use it is to estimate where to put SL/PT
In this example, we're computing MAE/MFE in percent. We're plotting it both on the chart and computing some statistics based on it. This is why it's pretty easy to get a quick understanding of what is your SL/PT should be.
MAE/MFE tool consists of a:
Chart - it displays a point for every signal. Long/Short trades can have different colors. On hover you'll see details for this signal.
Table with stats - we're computing basic metrics for these Signals like average/min/median/max MAE/MFE, number of trades, and how many trades hit selected SL and PT. Stats are also separated by the side so you can see performance separately for longs and shorts.
The indicator is highly customizable, you can configure:
Bars you want to use to compute MAE/MFE
Side selection
SL and R:R
Styling of the chart
Position and style of the table
Parameters for the EMA
EMA cross and its parameter were selected randomly, so don't estimate to see a great performance here.
MFE/MAE tool is a pretty powerful concept. At some point, I'll create an entire article in my blog with more examples and descriptions.
Thanks to @MUQWISHI for helping code it.
Disclaimer
Please remember that past performance may not indicate future results.
Due to various factors, including changing market conditions, the strategy may no longer perform as well as in historical backtesting.
This post and the script don’t provide any financial advice.
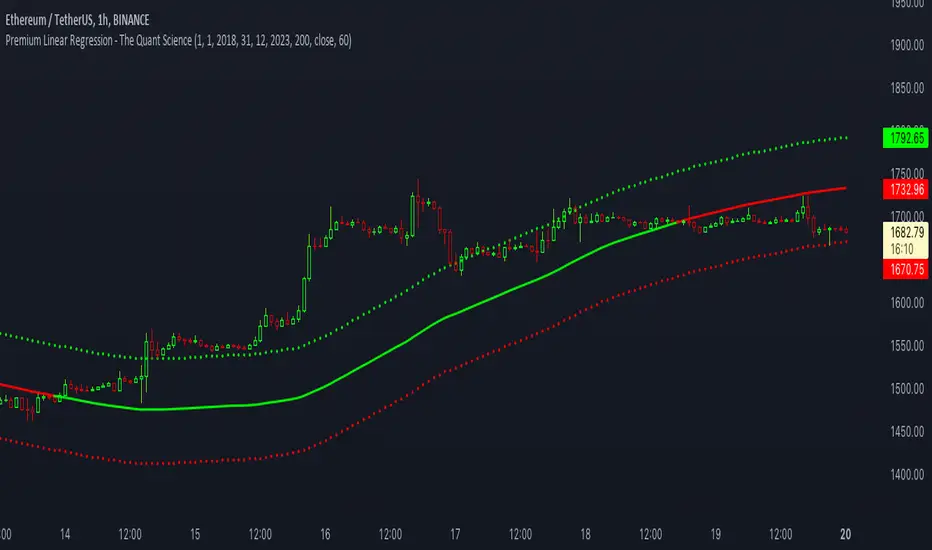
Premium Linear Regression - The Quant ScienceThis script calculates the average deviation of the source data from the linear regression. When used with the indicator, it can plot the data line and display various pieces of information, including the maximum average dispersion around the linear regression.
The code includes various user configurations, allowing for the specification of the start and end dates of the period for which to calculate linear regression, the length of the period to use for the calculation, and the data source to use.
The indicator is designed for multi-timeframe use and to facilitate analysis for traders who use regression models in their analysis. It displays a green linear regression line when the price is above the line and a red line when the price is below. The indicator also highlights areas of dispersion around the regression using circles, with bullish areas shown in green and bearish areas shown in red.
Quantitative Price Forecasting - The Quant ScienceThis script is a quantitative price forecasting indicator that forecasts price changes for a given asset.
The model aims to forecast future prices by analyzing past data within a selected time period. Mathematical probability is used to calculate whether starting from time X can lead to reaching prices Y1 and Y2. In this context, X represents the current selected time period, Y1 represents the selected percentage decrease, and Y2 represents the selected percentage increase. The probabilities are estimated using the simple average.
The simple average is displayed on the chart, showing in red the periods where the price is below the average and in green the periods where the price is above the average.
This powerful tool not only provides forecasts of future prices but also calculates the distribution of variations around the average. It then takes this information and creates an estimate of the average price variation around the simple average.
Using a mean-reverting logic, buying and selling opportunities are highlighted.
We recommend turning off the display of bars on your chart for a better experience when using this indicator.
Unlock the full potential of your trading strategy with our powerful indicator. By analyzing past price data, it provides accurate forecasts and calculates the probability of reaching specific price targets. Its mean-reverting logic highlights buying and selling opportunities, while the simple moving average displayed on the chart shows periods where the price is above or below the average. Additionally, it estimates the average variation of price around the simple average, giving you valuable insights into price movements. Don't miss out on this valuable tool that can take your trading to the next level

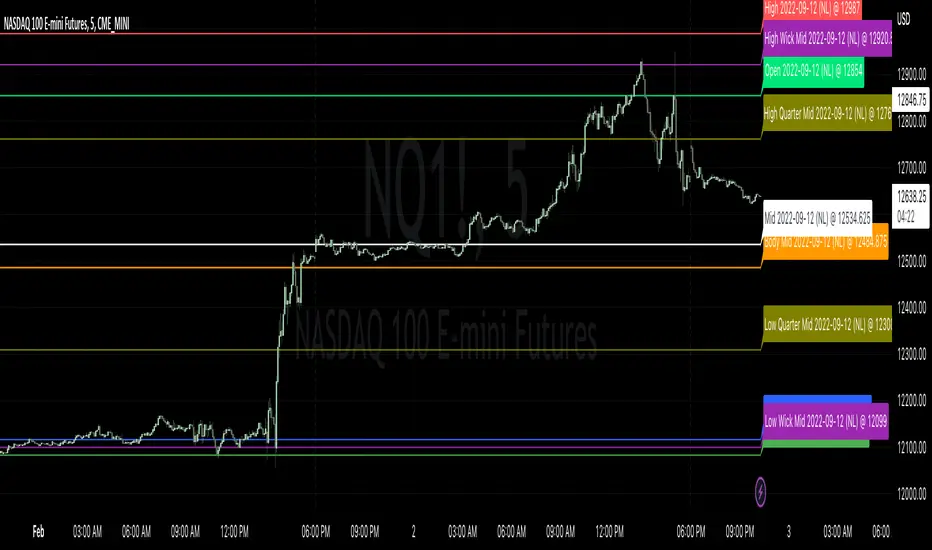
Candle LevelsCandle Levels
Allows chart levels to be plotted automatically, simply add tool to chart and the interactive mode will prompt for candle selection, timeframe anchor and some label choices such as displaying time, price or disabling labels altogether.
Also a note can be supplied that will be shown in the labels if they're displayed, if not it'll be up in the indicator values if those are enabled. Colors and individual labels can be customized, encourage saving over defaults for repeated usage.
Levels calculated:
Standard OHLC
Close to open mid point
High to low mid point
High wick mid point (either between close or open, whichever is higher)
Low wick mid point (either between close or open, whichever is lower)
I have plans to better detected levels and labels overlap to perhaps do something with that, for now manually toggling display of label should suffice.
I've tested with various markets such as futures, standard stock markets and also various higher and lower timeframes, if something is found to not be working please let me know.
Enjoy!
Signal ViewerThe "Signal Viewer" script is a debugging tool that can be used for the signal of a Signal Indicator script like the "Two MA Signal Indicator" or the "Template Signal Indicator". This script will visualize the signal based on the convention that was defined in the settings. Also, alerts will be produced based on this convention. It's useful to be used before you connect the signal indicator script to a template strategy like the "Template Trailing Strategy" script. You can cross-validate the correctness of the signal that the indicators emit and make sure it is aligned with the expected behavior after the decomposition of the signal using the convention described in the settings. Please make sure that the connection in the "Signal Viewer" script matches the convention used by the template strategy script.

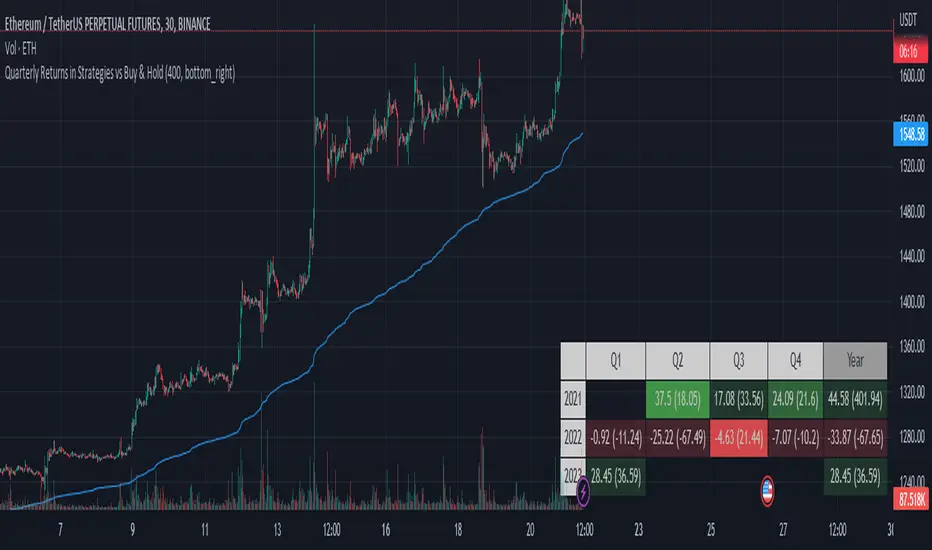
Quarterly Returns in Strategies vs Buy & HoldThis is a Quarterly Returns version of Monthly Returns in PineScript Strategies by QuantNomad
This script shows a table of Quarterly/Yearly performance of your strategy.
It also provides an option to compare with Buy & Hold.
The script can easily integrated to your strategy. All you need to do is copy the table part and paste it at the end of your script
Disclaimer
Please remember that past performance may not be indicative of future results.
This post and the script don’t provide any financial advice.
Probabilities Module - The Quant Science This module can be integrate in your code strategy or indicator and will help you to calculate the percentage probability on specific event inside your strategy. The main goal is improve and simplify the workflow if you are trying to build a quantitative strategy or indicator based on statistics or reinforcement model.
Logic
The script made a simulation inside your code based on a single event. For single event mean a trading logic composed by three different objects: entry, take profit, stop loss.
The script scrape in the past through a look back function and return the positive percentage probability about the positive event inside the data sample. In this way you are able to understand and calculate how many time (in percentage term) the conditions inside the single event are positive, helping to create your statistical edge.
You can adjust the look back period in you user interface.
How can set up the module for your use case
At the top of the script you can find:
1. entry_condition : replace the default condition with your specific entry condition.
2. TPcondition_exit : replace the default condition with your specific take profit condition.
3. SLcondition_exit : replace the default condition with your specific stop loss condition.

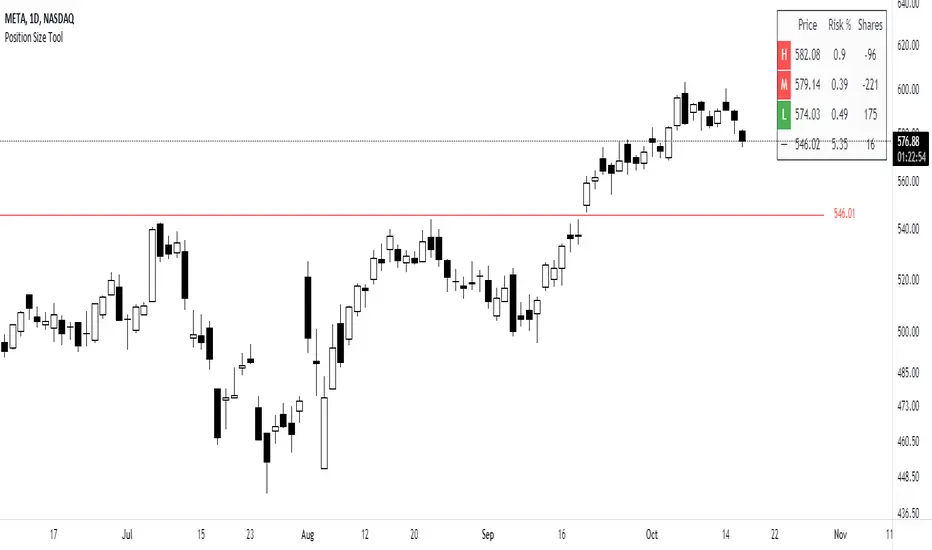
Position Size ToolUpdated - Version 2
This tool is used to calculate the size of a trade.
Settings - Type in total account size and % of capital that can be risked on each trade.
The table will display:
Column 1 - Stop placement based on low, mid or high value of the current candle.
Column 2 - Percent risk on the trade.
Column 3 - Amount of shares that can be traded (calculated from account size, risk and selected stop placement).
Green color is intended for long position, stop at the low of the candle.
Red color is intended for short position, stop at the high of the candle.
Middle value can shift between either color since its measured from open to close.
[Mad] Active LineThis is a simple line tool that can give you active feedback based on the closing price.
It is intended for a live chart whose ticker is not changed by the user every 10 minutes, like a general overview of an asset in a higher time frame.
What can it provide:
Price difference from the price to the line
Price at the current collision point
How to use it:
When opened, it requests 2 input points from you.
After you set these 2 points, it will set the "Active Line" for you, like the normal TV line.
One thing to know is that you can't place into the future, so "extend" is always on by default.
and as always, have fun trading the assets up and down :-)

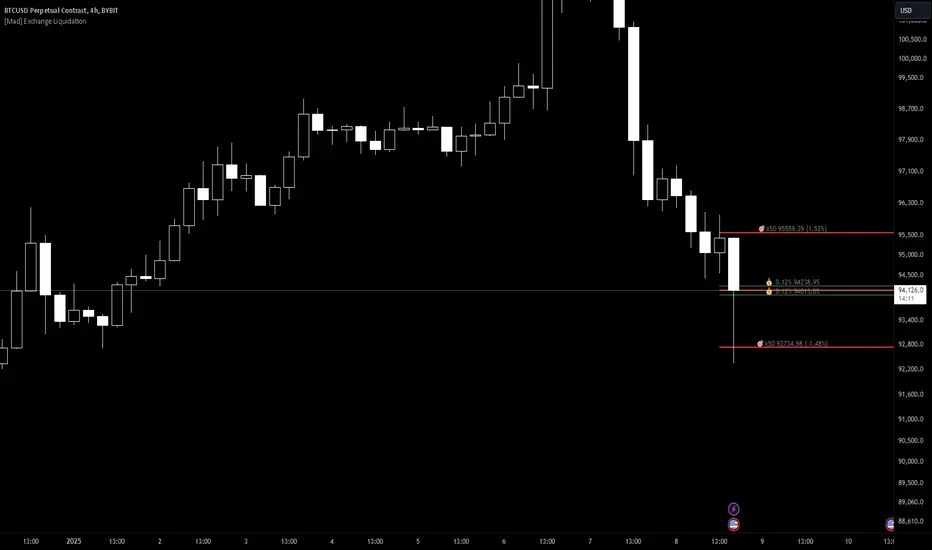
[Mad] Exchange liquidationThis is just a basic tool to calculate liquidation based on:
margin-maintenance
leverage
it starts drawing on your input point short and long liquidation, so you can easily place it on your trade and drag it around if you are rebuying as an example.
Also, you can use it to aim for a specific support/resistance to see if it is even possible to reach some levels, which leverage you can use...
It additionally delivers live data based on the actual close to the 2 liquidation points
have fun
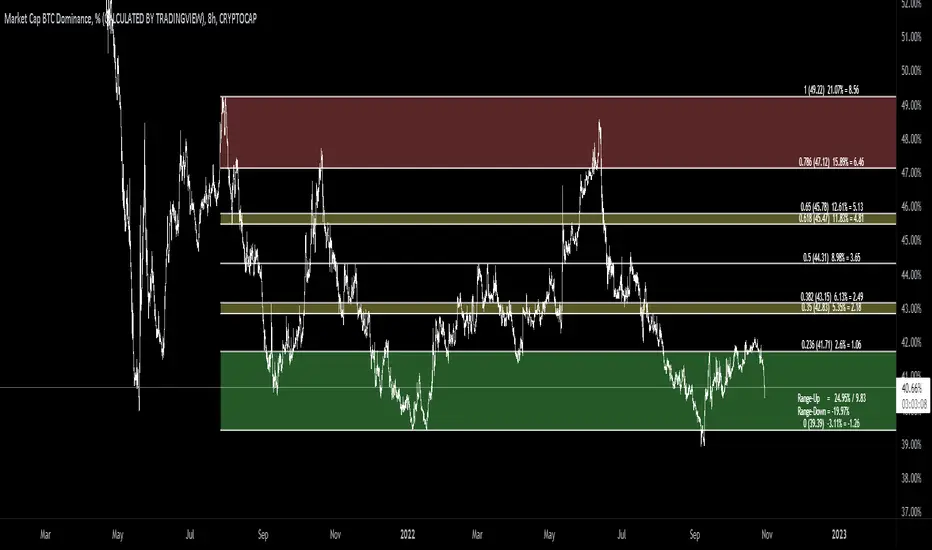
[MAD] Fibonacci retracementThis is just a Fibonacci Retracement tool with some interactive information based on the actual closing price
How to use:
add the script,
input left bottom with the 1st click,
input top with the 2nd click
Informations you can see than:
Fiblevel (Price) %till_this_point = pricedifference
additional:
Bottom of the fib
Range Up in % + Price-Range
Range Down in %
you can shift the comma with the decimal functions for trading shitcoins as example
if looking into the past, level/price will follow, liveinfo using the close is than hidden
what will follow:
reverse
log/linear
autogrow when range will be wicked
maybe alerts on levels... have to think about how to capture correctly
columnsLibrary "columns"
Error Tolerant Matrix Setter/Getter Operations. Easy ways to add/remove items into start and end of Columns as well as arrays to grow and shrink matrix.
if mismatched sizes occur the typified NA value will be there to prevent catastrophic crashing.
Rows and Columns are split into 2 libraries due to limitations on number of exports as well as ease of style (columns.shift(), rows.pop() )
pop(_matrix)
do pop last Column off of matrix
Parameters:
_matrix : Matrix To Edit
Returns: Array of Last Column, removing it from matrix
shift(_matrix)
do shift the first Column off of matrix
Parameters:
_matrix : Matrix To Edit
Returns: Array of First Column, removing it from matrix
get(_matrix, _clmnNum)
retrieve specific Column of matrix
Parameters:
_matrix : Matrix To Edit
_clmnNum : Column being Targeted
Returns: Array of selected Column number, leaving in place
push(_matrix, _clmnNum, _item)
add single item onto end of Column
Parameters:
_matrix : Matrix To Edit
_clmnNum : Column being Targeted
_item : Item to Push on Column
Returns: shifted item from Column start
push(_matrix, _array)
add single item onto end of matrix
Parameters:
_matrix : Matrix To Edit
_array : Array to Push on Matrix
Returns: Void
unshift(_matrix, _clmnNum, _item)
slide single item into start of Column remove last
Parameters:
_matrix : Matrix To Edit
_clmnNum : Column being Targeted
_item : Item to Unshift on Column
Returns: popped item from Column end
unshift(_matrix, _array)
add single item into first Column of matrix
Parameters:
_matrix : Matrix To Edit
_array : Array to unshift into Matrix
Returns: Void
set(_matrix, _clmnNum, _array)
replace an array to an existing Column
Parameters:
_matrix : Matrix To Edit
_clmnNum : Column being Targeted
_array : Array to place in Matrix
Returns: Column that was replaced
insert(_matrix, _clmnNum, _array)
insert an array to a new Column
Parameters:
_matrix : Matrix To Edit
_clmnNum : Column being Targeted
_array : Array to place in Matrix
Returns: void
slideDown(_matrix, _array)
add single item onto end of Column
Parameters:
_matrix : Matrix To Edit
_array : Array to push to Matrix
Returns: shifted first Column
slideUp(_matrix, _array)
add single item onto end of Column
Parameters:
_matrix : Matrix To Edit
_array : Array to unshift to Matrix
Returns: poppeed last Column
pullOut(_matrix, _clmnNum)
add single item onto end of Column
Parameters:
_matrix : Matrix To Edit
_clmnNum : Column being Targeted
Returns: removed selected Column

rowsLibrary "rows"
Error Tolerant Matrix Setter/Getter Operations. Easy ways to add/remove items into start and end of rows as well as arrays to grow and shrink matrix.
if mismatched sizes occur the typified NA value will be there to prevent catastrophic crashing.
columns and rows are split into 2 libraries due to limitations on number of exports as well as ease of style (columns.shift(), rows.pop() )
pop(_matrix)
do pop last row off of matrix
Parameters:
_matrix : Matrix To Edit
Returns: Array of Last row, removing it from matrix
shift(_matrix)
do shift the first row off of matrix
Parameters:
_matrix : Matrix To Edit
Returns: Array of First row, removing it from matrix
get(_matrix, _rowNum)
retrieve specific row of matrix
Parameters:
_matrix : Matrix To Edit
_rowNum : Row being Targeted
Returns: Array of selected row number, leaving in place
push(_matrix, _rowNum, _item)
add single item onto end of row
Parameters:
_matrix : Matrix To Edit
_rowNum : Row being Targeted
_item : Item to Push on Row
Returns: shifted item from row start
push(_matrix, _array)
add single item onto end of matrix
Parameters:
_matrix : Matrix To Edit
_array : Array to Push on Matrix
Returns: Void
unshift(_matrix, _rowNum, _item)
slide single item into start of row remove last
Parameters:
_matrix : Matrix To Edit
_rowNum : Row being Targeted
_item : Item to Unshift on Row
Returns: popped item from row end
unshift(_matrix, _array)
add single item into first row of matrix
Parameters:
_matrix : Matrix To Edit
_array : Array to unshift into Matrix
Returns: Void
set(_matrix, _rowNum, _array)
replace an array to an existing row
Parameters:
_matrix : Matrix To Edit
_rowNum : Row being Targeted
_array : Array to place in Matrix
Returns: row that was replaced
insert(_matrix, _rowNum, _array)
insert an array to a new row
Parameters:
_matrix : Matrix To Edit
_rowNum : Row being Targeted
_array : Array to place in Matrix
Returns: void
slideDown(_matrix, _array)
add single item onto end of row
Parameters:
_matrix : Matrix To Edit
_array : Array to push to Matrix
Returns: shifted first row
slideUp(_matrix, _array)
add single item onto end of row
Parameters:
_matrix : Matrix To Edit
_array : Array to unshift to Matrix
Returns: popped last row
pullOut(_matrix, _rowNum)
add single item onto end of row
Parameters:
_matrix : Matrix To Edit
_rowNum : Row being Targeted
Returns: removed selected row
NNFX Exposure UtilityOVERVIEW
This tool allows the user to manually keep track of how much of their account is currently exposed to each currency, and keep that information handy and organized on the chart as a table.
It is specialized for NNFX traders who are trading all the pairs among the 9 major currency crosses: AUD, CAD, CHF, EUR, GBP, JPY, NZD, SGD, USD.
HOW DO I USE THIS INDICATOR?
Before you take a trade, you should open the indicator settings for this indicator and check off which currencies you are about to go long and short on. Here are 3 trades taken as examples:
If you go long on EUR/USD with 2% risk, your exposure is 2% long on EUR and 2% short on USD.
Then if you go short on GBP/SGD with 2% risk, your exposure is 2% short on GBP and 2% long on SGD.
But if you go long on SGD/JPY with 2% risk, your exposure would now be 4% long on SGD and 2% short on JPY. This is against your rules if you are trading the NNFX way. So this tool allows you to see when you are about to accidentally overexpose yourself to any currency pair.

VolatilityVolatility - The amount of price deviation in the specified time interval.
The calculation is made from the opening point to the closing point, and the maximum and minimum deviation between them is also included. Any timeframes are supported.
Available information: the start date of the calculation (according to the time zone of the exchange), the current volatility from the initial opening point or from the last closing point, the total volatility for all periods.
An indicator of useful use in everyday work.
Thanks for your attention!

catchChecksLibrary "catchChecks"
Type Check for Function Builders to allow Single item to be
passed in, and determine what to do with the item, ie: need an x value?
function that allows label, line, box, float, or even a string..
check item type? string ? 'str.tonumber(_item)' can be in the same
switch as a 'line.get_price(_item, bar_index)' both outputting float
or for pulling a value from simple, array, or matrix, one function
that can switch between them. reduce overhead of many functions.
there are many ways to use this tool, the simplest may be
string/floats on one switch or grabbing colors from line/fill/label
please Share any great recipes you come up with!
typeIs(_temp, _doMeth)
Input anything..
Determine what it is.
Parameters:
_temp : (any) Matrix, Array, or Simple Item
_doMeth : (bool) True for M/A/S , false for int/float/string.. etc..
Returns: (string) Type of item checked. ('bool' .. or 'array'.. etc..)