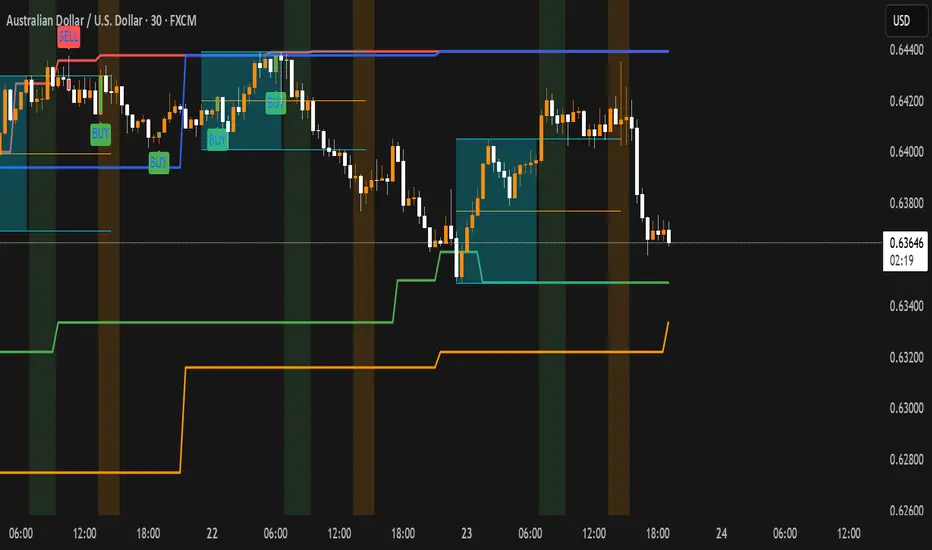
Negroni Opening Range StrategyStrategy Summary:
This tool can be used to help identify breakouts from a range during a time-zone of your choosing. It plots a pre-market range, an opening range, it also includes moving average levels that can be used as confluence, as well as plotting previous day SESSION highs and lows.
There are several options on how you wish to close out the trades, all described in more detail below.
Back-testing Inputs:
You define your timezone.
You define how many trades to open on any given day.
You decide to go: long only, short only, or long & short (CAREFUL: "Long & Short" can open trades that effectively closes-out existing ones, for better AND worse!)
You define between which times the strategy will open trades.
You define when it closes any open trades (preventing overnight trades, or leaving trades open into US data times!!).
This hopefully helps make back-testing reflect YOUR trading hours.
NOTE: Renko or Heikin-Ashi charts
For ALL strategies, don’t use Renko or Heikin-Ashi charts unless you know EXACTLY the implications.
Specific to my strategy, using a renko chart can make this 85-90% profitable (I wish it was!!) Although they can be useful, renko charts don’t always capture real wicks, so the renko chart may show your trade up-only but your broker (who is not using renko!!) will have likely stopped you out on a wick somewhere along the line.
NOTE: TradingView ‘Deep backtesting’
For ALL strategies, be cynical of all backtesting (e.g. repainting issues etc) as well as ‘Deep backtesting’ results.
Specific to this strategy, the default settings here SHOULD BE OK, but unfortunately at the time of writing, we can’t see on the chart what exactly ‘deep backtesting’ is calculating. In the past I have noted a number of trades that were not closed at the end of the day, despite my ‘end of day’ trade closing being enabled, so there were big winners and losers that would not have materialized otherwise. As I say, this seems ok at these settings but just always be cynical!!
Opening Range Inputs
You define a pre-market range (example: 08:00 - 09:00).
You define an opening range (example: 09:00 - 09:30).
The strategy will give an update at the close of the opening range to let you know if the opening range has broken out the pre-market range (OR Breakout), or if it has remained inside (OR Inside). The label appears at the end of the opening range NOT at the bar that ‘broke-out’.
This is just a visual cue for you, it has no bearing on what the strategy will do.
The strategy default will trade off the pre-market range, but you can untick this if you prefer to trade off the opening range.
Opening Trades:
Strategy goes long when the bar (CLOSE) crosses-over the ‘pre-market’ high (not the ‘opening range’ high); and the time is within your trading session, and you have not maxed out your number of trades for the day!
Strategy goes short when the bar (CLOSE) crosses-under the ‘pre-market’ low (not the ‘opening range low); and the time is within your trading session, and you have not maxed out your number of trades for the day!
Remember, you can untick this if you prefer to trade off the opening range instead.
NOTES:
Using momentum indicators can help (RSI and MACD): especially to trade range plays in failed breakouts, when momentum shifts… but the strategy won’t do this for you!
Using an anchored vwap at the session open can also provide nice confluence, as well as take-profit levels at the upper/lower of 3x standard deviation.
CLOSING TRADES:
You have 6 take-profit (TP) options:
1) Full TP: uses ATR Multiplier - Full TP at the ATR parameters as defined in inputs.
2) Take Partial profits: ATR Multiplier - Takes partial profits based on parameters as defined in inputs (i.e close 40% of original trade at TP1, close another 40% of original trade at TP2, then the remainder at Full TP as set in option 1.).
3) Full TP: Trailing Stop - Applies a Trailing Stop at the number of points, as defined in inputs.
4) Full TP: MA cross - Takes profit when price crosses ‘Trend MA’ as defined in inputs.
5) Scalp: Points - closes at a set number of points, as defined in inputs.
6) Full TP: PMKT Multiplier - places a SL at opposite pre-market Hi/Low (we go long at a break-out of the pre-market high, 50% would place a SL at the pre-market range mid-point; 100% would place a SL at the pre-market low)'. This takes profit at the input set in option 1).
在腳本中搜尋"breakout"
Bollinger Band + Mid BandBollinger Band + Mid Band
This indicator combines the classic Bollinger Bands with enhanced customization options, allowing traders to fine-tune the settings according to their specific strategies.
Key Features:
Moving Average Flexibility: Choose between Simple Moving Average (SMA), Exponential Moving Average (EMA), or Weighted Moving Average (WMA) as the central basis for the Bollinger Bands. This flexibility allows you to align the indicator with your preferred method of trend analysis.
Dual Band Deviation: The indicator includes two sets of upper and lower bands based on different standard deviation multipliers. This helps you analyze both the tightness of price action and potential breakout zones.
Customizable Colors: The mid-band, upper bands, and lower bands can be fully customized in terms of color, allowing you to personalize the visual representation of the indicator on your charts.
Dynamic Transparency: The space between the outer Bollinger Bands can be filled with a customizable transparent color, making it easy to visualize price movements within the bands.
Alerts for Crossovers: Alerts are triggered whenever the price crosses above the upper band or below the lower band, giving you timely notifications of potential breakout or breakdown scenarios.
Overbought/Oversold Visualization: The background of the chart changes color when the price crosses above the upper band (indicating overbought conditions) or below the lower band (indicating oversold conditions), providing a visual cue to help you identify market extremes.
Labeling for Significant Events: Labels appear on the chart whenever the price crosses the upper or lower bands, helping you quickly identify key moments for further analysis.
This script is designed for traders who want to leverage Bollinger Bands in their technical analysis but require additional flexibility and customization options. Whether you're using it for trend analysis, volatility assessment, or identifying overbought and oversold conditions, this tool can be tailored to fit a wide variety of trading styles.
Usage:
Ideal for traders looking to enhance the standard Bollinger Bands with more dynamic and customizable features.
Suitable for any market, including stocks, forex, and cryptocurrencies.
Useful in identifying volatility squeezes, breakouts, and potential reversal points.
Multiple Naked LevelsPURPOSE OF THE INDICATOR
This indicator autogenerates and displays naked levels and gaps of multiple types collected into one simple and easy to use indicator.
VALUE PROPOSITION OF THE INDICATOR AND HOW IT IS ORIGINAL AND USEFUL
1) CONVENIENCE : The purpose of this indicator is to offer traders with one coherent and robust indicator providing useful, valuable, and often used levels - in one place.
2) CLUSTERS OF CONFLUENCES : With this indicator it is easy to identify levels and zones on the chart with multiple confluences increasing the likelihood of a potential reversal zone.
THE TYPES OF LEVELS AND GAPS INCLUDED IN THE INDICATOR
The types of levels include the following:
1) PIVOT levels (Daily/Weekly/Monthly) depicted in the chart as: dnPIV, wnPIV, mnPIV.
2) POC (Point of Control) levels (Daily/Weekly/Monthly) depicted in the chart as: dnPoC, wnPoC, mnPoC.
3) VAH/VAL STD 1 levels (Value Area High/Low with 1 std) (Daily/Weekly/Monthly) depicted in the chart as: dnVAH1/dnVAL1, wnVAH1/wnVAL1, mnVAH1/mnVAL1
4) VAH/VAL STD 2 levels (Value Area High/Low with 2 std) (Daily/Weekly/Monthly) depicted in the chart as: dnVAH2/dnVAL2, wnVAH2/wnVAL2, mnVAH1/mnVAL2
5) FAIR VALUE GAPS (Daily/Weekly/Monthly) depicted in the chart as: dnFVG, wnFVG, mnFVG.
6) CME GAPS (Daily) depicted in the chart as: dnCME.
7) EQUILIBRIUM levels (Daily/Weekly/Monthly) depicted in the chart as dnEQ, wnEQ, mnEQ.
HOW-TO ACTIVATE LEVEL TYPES AND TIMEFRAMES AND HOW-TO USE THE INDICATOR
You can simply choose which of the levels to be activated and displayed by clicking on the desired radio button in the settings menu.
You can locate the settings menu by clicking into the Object Tree window, left-click on the Multiple Naked Levels and select Settings.
You will then get a menu of different level types and timeframes. Click the checkboxes for the level types and timeframes that you want to display on the chart.
You can then go into the chart and check out which naked levels that have appeared. You can then use those levels as part of your technical analysis.
The levels displayed on the chart can serve as additional confluences or as part of your overall technical analysis and indicators.
In order to back-test the impact of the different naked levels you can also enable tapped levels to be depicted on the chart. Do this by toggling the 'Show tapped levels' checkbox.
Keep in mind however that Trading View can not shom more than 500 lines and text boxes so the indocator will not be able to give you the complete history back to the start for long duration assets.
In order to clean up the charts a little bit there are two additional settings that can be used in the Settings menu:
- Selecting the price range (%) from the current price to be included in the chart. The default is 25%. That means that all levels below or above 20% will not be displayed. You can set this level yourself from 0 up to 100%.
- Selecting the minimum gap size to include on the chart. The default is 1%. That means that all gaps/ranges below 1% in price difference will not be displayed on the chart. You can set the minimum gap size yourself.
BASIC DESCRIPTION OF THE INNER WORKINGS OF THE INDICTATOR
The way the indicator works is that it calculates and identifies all levels from the list of levels type and timeframes above. The indicator then adds this level to a list of untapped levels.
Then for each bar after, it checks if the level has been tapped. If the level has been tapped or a gap/range completely filled, this level is removed from the list so that the levels displayed in the end are only naked/untapped levels.
Below is a descrition of each of the level types and how it is caluclated (algorithm):
PIVOT
Daily, Weekly and Monthly levels in trading refer to significant price points that traders monitor within the context of a single trading day. These levels can provide insights into market behavior and help traders make informed decisions regarding entry and exit points.
Traders often use D/W/M levels to set entry and exit points for trades. For example, entering long positions near support (daily close) or selling near resistance (daily close).
Daily levels are used to set stop-loss orders. Placing stops just below the daily close for long positions or above the daily close for short positions can help manage risk.
The relationship between price movement and daily levels provides insights into market sentiment. For instance, if the price fails to break above the daily high, it may signify bearish sentiment, while a strong breakout can indicate bullish sentiment.
The way these levels are calculated in this indicator is based on finding pivots in the chart on D/W/M timeframe. The level is then set to previous D/W/M close = current D/W/M open.
In addition, when price is going up previous D/W/M open must be smaller than previous D/W/M close and current D/W/M close must be smaller than the current D/W/M open. When price is going down the opposite.
POINT OF CONTROL
The Point of Control (POC) is a key concept in volume profile analysis, which is commonly used in trading.
It represents the price level at which the highest volume of trading occurred during a specific period.
The POC is derived from the volume traded at various price levels over a defined time frame. In this indicator the timeframes are Daily, Weekly, and Montly.
It identifies the price level where the most trades took place, indicating strong interest and activity from traders at that price.
The POC often acts as a significant support or resistance level. If the price approaches the POC from above, it may act as a support level, while if approached from below, it can serve as a resistance level. Traders monitor the POC to gauge potential reversals or breakouts.
The way the POC is calculated in this indicator is by an approximation by analysing intrabars for the respective timeperiod (D/W/M), assigning the volume for each intrabar into the price-bins that the intrabar covers and finally identifying the bin with the highest aggregated volume.
The POC is the price in the middle of this bin.
The indicator uses a sample space for intrabars on the Daily timeframe of 15 minutes, 35 minutes for the Weekly timeframe, and 140 minutes for the Monthly timeframe.
The indicator has predefined the size of the bins to 0.2% of the price at the range low. That implies that the precision of the calulated POC og VAH/VAL is within 0.2%.
This reduction of precision is a tradeoff for performance and speed of the indicator.
This also implies that the bigger the difference from range high prices to range low prices the more bins the algorithm will iterate over. This is typically the case when calculating the monthly volume profile levels and especially high volatility assets such as alt coins.
Sometimes the number of iterations becomes too big for Trading View to handle. In these cases the bin size will be increased even more to reduce the number of iterations.
In such cases the bin size might increase by a factor of 2-3 decreasing the accuracy of the Volume Profile levels.
Anyway, since these Volume Profile levels are approximations and since precision is traded for performance the user should consider the Volume profile levels(POC, VAH, VAL) as zones rather than pin point accurate levels.
VALUE AREA HIGH/LOW STD1/STD2
The Value Area High (VAH) and Value Area Low (VAL) are important concepts in volume profile analysis, helping traders understand price levels where the majority of trading activity occurs for a given period.
The Value Area High/Low is the upper/lower boundary of the value area, representing the highest price level at which a certain percentage of the total trading volume occurred within a specified period.
The VAH/VAL indicates the price point above/below which the majority of trading activity is considered less valuable. It can serve as a potential resistance/support level, as prices above/below this level may experience selling/buying pressure from traders who view the price as overvalued/undervalued
In this indicator the timeframes are Daily, Weekly, and Monthly. This indicator provides two boundaries that can be selected in the menu.
The first boundary is 70% of the total volume (=1 standard deviation from mean). The second boundary is 95% of the total volume (=2 standard deviation from mean).
The way VAH/VAL is calculated is based on the same algorithm as for the POC.
However instead of identifying the bin with the highest volume, we start from range low and sum up the volume for each bin until the aggregated volume = 30%/70% for VAL1/VAH1 and aggregated volume = 5%/95% for VAL2/VAH2.
Then we simply set the VAL/VAH equal to the low of the respective bin.
FAIR VALUE GAPS
Fair Value Gaps (FVG) is a concept primarily used in technical analysis and price action trading, particularly within the context of futures and forex markets. They refer to areas on a price chart where there is a noticeable lack of trading activity, often highlighted by a significant price movement away from a previous level without trading occurring in between.
FVGs represent price levels where the market has moved significantly without any meaningful trading occurring. This can be seen as a "gap" on the price chart, where the price jumps from one level to another, often due to a rapid market reaction to news, events, or other factors.
These gaps typically appear when prices rise or fall quickly, creating a space on the chart where no transactions have taken place. For example, if a stock opens sharply higher and there are no trades at the prices in between the two levels, it creates a gap. The areas within these gaps can be areas of liquidity that the market may return to “fill” later on.
FVGs highlight inefficiencies in pricing and can indicate areas where the market may correct itself. When the market moves rapidly, it may leave behind price levels that traders eventually revisit to establish fair value.
Traders often watch for these gaps as potential reversal or continuation points. Many traders believe that price will eventually “fill” the gap, meaning it will return to those price levels, providing potential entry or exit points.
This indicator calculate FVGs on three different timeframes, Daily, Weekly and Montly.
In this indicator the FVGs are identified by looking for a three-candle pattern on a chart, signalling a discrete imbalance in order volume that prompts a quick price adjustment. These gaps reflect moments where the market sentiment strongly leans towards buying or selling yet lacks the opposite orders to maintain price stability.
The indicator sets the gap to the difference from the high of the first bar to the low of the third bar when price is moving up or from the low of the first bar to the high of the third bar when price is moving down.
CME GAPS (BTC only)
CME gaps refer to price discrepancies that can occur in charts for futures contracts traded on the Chicago Mercantile Exchange (CME). These gaps typically arise from the fact that many futures markets, including those on the CME, operate nearly 24 hours a day but may have significant price movements during periods when the market is closed.
CME gaps occur when there is a difference between the closing price of a futures contract on one trading day and the opening price on the following trading day. This difference can create a "gap" on the price chart.
Opening Gaps: These usually happen when the market opens significantly higher or lower than the previous day's close, often influenced by news, economic data releases, or other market events occurring during non-trading hours.
Gaps can result from reactions to major announcements or developments, such as earnings reports, geopolitical events, or changes in economic indicators, leading to rapid price movements.
The importance of CME Gaps in Trading is the potential for Filling Gaps: Many traders believe that prices often "fill" gaps, meaning that prices may return to the gap area to establish fair value.
This can create potential trading opportunities based on the expectation of gap filling. Gaps can act as significant support or resistance levels. Traders monitor these levels to identify potential reversal points in price action.
The way the gap is identified in this indicator is by checking if current open is higher than previous bar close when price is moving up or if current open is lower than previous day close when price is moving down.
EQUILIBRIUM
Equilibrium in finance and trading refers to a state where supply and demand in a market balance each other, resulting in stable prices. It is a key concept in various economic and trading contexts. Here’s a concise description:
Market Equilibrium occurs when the quantity of a good or service supplied equals the quantity demanded at a specific price level. At this point, there is no inherent pressure for the price to change, as buyers and sellers are in agreement.
Equilibrium Price is the price at which the market is in equilibrium. It reflects the point where the supply curve intersects the demand curve on a graph. At the equilibrium price, the market clears, meaning there are no surplus goods or shortages.
In this indicator the equilibrium level is calculated simply by finding the midpoint of the Daily, Weekly, and Montly candles respectively.
NOTES
1) Performance. The algorithms are quite resource intensive and the time it takes the indicator to calculate all the levels could be 5 seconds or more, depending on the number of bars in the chart and especially if Montly Volume Profile levels are selected (POC, VAH or VAL).
2) Levels displayed vs the selected chart timeframe. On a timeframe smaller than the daily TF - both Daily, Weekly, and Monthly levels will be displayed. On a timeframe bigger than the daily TF but smaller than the weekly TF - the Weekly and Monthly levels will be display but not the Daily levels. On a timeframe bigger than the weekly TF but smaller than the monthly TF - only the Monthly levels will be displayed. Not Daily and Weekly.
CREDITS
The core algorithm for calculating the POC levels is based on the indicator "Naked Intrabar POC" developed by rumpypumpydumpy (https:www.tradingview.com/u/rumpypumpydumpy/).
The "Naked intrabar POC" indicator calculates the POC on the current chart timeframe.
This indicator (Multiple Naked Levels) adds two new features:
1) It calculates the POC on three specific timeframes, the Daily, Weekly, and Monthly timeframes - not only the current chart timeframe.
2) It adds functionaly by calculating the VAL and VAH of the volume profile on the Daily, Weekly, Monthly timeframes .
ADR (Log Scale) with MTF LabelsHere's a detailed presentation of the Average Daily Range (ADR) indicator, with a focus on its advantages compared to the classic ADR, its unique features, utility, and interpretation:
Advantages Compared to Classic ADR
1. Logarithmic Scale: Unlike the classic ADR, which uses a linear scale, this version uses a logarithmic scale for calculations. This approach provides a more accurate representation of relative price movements, especially for assets with large price ranges.
2. Multi-Timeframe Analysis: This enhanced ADR indicator allows traders to view daily, weekly, and monthly ADRs simultaneously. This multi-timeframe capability helps traders understand volatility trends over different periods, offering a more comprehensive market analysis.
3. Optional Smoothing: The inclusion of an optional smoothing feature (using Exponential Moving Average, EMA) helps reduce noise in the data. This makes the indicator more reliable by filtering out short-term fluctuations and highlighting the underlying volatility trend.
4. Information Display Labels: The indicator includes labels that display precise ADR values for each timeframe directly on the chart. This feature provides immediate, clear insights without requiring additional calculations or references.
Utility of the Indicator
1. Volatility Analysis: The ADR indicator is essential for assessing market volatility. By showing the average daily price range, it helps traders gauge how much an asset typically moves within a day, week, or month.
2. Risk Management: ADR levels can be used to set stop-loss points, improving risk management strategies. Knowing the average range helps traders avoid setting stops too close to the current price, which might otherwise be triggered by normal market fluctuations.
3. Setting Realistic Targets: By understanding the average daily range, traders can set more realistic profit targets. This helps in avoiding over-ambitious goals that are unlikely to be reached within the typical market movement.
4. Identifying Entry and Exit Points: The ADR can signal potential entry and exit points. For example, if the price approaches the upper or lower ADR boundary, it might indicate an overbought or oversold condition, respectively.
Interpretation and Examples
1. Increasing Volatility: If the ADR is increasing, it indicates rising market volatility. Traders might adjust their strategies accordingly, such as widening their stop-losses to accommodate larger price swings.
2. Range Breakout: If the price significantly exceeds the daily ADR, it may signal a strong trend or exceptional market movement. Traders can use this information to stay in the trade longer or to anticipate a potential reversal.
3. Mean Reversion: Prices often revert to the ADR mean. A trader might consider mean reversion trades when the price approaches the extremes of the ADR range, expecting it to move back towards the average.
4. Multi-Timeframe Comparison: If the daily ADR is higher than the weekly ADR, it may indicate unusually high short-term volatility. This can be a signal for traders to be cautious or to capitalize on the increased movement.
While the ADR indicator provides valuable insights into market volatility and can significantly enhance trading strategies, it is essential to remember that no indicator is foolproof. Market conditions can change rapidly, and past performance is not always indicative of future results. Traders should use the ADR indicator in conjunction with other tools and follow sound risk management practices to protect their capital.
MA DifferenceThe MA Difference indicator shows 3 histograms representing differences in moving averages between a base MA (10) and 3 MA's: short (20), medium (50), and long (200). It also shows an exponentially weighted trend line which can indicate breakout opportunities, has alerts on all base <-> X crossovers, and shows potential consolidation zones where MA differences are below a user-defined tolerance.
The suggested way to use this indicator is to place a trade when the trend line is above the histogram (and filling the space between them). This indicates that the current MA values are significantly above or below the expected range and that prices are in the midst of breaking out. You may also consult the consolidation zones to eliminate false breakouts and momentary changes in trend. You may also consult the various short, medium, and long crossovers and crossunders to time entries and exits accordingly.
Histograms
The 3 histograms represent the differences between:
Base MA (10) and Short MA (20)
Base MA (10) and Medium MA (50)
Base MA (10) and Long MA (200)
All 4 moving average values can be configured in the indicator's settings. Consistency in direction and color of the histogram indicates a consistent trend across the various moving averages.
Trend Line
The trend line is an exponentially weighted average of the 3 moving averages, scaled by a factor configurable in the settings. When using the trend line, shading will be applied to the difference between the extremes of the histogram and the trend line to indicate that the chart is in a "breakout zone" and is beyond the normal, gradual sway of price action.
Crossovers/Crossunders
You may optionally turn on crossovers and crossunders in the indicator's settings to display when a short, medium, or long crossover occurs against the base moving average. Likewise, alerts are available for each crossover and crossunder for each of the 3 moving average convergences.
Consolidation Zones
Consolidation zones, as well as a line representing the current amount of consolidation, can also be optionally drawn on the chart. These indicate when a security is likely in consolidation, according to the spread of various MA values.
[SGM Volatility Lvl]Choppiness Index (CI)
The Choppiness Index is a technical analysis tool used to determine whether a market is trending or consolidating. CI values range between 0 and 100:
- Higher values (close to 100) indicate a choppy market (i.e., the market is consolidating and not trending strongly).
- Lower values (close to 0) signify a trending market (either up or down).
In this script:
- CI values above 62 are considered to represent high volatility.
- CI values below 28 are viewed as representing lower volatility or consolidation.
How the Indicator Works
Choppiness Index Calculation
The CI is calculated using the average true range (ATR) and the high-low range over the specified length:
ci = 100 * math.log10(math.sum(ta.atr(1), length_line) / (ta.highest(length_line) - ta.lowest(length_line))) / math.log10(length_line)
Volatility Determination
The script determines the market's volatility state based on CI:
if ci >= 62
ischarge := 2
if ci <= 28
ischarge := 0
- ischarge = 2 indicates high volatility.
- ischarge = 0 indicates consolidation.
Line Setup
Lines are set on the chart based on the market's volatility:
- If CI increases and indicates high volatility, a line (colored with `volcolor`) is drawn at the close price of the bar.
- If CI decreases and indicates consolidation, a line (colored with `conColor`) is drawn at the close price of the bar.
Line Extension
The lines are automatically extended to the next indicator update or bar:
for i = 0 to array.size(ray) - 1
if i < array.size(ray) - 1
current_line = array.get(ray, i)
next_line = array.get(ray, i + 1)
if not na(current_line) and not na(next_line)
line.set_x2(current_line, line.get_x1(next_line))
else
line.set_x2(current_line, bar_index)
Relevance
Identifying Key Levels
The indicator helps traders identify key levels as follows:
- High Volatility : Lines indicating high volatility suggest strong trending movements. These levels can signify breakout points or areas where the price has made significant moves.
- Consolidation : Lines indicating consolidation suggest the market is ranging. These levels can be used to identify sideways movements, areas of accumulation or distribution, and potential breakout zones.
Potential Future Points of Interest
- High Volatility Lines: Can serve as resistance or support levels if the market revisits these areas.
- Consolidation Lines: Highlight potential zones for price breakouts or reversals when the market transitions from consolidation to a trending phase.
In summary, this indicator can be particularly useful for traders looking to identify periods of high volatility and consolidation. By marking such periods on the chart, traders can better understand market behavior and spot potential trading opportunities.
Bollinger Bands with Squeeze and SMA Indicator Description: BB+SMA
Overview:
Bollinger Bands (BB): Computes and plots three bands based on a selected moving average type (SMA, EMA, SMMA (RMA), WMA, VWMA) and standard deviation multiplier. The bands indicate potential support and resistance levels relative to price volatility.
Squeeze Condition: Detects periods of low volatility (squeeze) when the distance between the upper and lower Bollinger Bands narrows significantly. This condition can signal potential price breakouts.
Simple Moving Average (SMA): Calculates and plots a simple moving average based on user-defined length. It smooths price data to highlight trends and potential reversals.
Smoothing Line: Further enhances the SMA by applying different smoothing methods (SMA, EMA, SMMA (RMA), WMA, VWMA) over a specified smoothing length. It helps in identifying smoother trends and changes in direction.
Key Components:
Inputs: Users can adjust parameters such as Bollinger Bands length, type of moving average, standard deviation multiplier, squeeze condition length, squeeze threshold percentage, SMA length, smoothing method, and smoothing length.
Plotting: Displays the Bollinger Bands (basis, upper, lower), SMA, squeeze condition bands (basis, upper, lower), and a smoothing line on the chart.
Visualization: Utilizes different colors and line styles for clarity in visualizing each component's plot on the chart.
Purpose:
Helps traders identify potential price volatility, trend reversals, and breakout opportunities using Bollinger Bands, SMA, squeeze conditions, and smoothed moving averages.
Enhances technical analysis by providing clear visual cues for trend strength and potential entry/exit points based on the specified parameters.
Conclusion:
The "BB+SMA" indicator integrates multiple technical analysis tools into a single script, offering traders a comprehensive approach to analyzing price movements and making informed trading decisions directly on TradingView charts.
Liquidity Hour by Ibramiho v2Liquidity Hour by Ibramiho (Version 2) - Identify High-Potential Reversal Zones
Understanding the pre-New York session hour is crucial for institutional traders. This period is often characterized by increased liquidity and price volatility as major financial players prepare for the upcoming trading day. The Liquidity Hour indicator capitalizes on this phenomenon, automatically pinpointing the candle (by default, in orange) immediately before the New York session opens.
Why Focus on This Candle?
Liquidity Magnet: Institutional traders often use this hour to establish or adjust positions, creating pockets of liquidity.
Breakout and Retracement Potential: The indicator helps you spot potential areas where price might retrace after a breakout, offering high-probability trading opportunities.
Visual Clarity: The highlighted candle acts as a visual anchor, making it easy to identify these key levels on your chart.
How It Works
1. Automatic Detection: The indicator intelligently detects the pre-New York session candle, regardless of your chart's timeframe.
2. Colour Coding: The candle is highlighted in orange (customizable), instantly drawing your attention.
3. Trade Insights: Watch for price breakouts above or below the highlighted candle. When price retraces back to this level, it signals a potential entry or exit point.
Key Features
Customizable Colour: Change the highlight colour to suit your chart preferences.
Working Timeframes: Works on timeframes, from minutes up to 2 hours timeframe.
Versatile Trading: Suitable for both intraday and swing trading strategies.
Unlock the Power of Institutional Liquidity
Don't miss out on the opportunities that arise in the hour before the New York session. With the Liquidity Hour indicator, you'll gain a valuable edge by identifying key levels where price action is most likely to reverse.
Futures Auto Levels [NariCapitalTrading]Futures Auto Levels Indicator
Introduction
The "Futures Auto Levels" (FAL) indicator shows the previous day's levels, weekly open, high, low, and the Initial Balance Range (IBR).
Indicator Components
The FAL indicator comprises the following components:
Previous Day's Levels: These include the open, high, low, and close of the previous trading day. They are represented on the chart by lines and labels, helping to identify significant price levels from the prior session.
Weekly Open, High, Low: These levels represent the open, high, and low prices of the current trading week.
Initial Balance Range (IBR): The IBR is calculated based on the price range during the first 60 minutes of the trading day. It helps identify initial trading range and potential breakout levels.
How to Use the Indicator
1. Previous Day's Levels:
Monitor the previous day's open, high, low, and close to identify key support and resistance levels.
Use these levels to gauge market sentiment and potential price reversals.
2. Weekly Open, High, Low:
Pay attention to the weekly open, high, and low to understand the market's behavior within the weekly timeframe.
These levels can act as reference points for setting profit targets and stop-loss orders.
3. Initial Balance Range (IBR):
Watch for price movements within the IBR to identify potential trading opportunities.
Breakouts above or below the IBR may signal the beginning of a new trend or continuation of the current trend.
Suggested/Potential Strategies
Reversal Trading: Look for price reversals around previous day's levels, especially when they coincide with other technical indicators or significant support/resistance zones.
Trend Following: Follow the trend by trading breakouts above/below the IBR or weekly high/low levels. Use trailing stops to capture profits while the trend remains intact.
Range Trading: Trade within the IBR when the market is consolidating. Buy near the IBR low and sell near the IBR high, with tight stop-loss orders to manage risk.
Conclusion
The Futures Auto Levels indicator is designed to help incorporate levels into trading analysis and trading strategies to improve profitability and consistency.
XXPivotsBreakoutsLibrary "XXPivotsBreakouts"
Utilizes k-NN machine learning to predict breakout zones from pivot points, aiding traders in identifying potential bullish and bearish market movements. Ideal for trend-following and breakout strategies.
breakouts(pivotBars, numNeighbors, maxData, predictionSmoothing)
Detects and predicts breakout points from pivot data.
Parameters:
pivotBars (int) : int: Number of bars for pivot point detection.
numNeighbors (int) : int: Neighbors count for k-NN prediction.
maxData (int) : int: Maximum pivot data points for analysis.
predictionSmoothing (int) : int: Smoothing period for predictions.
Returns: : Lower and higher prediction bands plus pivot signal, 1 for ph and -1 for pl.
MLPivotsBreakoutsLibrary "MLPivotsBreakouts"
Utilizes k-NN machine learning to predict breakout zones from pivot points, aiding traders in identifying potential bullish and bearish market movements. Ideal for trend-following and breakout strategies.
breakouts(source, pivotBars, numNeighbors, maxData, predictionSmoothing)
Parameters:
source (float) : series float: Price data for analysis.
pivotBars (int) : int: Number of bars for pivot point detection.
numNeighbors (int) : int: Neighbors count for k-NN prediction.
maxData (int) : int: Maximum pivot data points for analysis.
predictionSmoothing (int) : int: Smoothing period for predictions.
@return : Lower and higher prediction bands plus pivot signal, 1 for ph and -1 for pl.
MA Slope [EMA Magic]█ Overview:
The MA Slope calculates the slope based on a given moving average.
The Moving Average Slope indicator allows you to identify the direction and the strength of a trend.
It calculates the rate of change in percentage based on the user-defined moving average.
█ Calculation: This indicator calculates the slope based on the changes of moving average and normalizes it with Average True Range(ATR).
The default value of ATR is 7.I recommend not changing it unless you know exactly what are you doing.
█ Input Settings:
The settings are divided into three sections:
The first section is for time frame adjustments. Modify it separately from the chart, Allows you to use moving averages from different time frames.
In the second section, you can configure the base calculation,including Moving Average and Average True Range(ATR) settings.
In the third section, you can detect breakout and sudden change signals, which are highlighted in the background of the indicator.
Note that When you change the breakout limit value, it also affects the band limit indicator on your chart.
To avoid signal confusion, use only one at a time.
Here is the example the breakout signals:
█ Usage:
When the slope is increasing, it indicates an uptrend.
When the slope is decreasing, it indicates a downtrend.
When the slope is moving around zero and choppy, it indicates no specific trend or price is in a range zone.
Uptrend and Range Zone example:
Downtrend example:
Slope peaks on extreme levels can signal a potential trend reversal point.
Breakout of the upper or lower bands can be translated into a trading signal.Indicating that price will probably continue to move in the direction of the breakout.
Favor long setups when the slope is increasing or it is positive and favor short setups when the slope is decreasing or it is negative.
Fits with any moving average you use, e.g., EMA, WMA, MA Ribbon, and more.
█ Alert
Alerts are available for both signal conditions.
█ Recap
Take the time to study price movements alongside this indicator for a deeper understanding.Whether you're a novice or experienced trader, this indicator can come helpful
Contraction Box & Doji LinesContraction & Doji Lines indicator is designed to identify and visualize potential support and resistance levels on a price chart. It does this by detecting doji candlestick patterns and drawing horizontal lines from the middle of the doji bodies to the right. Additionally, it also highlights price contraction zones with colored boxes.
The indicator first identifies doji candlestick patterns that it suggests indecision in the market, a horizontal line and these horizontal lines can act as potential support or resistance levels. Traders can observe price reactions around these lines. If the price approaches a line and bounces off it, it may indicate a significant level in the market.
In addition to doji lines, this indicator also highlights price contraction zones. When a contraction zone is detected, a colored box is drawn to highlight this zone. The box extends from the fifth bar ago (left side) to the current bar (right side), with the highest high and lowest low of the identified zone. The color and width of this box can be customized using the "Box Line Border Color," "Box Background Color," and "Box Width" parameters.
A possible strategy could be can use the doji lines as potential support and resistance levels to make trading decisions. For example, if the price breaks above a doji line and holds, it may indicate a bullish signal.
The colored boxes highlight areas of price contraction, which often precede significant price movements. Traders can use these zones to anticipate potential breakouts or breakdowns.
For example, you might enter a long (buy) position if it anticipate a breakout from a contraction zone with a target price set above the breakout level. Conversely, you might enter a short (sell) position if they anticipate a breakdown from a contraction zone with a target price set below the breakdown level.
Retest Support Resistance Signals [ChartPrime]The Retest Support Resistance Signals Indicator is a powerful tool designed to assist traders in identifying key support and resistance levels within the market. Most importantly and uniquely it identifies retests of these structures and displays them on the trader's chart. By utilizing a combination of pivot points and price action analysis, this indicator offers valuable insights for both signal-based and support/resistance trading strategies.
Key Features & settings:
Retest Confirmation: The indicator waits for a break above a support or resistance level and observes subsequent price action. If price retraces and forms a wick below the level, followed by a bounce, the indicator identifies it as a retest and labels it as "R" to indicate potential support or resistance confirmation.
This indicator combines the benefits of signal-based trading and support/resistance analysis, providing users with a versatile trading tool suitable for various strategies.
Retest Weaker Toggle: Users have the option to enable or disable the retest weaker feature. When enabled, the indicator considers a support or resistance level weaker if it experiences a test. When disabled, the indicator assumes that a bounce may occur from the level.
Pivot Detection Customization: Users can adjust the pivot detection method based on either wicks or bodies. This flexibility allows traders to adapt the indicator to different market conditions and preferences. The trader can also customize the number of bars used for pivot detection on both the left and right sides. This feature enables traders to fine-tune the indicator's sensitivity and responsiveness.
Users also have control over how support or resistance levels are managed on the chart. They can choose to either stop updating the levels (freeze) or completely remove them (delete) from the chart.
Breakout Threshold Setting: Traders can adjust the breakout threshold until deletion setting. This setting determines the number of successful breakouts through a support or resistance level required to remove it from the chart. This feature helps filter out weaker levels and focus on more significant ones.
Shown above we see the retest labels in action denoted with an R label
This indicator can be a useful addition to an SR trader's toolkit. Identifying when a level in the market is retested can reveal interesting information about the underlying strength of a trend. This indicator has been designed with the two major schools of thought; a level gets weaker the more it's tested vs stronger the more it's tested. We have designed this therefore to be versatile and adapt to both thought procceses. The R labels should be taken and considered as a larger part of an analysis process and not followed blindly.
Support/ResistanceUse this code to stop support and resistance
This can be used with the momentum indicators that I have to see if we are likely to breakout or get rejected
Indicator Settings:
The indicator is titled "Support/Resistance | Breaks & Bounces" and is set to overlay on the price chart.
max_lines_count is set to 500, indicating the maximum number of support/resistance lines that can be plotted.
User Input:
The script allows users to customize the pivot method, sensitivity, and line width through input variables.
point_method determines whether the pivot calculation is based on "Candle Wicks" or "Candle Body".
left_bars represents the number of bars to the left used to identify pivot highs/lows.
right_bars is set equal to left_bars.
line_width controls the width of the support/resistance lines.
Global Variables and Arrays:
The script declares several variables and arrays to store information related to support and resistance levels, breakouts, and bounces.
high_source and low_source are calculated based on the selected pivot method.
fixed_pivot_high and fixed_pivot_low store the pivot highs and lows using the chosen sensitivity.
Variables and arrays are initialized for tracking support/resistance lines, breakout triggers, and bounce triggers.
Main Operation:
The main operation occurs when barstate.isconfirmed is true, indicating that a new bar has formed and its data is final.
The script iterates through the support/resistance lines to update their end points (x2) to the current bar.
For each support/resistance line, it checks if a breakout or bounce event has occurred based on the current and previous bar's price levels.
If a breakout or bounce event is detected, the corresponding trigger variables (red_breakout_trigger, red_rejection_trigger, green_breakout_trigger, green_rejection_trigger) are set to true.
The script also checks for changes in the pivot highs and lows and updates the support/resistance lines accordingly.
If a change is detected, it clears the existing lines, breakout, and bounce arrays and adds new lines for the updated pivot levels.
Gaussian Fisher Transform Price Reversals - FTRHello Traders !
Looking for better trading results ?
"This indicator shows you how to identify price reversals in a timely manner." John F. Ehlers
Introduction :
The Gaussian Fisher Transform Price Reversals indicator, dubbed FTR for short, is a stat based price reversal detection indicator inspired by and based on the work of the electrical engineer now private trader John F. Ehlers.
The Fisher Transform :
It is a common assumption that prices have a gaussian / normal probability density function(PDF), i.e. a sample of n close prices would be normally distributed if the probability of observing a price value say at any given standard deviation range is equal to that probability in the case of the normal distribution, e.g. 68% off all samples fell within one standard deviation around the mean, which is what we would expect if the data was normal.
However Price Action is not normally distributed and thus can not be conventionally interpreted in this way, Formally the Fisher Transform, transforms the distribution of bounded ranging price action (were price action takes values in a range from -1 to 1) into that of a normal distribution, alternatively it may be said the Fisher Transform changes the PDF of any waveform so that the transformed output has n approximately Gaussian PDF, It does so through the following equations. taken directly from the work of John F. Ehlers - Using The Fisher Transform
By substituting price data in the above formulas, bounded ranging price actions (over a given user defined period lookback - this determines the range price ranges in, see the Intermediate formula above) distribution is transformed to that in the normal case. This means when the input, the Intermediate ,(the Midpoint - see formula above) approaches either limit within the range the outputs are greatly amplified, this amplification accentuates /puts more weight on the larger deviations or limits within the range, conversely when price action is varying round the mean of the range the output is approximately equal to unity (the input is approximately equal to the input, the intermediate)
The inputs (Intermediates) are converted to normal outputs and the nonlinear Transfer of the Fisher Transform with varying senesitivity's (gammas) can be seen in the graph / image above. Although sensitivity adjustments are not currently available in this script (I forgot to add it) the outputs may be greatly amplified as gamma (the coefficient of the Fisher Transformation - see Fish equation) approaches 1. the purple line show this graphically, as a higher gamma leads to a greater amplification than in the standard case (the red line which is the standard fisher transformation, the black plot is the Fish with a gamma of 1, which is unity sensativity)
Reversal plots and Breakouts :
- Support lines are plotted with their corresponding Fish value when there is a crossover of the Fish and Fish SMA <= a given standard deviation of Fish
- Resistance lines are plotted with their corresponding Fish value when there is a crossunder of the Fish and Fish SMA >= a given standard deviation of Fish
- Reversals are these support and resistance line plots
Breakouts and Volume bars :
Breakouts cause the reversal lines to break (when the high/low is above the resistance/support), Breakouts are more "high quality" when they occur conditional on high volume, the highlighted bars represent volume standard deviations ranging from -3 to 3. When breakouts occure on high volume this may be a sign of the continutaion of the trend (reversals would signify the start of a new trend).
Hope you enjoy, Happy Trading !
(be sure to rocket the script if you liked it, this helps me know which of my scripts are the most useful)
peacefulIndicatorsWe are delighted to present the PeacefulIndicators library, a modest yet powerful collection of custom technical indicators created to enhance your trading analysis. The library features an array of practical tools, including MACD with Dynamic Length, Stochastic RSI with ATR Stop Loss, Bollinger Bands with RSI Divergence, and more.
The PeacefulIndicators library offers the following functions:
macdDynamicLength: An adaptive version of the classic MACD indicator, which adjusts the lengths of the moving averages based on the dominant cycle period, providing a more responsive signal.
rsiDivergence: A unique implementation of RSI Divergence detection that identifies potential bullish and bearish divergences using a combination of RSI and linear regression.
trendReversalDetection: A helpful tool for detecting trend reversals using the Rate of Change (ROC) and Moving Averages, offering valuable insights into possible market shifts.
volume_flow_oscillator: A custom oscillator that combines price movement strength and volume to provide a unique perspective on market dynamics.
weighted_volatility_oscillator: Another custom oscillator that factors in price volatility and volume to deliver a comprehensive view of market fluctuations.
rvo: The Relative Volume Oscillator highlights changes in volume relative to historical averages, helping to identify potential breakouts or reversals.
acb: The Adaptive Channel Breakout indicator combines a moving average with an adjustable volatility multiplier to create dynamic channels, useful for identifying potential trend shifts.
We hope this library proves to be a valuable addition to your trading toolbox.
Library "peacefulIndicators"
A custom library of technical indicators for trading analysis, including MACD with Dynamic Length, Stochastic RSI with ATR Stop Loss, Bollinger Bands with RSI Divergence, and more.
macdDynamicLength(src, shortLen, longLen, signalLen, dynLow, dynHigh)
Moving Average Convergence Divergence with Dynamic Length
Parameters:
src (float) : Series to use
shortLen (int) : Shorter moving average length
longLen (int) : Longer moving average length
signalLen (int) : Signal line length
dynLow (int) : Lower bound for the dynamic length
dynHigh (int) : Upper bound for the dynamic length
Returns: tuple of MACD line and Signal line
Computes MACD using lengths adapted based on the dominant cycle period
rsiDivergence(src, rsiLen, divThreshold, linRegLength)
RSI Divergence Detection
Parameters:
src (float) : Series to use
rsiLen (simple int) : Length for RSI calculation
divThreshold (float) : Divergence threshold for RSI
linRegLength (int) : Length for linear regression calculation
Returns: tuple of RSI Divergence (positive, negative)
Computes RSI Divergence detection that identifies bullish (positive) and bearish (negative) divergences
trendReversalDetection(src, rocLength, maLength, maType)
Trend Reversal Detection (TRD)
Parameters:
src (float) : Series to use
rocLength (int) : Length for Rate of Change calculation
maLength (int) : Length for Moving Average calculation
maType (string) : Type of Moving Average to use (default: "sma")
Returns: A tuple containing trend reversal direction and the reversal point
Detects trend reversals using the Rate of Change (ROC) and Moving Averages.
volume_flow_oscillator(src, length)
Volume Flow Oscillator
Parameters:
src (float) : Series to use
length (int) : Period for the calculation
Returns: Custom Oscillator value
Computes the custom oscillator based on price movement strength and volume
weighted_volatility_oscillator(src, length)
Weighted Volatility Oscillator
Parameters:
src (float) : Series to use
length (int) : Period for the calculation
Returns: Custom Oscillator value
Computes the custom oscillator based on price volatility and volume
rvo(length)
Relative Volume Oscillator
Parameters:
length (int) : Period for the calculation
Returns: Custom Oscillator value
Computes the custom oscillator based on relative volume
acb(price_series, ma_length, vol_length, multiplier)
Adaptive Channel Breakout
Parameters:
price_series (float) : Price series to use
ma_length (int) : Period for the moving average calculation
vol_length (int) : Period for the volatility calculation
multiplier (float) : Multiplier for the volatility
Returns: Tuple containing the ACB upper and lower values and the trend direction (1 for uptrend, -1 for downtrend)
Improved Scalping Consolidation and Squeeze IndicatorThe Improved Scalping Consolidation and Squeeze Indicator (Improved Scalp C&S) is a custom TradingView indicator designed for short-term trading, specifically scalping. It detects price consolidation and potential breakout scenarios using a combination of technical analysis tools, such as the Rate of Change (ROC), Relative Strength Index (RSI), Moving Average Convergence Divergence (MACD), Bollinger Bands, and Keltner Channels. To reduce the number of false signals, this improved version introduces a "consolidation strength" parameter, which represents the minimum number of consecutive bars required for a valid consolidation or squeeze signal.
How it works:
Consolidation Detection:
The indicator identifies price consolidation when the following conditions are met:
a. RSI is between 45 and 55, indicating a lack of strong momentum.
b. The absolute value of the MACD histogram is less than 0.1% of the closing price, suggesting a lack of directional movement.
c. The Rate of Change (ROC) is less than 1.5%, indicating relatively stable prices over the specified period.
Squeeze Detection:
The indicator detects a squeeze (a potential breakout scenario) when the Bollinger Bands are within the Keltner Channels, represented by the following conditions:
a. The lower Bollinger Band is above the lower Keltner Channel.
b. The upper Bollinger Band is below the upper Keltner Channel.
Consolidation Strength:
The consolidation strength parameter filters out weaker signals by requiring a minimum number of consecutive bars for a valid consolidation or squeeze signal. By adjusting this parameter, traders can control the sensitivity of the indicator to short-term price movements and potentially reduce the number of false signals.
When the consolidation strength criteria are met, the indicator colors the price bars within the pattern yellow for consolidation and orange for a squeeze, signaling potential trading opportunities.
Trading Strategy:
The Improved Scalping Consolidation and Squeeze Indicator can be used in various ways, depending on the trader's strategy and risk appetite. Here are some suggestions:
Range trading: During consolidation (yellow bars), traders can buy at support levels and sell at resistance levels within the range, using stop-loss orders to manage risk. However, this approach might not work well in the case of a sudden breakout.
Breakout trading: When a squeeze is detected (orange bars), traders can wait for a confirmed breakout from the consolidation pattern before entering a trade. A breakout can be confirmed by a strong price move accompanied by increased volume, a significant change in momentum, or a breach of important support or resistance levels.
Momentum-based strategies: Traders can use other momentum-based indicators (e.g., Stochastic Oscillator, On Balance Volume) in conjunction with the Improved Scalp C&S indicator to identify potential entry and exit points during consolidation or breakout scenarios.
Fine-tuning the consolidation strength: Adjust the "consolidation strength" input to find the optimal balance between the number of signals and their accuracy. A higher value will result in fewer signals, potentially reducing the number of false signals, but it may also make the indicator less sensitive to short-term price movements.
CFB-Adaptive Trend Cipher Candles [Loxx]CFB-Adaptive Trend Cipher Candles is a candle coloring indicator that shows both trend and trend exhaustion using Composite Fractal Behavior price trend analysis. To do this, we first calculate the dynamic period outputs from the CFB algorithm and then we injection those period inputs into a correlation function that correlates price input price to the candle index. The closer the correlation is to 1, the lighter the green color until the color turns yellow, sometimes, indicating upward price exhaustion. The closer the correlation is to -1, the lighter the red color until it reaches Fuchsia color indicating downward price exhaustion. Green means uptrend, red means downtrend, yellow means reversal from uptrend to downtrend, fuchsia means reversal from downtrend to uptrend.
What is Composite Fractal Behavior ( CFB )?
All around you mechanisms adjust themselves to their environment. From simple thermostats that react to air temperature to computer chips in modern cars that respond to changes in engine temperature, r.p.m.'s, torque, and throttle position. It was only a matter of time before fast desktop computers applied the mathematics of self-adjustment to systems that trade the financial markets.
Unlike basic systems with fixed formulas, an adaptive system adjusts its own equations. For example, start with a basic channel breakout system that uses the highest closing price of the last N bars as a threshold for detecting breakouts on the up side. An adaptive and improved version of this system would adjust N according to market conditions, such as momentum, price volatility or acceleration.
Since many systems are based directly or indirectly on cycles, another useful measure of market condition is the periodic length of a price chart's dominant cycle, (DC), that cycle with the greatest influence on price action.
The utility of this new DC measure was noted by author Murray Ruggiero in the January '96 issue of Futures Magazine. In it. Mr. Ruggiero used it to adaptive adjust the value of N in a channel breakout system. He then simulated trading 15 years of D-Mark futures in order to compare its performance to a similar system that had a fixed optimal value of N. The adaptive version produced 20% more profit!
This DC index utilized the popular MESA algorithm (a formulation by John Ehlers adapted from Burg's maximum entropy algorithm, MEM). Unfortunately, the DC approach is problematic when the market has no real dominant cycle momentum, because the mathematics will produce a value whether or not one actually exists! Therefore, we developed a proprietary indicator that does not presuppose the presence of market cycles. It's called CFB (Composite Fractal Behavior) and it works well whether or not the market is cyclic.
CFB examines price action for a particular fractal pattern, categorizes them by size, and then outputs a composite fractal size index. This index is smooth, timely and accurate
Essentially, CFB reveals the length of the market's trending action time frame. Long trending activity produces a large CFB index and short choppy action produces a small index value. Investors have found many applications for CFB which involve scaling other existing technical indicators adaptively, on a bar-to-bar basis.
Included
Loxx's Expanded Source Types
Related indicators:
Adaptive Trend Cipher loxx]
Dynamic Zones Polychromatic Momentum Candles
RSI Precision Trend Candles
CFB-Adaptive, Jurik DMX Histogram [Loxx]Jurik DMX Histogram is the ultra-smooth, low lag version of your classic DMI indicator. This is a momentum indicator. You can use this indicator standalone or as part of a system with a moving average and a mean reversion indicator. This indicator has both composite fractal behavior adaptive inputs and fixed inputs. The default is CFB adaptive. Dark green means strong push up, dark red, strong push down. Light green means weak push up, and light red means weak push down.
What is the directional movement index?
The directional movement index (DMI) is an indicator developed by J. Welles Wilder in 1978 that identifies in which direction the price of an asset is moving. The indicator does this by comparing prior highs and lows and drawing two lines: a positive directional movement line ( +DI ) and a negative directional movement line ( -DI ). An optional third line, called the average directional index ( ADX ), can also be used to gauge the strength of the uptrend or downtrend.
When +DI is above -DI , there is more upward pressure than downward pressure in the price. Conversely, if -DI is above +DI , then there is more downward pressure on the price. This indicator may help traders assess the trend direction. Crossovers between the lines are also sometimes used as trade signals to buy or sell.
What is Composite Fractal Behavior ( CFB )?
All around you mechanisms adjust themselves to their environment. From simple thermostats that react to air temperature to computer chips in modern cars that respond to changes in engine temperature, r.p.m.'s, torque, and throttle position. It was only a matter of time before fast desktop computers applied the mathematics of self-adjustment to systems that trade the financial markets.
Unlike basic systems with fixed formulas, an adaptive system adjusts its own equations. For example, start with a basic channel breakout system that uses the highest closing price of the last N bars as a threshold for detecting breakouts on the up side. An adaptive and improved version of this system would adjust N according to market conditions, such as momentum, price volatility or acceleration.
Since many systems are based directly or indirectly on cycles, another useful measure of market condition is the periodic length of a price chart's dominant cycle, (DC), that cycle with the greatest influence on price action.
The utility of this new DC measure was noted by author Murray Ruggiero in the January '96 issue of Futures Magazine. In it. Mr. Ruggiero used it to adaptive adjust the value of N in a channel breakout system. He then simulated trading 15 years of D-Mark futures in order to compare its performance to a similar system that had a fixed optimal value of N. The adaptive version produced 20% more profit!
This DC index utilized the popular MESA algorithm (a formulation by John Ehlers adapted from Burg's maximum entropy algorithm, MEM). Unfortunately, the DC approach is problematic when the market has no real dominant cycle momentum, because the mathematics will produce a value whether or not one actually exists! Therefore, we developed a proprietary indicator that does not presuppose the presence of market cycles. It's called CFB (Composite Fractal Behavior) and it works well whether or not the market is cyclic.
CFB examines price action for a particular fractal pattern, categorizes them by size, and then outputs a composite fractal size index. This index is smooth, timely and accurate
Essentially, CFB reveals the length of the market's trending action time frame. Long trending activity produces a large CFB index and short choppy action produces a small index value. Investors have found many applications for CFB which involve scaling other existing technical indicators adaptively, on a bar-to-bar basis.
What is Jurik Volty used in the Juirk Filter?
One of the lesser known qualities of Juirk smoothing is that the Jurik smoothing process is adaptive. "Jurik Volty" (a sort of market volatility ) is what makes Jurik smoothing adaptive. The Jurik Volty calculation can be used as both a standalone indicator and to smooth other indicators that you wish to make adaptive.
What is the Jurik Moving Average?
Have you noticed how moving averages add some lag (delay) to your signals? ... especially when price gaps up or down in a big move, and you are waiting for your moving average to catch up? Wait no more! JMA eliminates this problem forever and gives you the best of both worlds: low lag and smooth lines.
Ideally, you would like a filtered signal to be both smooth and lag-free. Lag causes delays in your trades, and increasing lag in your indicators typically result in lower profits. In other words, late comers get what's left on the table after the feast has already begun.
Included:
Alerts
Loxx's Expanded Source Types
Signals
Bar coloring
Average Daily Range (ADR) (Multi Timeframe, Multi Period)Average Daily Range (ADR)
(Multi Timeframe, Multi Period, Extended Levels)
Tips
• Narrow Zones are an indication of breakouts. It can be a very tight range as well.
• Wider Zones can be Sideways or Volatile.
What is this Indicator?
• This is Average Daily Range (ADR) Zones or Pivots.
• This have Multi Timeframe, Multi Period (Up to 3 Levels) and Extended Target Levels.
Advantages of this Indicator
• This is a Leading indicator, not Dynamic or Repaint.
• Helps to identify the reversal points.
• The levels are more accurate and not like the old formulas.
• Can practically follow the Buy Low and Sell High principle.
• Helps to keep minimum Stop Loss.
Who to use?
• Highly beneficial for Day Traders
• It can be used for Swing and Positions as well.
What timeframe to use?
• Any timeframe.
When to use?
• Any market conditions.
How to use?
Entry
• Long entry when the Price reach at or closer to the Green Support zone.
• Long entry when the Price retrace to the Red Resistance zone.
• Short entry when the Price reach at or closer to the Red Resistance zone.
• Short entry when the Price retrace to the Green Support zone.
• Long or Short at the Pivot line.
Exit
• Use past ADR levels as targets.
• Or use the Target levels in the indicator for breakouts.
• Use the Pivot line as target.
• Use Support or Resistance Zones as targets in reversal method.
What are the Lines?
Gray Line:
• It the day Open or can be considered as Pivot.
Red & Green ADR Zones:
• Red Zone is Resistance.
• Green Zone is Support.
• Mostly price can reverse from this Zones.
• Multiple Red and Green Lines forms a Zone.
• These lines are average levels of past days which helps to figure out the maximum and minimum price range that can be moved in that day.
• The default number of days are 5, 7 and 14. This can be customized.
Red & Green Target Lines:
• These are Target levels.
What are the Labels?
• First Number: Price of that level.
• Numbers in (): Percentage change and Change of price from LTP (Last Traded Price) to that Level.
General Tips
• It is good if Stock trend is same as that of the Index trend.
• Lots of indicators creates lots of confusion.
• Keep the chart simple and clean.
• Buy Low and Sell High.
• Master averages or 50%.
CFB-Adaptive Velocity Histogram [Loxx]CFB-Adaptive Velocity Histogram is a velocity indicator with One-More-Moving-Average Adaptive Smoothing of input source value and Jurik's Composite-Fractal-Behavior-Adaptive Price-Trend-Period input with Dynamic Zones. All Juirk smoothing allows for both single and double Jurik smoothing passes. Velocity is adjusted to pips but there is no input value for the user. This indicator is tuned for Forex but can be used on any time series data.
What is Composite Fractal Behavior ( CFB )?
All around you mechanisms adjust themselves to their environment. From simple thermostats that react to air temperature to computer chips in modern cars that respond to changes in engine temperature, r.p.m.'s, torque, and throttle position. It was only a matter of time before fast desktop computers applied the mathematics of self-adjustment to systems that trade the financial markets.
Unlike basic systems with fixed formulas, an adaptive system adjusts its own equations. For example, start with a basic channel breakout system that uses the highest closing price of the last N bars as a threshold for detecting breakouts on the up side. An adaptive and improved version of this system would adjust N according to market conditions, such as momentum, price volatility or acceleration.
Since many systems are based directly or indirectly on cycles, another useful measure of market condition is the periodic length of a price chart's dominant cycle, (DC), that cycle with the greatest influence on price action.
The utility of this new DC measure was noted by author Murray Ruggiero in the January '96 issue of Futures Magazine. In it. Mr. Ruggiero used it to adaptive adjust the value of N in a channel breakout system. He then simulated trading 15 years of D-Mark futures in order to compare its performance to a similar system that had a fixed optimal value of N. The adaptive version produced 20% more profit!
This DC index utilized the popular MESA algorithm (a formulation by John Ehlers adapted from Burg's maximum entropy algorithm, MEM). Unfortunately, the DC approach is problematic when the market has no real dominant cycle momentum, because the mathematics will produce a value whether or not one actually exists! Therefore, we developed a proprietary indicator that does not presuppose the presence of market cycles. It's called CFB (Composite Fractal Behavior) and it works well whether or not the market is cyclic.
CFB examines price action for a particular fractal pattern, categorizes them by size, and then outputs a composite fractal size index. This index is smooth, timely and accurate
Essentially, CFB reveals the length of the market's trending action time frame. Long trending activity produces a large CFB index and short choppy action produces a small index value. Investors have found many applications for CFB which involve scaling other existing technical indicators adaptively, on a bar-to-bar basis.
What is Jurik Volty used in the Juirk Filter?
One of the lesser known qualities of Juirk smoothing is that the Jurik smoothing process is adaptive. "Jurik Volty" (a sort of market volatility ) is what makes Jurik smoothing adaptive. The Jurik Volty calculation can be used as both a standalone indicator and to smooth other indicators that you wish to make adaptive.
What is the Jurik Moving Average?
Have you noticed how moving averages add some lag (delay) to your signals? ... especially when price gaps up or down in a big move, and you are waiting for your moving average to catch up? Wait no more! JMA eliminates this problem forever and gives you the best of both worlds: low lag and smooth lines.
Ideally, you would like a filtered signal to be both smooth and lag-free. Lag causes delays in your trades, and increasing lag in your indicators typically result in lower profits. In other words, late comers get what's left on the table after the feast has already begun.
What are Dynamic Zones?
As explained in "Stocks & Commodities V15:7 (306-310): Dynamic Zones by Leo Zamansky, Ph .D., and David Stendahl"
Most indicators use a fixed zone for buy and sell signals. Here’ s a concept based on zones that are responsive to past levels of the indicator.
One approach to active investing employs the use of oscillators to exploit tradable market trends. This investing style follows a very simple form of logic: Enter the market only when an oscillator has moved far above or below traditional trading lev- els. However, these oscillator- driven systems lack the ability to evolve with the market because they use fixed buy and sell zones. Traders typically use one set of buy and sell zones for a bull market and substantially different zones for a bear market. And therein lies the problem.
Once traders begin introducing their market opinions into trading equations, by changing the zones, they negate the system’s mechanical nature. The objective is to have a system automatically define its own buy and sell zones and thereby profitably trade in any market — bull or bear. Dynamic zones offer a solution to the problem of fixed buy and sell zones for any oscillator-driven system.
An indicator’s extreme levels can be quantified using statistical methods. These extreme levels are calculated for a certain period and serve as the buy and sell zones for a trading system. The repetition of this statistical process for every value of the indicator creates values that become the dynamic zones. The zones are calculated in such a way that the probability of the indicator value rising above, or falling below, the dynamic zones is equal to a given probability input set by the trader.
To better understand dynamic zones, let's first describe them mathematically and then explain their use. The dynamic zones definition:
Find V such that:
For dynamic zone buy: P{X <= V}=P1
For dynamic zone sell: P{X >= V}=P2
where P1 and P2 are the probabilities set by the trader, X is the value of the indicator for the selected period and V represents the value of the dynamic zone.
The probability input P1 and P2 can be adjusted by the trader to encompass as much or as little data as the trader would like. The smaller the probability, the fewer data values above and below the dynamic zones. This translates into a wider range between the buy and sell zones. If a 10% probability is used for P1 and P2, only those data values that make up the top 10% and bottom 10% for an indicator are used in the construction of the zones. Of the values, 80% will fall between the two extreme levels. Because dynamic zone levels are penetrated so infrequently, when this happens, traders know that the market has truly moved into overbought or oversold territory.
Calculating the Dynamic Zones
The algorithm for the dynamic zones is a series of steps. First, decide the value of the lookback period t. Next, decide the value of the probability Pbuy for buy zone and value of the probability Psell for the sell zone.
For i=1, to the last lookback period, build the distribution f(x) of the price during the lookback period i. Then find the value Vi1 such that the probability of the price less than or equal to Vi1 during the lookback period i is equal to Pbuy. Find the value Vi2 such that the probability of the price greater or equal to Vi2 during the lookback period i is equal to Psell. The sequence of Vi1 for all periods gives the buy zone. The sequence of Vi2 for all periods gives the sell zone.
In the algorithm description, we have: Build the distribution f(x) of the price during the lookback period i. The distribution here is empirical namely, how many times a given value of x appeared during the lookback period. The problem is to find such x that the probability of a price being greater or equal to x will be equal to a probability selected by the user. Probability is the area under the distribution curve. The task is to find such value of x that the area under the distribution curve to the right of x will be equal to the probability selected by the user. That x is the dynamic zone.
Included:
Bar coloring
3 signal variations w/ alerts
Divergences w/ alerts
Loxx's Expanded Source Types
CFB-Adaptive, Williams %R w/ Dynamic Zones [Loxx]CFB-Adaptive, Williams %R w/ Dynamic Zones is a Jurik-Composite-Fractal-Behavior-Adaptive Williams % Range indicator with Dynamic Zones. These additions to the WPR calculation reduce noise and return a signal that is more viable than WPR alone.
What is Williams %R?
Williams %R , also known as the Williams Percent Range, is a type of momentum indicator that moves between 0 and -100 and measures overbought and oversold levels. The Williams %R may be used to find entry and exit points in the market. The indicator is very similar to the Stochastic oscillator and is used in the same way. It was developed by Larry Williams and it compares a stock’s closing price to the high-low range over a specific period, typically 14 days or periods.
What is Composite Fractal Behavior ( CFB )?
All around you mechanisms adjust themselves to their environment. From simple thermostats that react to air temperature to computer chips in modern cars that respond to changes in engine temperature, r.p.m.'s, torque, and throttle position. It was only a matter of time before fast desktop computers applied the mathematics of self-adjustment to systems that trade the financial markets.
Unlike basic systems with fixed formulas, an adaptive system adjusts its own equations. For example, start with a basic channel breakout system that uses the highest closing price of the last N bars as a threshold for detecting breakouts on the up side. An adaptive and improved version of this system would adjust N according to market conditions, such as momentum, price volatility or acceleration.
Since many systems are based directly or indirectly on cycles, another useful measure of market condition is the periodic length of a price chart's dominant cycle, (DC), that cycle with the greatest influence on price action.
The utility of this new DC measure was noted by author Murray Ruggiero in the January '96 issue of Futures Magazine. In it. Mr. Ruggiero used it to adaptive adjust the value of N in a channel breakout system. He then simulated trading 15 years of D-Mark futures in order to compare its performance to a similar system that had a fixed optimal value of N. The adaptive version produced 20% more profit!
This DC index utilized the popular MESA algorithm (a formulation by John Ehlers adapted from Burg's maximum entropy algorithm, MEM). Unfortunately, the DC approach is problematic when the market has no real dominant cycle momentum, because the mathematics will produce a value whether or not one actually exists! Therefore, we developed a proprietary indicator that does not presuppose the presence of market cycles. It's called CFB (Composite Fractal Behavior) and it works well whether or not the market is cyclic.
CFB examines price action for a particular fractal pattern, categorizes them by size, and then outputs a composite fractal size index. This index is smooth, timely and accurate
Essentially, CFB reveals the length of the market's trending action time frame. Long trending activity produces a large CFB index and short choppy action produces a small index value. Investors have found many applications for CFB which involve scaling other existing technical indicators adaptively, on a bar-to-bar basis.
What is Jurik Volty used in the Juirk Filter?
One of the lesser known qualities of Juirk smoothing is that the Jurik smoothing process is adaptive. "Jurik Volty" (a sort of market volatility ) is what makes Jurik smoothing adaptive. The Jurik Volty calculation can be used as both a standalone indicator and to smooth other indicators that you wish to make adaptive.
What is the Jurik Moving Average?
Have you noticed how moving averages add some lag (delay) to your signals? ... especially when price gaps up or down in a big move, and you are waiting for your moving average to catch up? Wait no more! JMA eliminates this problem forever and gives you the best of both worlds: low lag and smooth lines.
Ideally, you would like a filtered signal to be both smooth and lag-free. Lag causes delays in your trades, and increasing lag in your indicators typically result in lower profits. In other words, late comers get what's left on the table after the feast has already begun.
What are Dynamic Zones?
As explained in "Stocks & Commodities V15:7 (306-310): Dynamic Zones by Leo Zamansky, Ph .D., and David Stendahl"
Most indicators use a fixed zone for buy and sell signals. Here’ s a concept based on zones that are responsive to past levels of the indicator.
One approach to active investing employs the use of oscillators to exploit tradable market trends. This investing style follows a very simple form of logic: Enter the market only when an oscillator has moved far above or below traditional trading lev- els. However, these oscillator- driven systems lack the ability to evolve with the market because they use fixed buy and sell zones. Traders typically use one set of buy and sell zones for a bull market and substantially different zones for a bear market. And therein lies the problem.
Once traders begin introducing their market opinions into trading equations, by changing the zones, they negate the system’s mechanical nature. The objective is to have a system automatically define its own buy and sell zones and thereby profitably trade in any market — bull or bear. Dynamic zones offer a solution to the problem of fixed buy and sell zones for any oscillator-driven system.
An indicator’s extreme levels can be quantified using statistical methods. These extreme levels are calculated for a certain period and serve as the buy and sell zones for a trading system. The repetition of this statistical process for every value of the indicator creates values that become the dynamic zones. The zones are calculated in such a way that the probability of the indicator value rising above, or falling below, the dynamic zones is equal to a given probability input set by the trader.
To better understand dynamic zones, let's first describe them mathematically and then explain their use. The dynamic zones definition:
Find V such that:
For dynamic zone buy: P{X <= V}=P1
For dynamic zone sell: P{X >= V}=P2
where P1 and P2 are the probabilities set by the trader, X is the value of the indicator for the selected period and V represents the value of the dynamic zone.
The probability input P1 and P2 can be adjusted by the trader to encompass as much or as little data as the trader would like. The smaller the probability, the fewer data values above and below the dynamic zones. This translates into a wider range between the buy and sell zones. If a 10% probability is used for P1 and P2, only those data values that make up the top 10% and bottom 10% for an indicator are used in the construction of the zones. Of the values, 80% will fall between the two extreme levels. Because dynamic zone levels are penetrated so infrequently, when this happens, traders know that the market has truly moved into overbought or oversold territory.
Calculating the Dynamic Zones
The algorithm for the dynamic zones is a series of steps. First, decide the value of the lookback period t. Next, decide the value of the probability Pbuy for buy zone and value of the probability Psell for the sell zone.
For i=1, to the last lookback period, build the distribution f(x) of the price during the lookback period i. Then find the value Vi1 such that the probability of the price less than or equal to Vi1 during the lookback period i is equal to Pbuy. Find the value Vi2 such that the probability of the price greater or equal to Vi2 during the lookback period i is equal to Psell. The sequence of Vi1 for all periods gives the buy zone. The sequence of Vi2 for all periods gives the sell zone.
In the algorithm description, we have: Build the distribution f(x) of the price during the lookback period i. The distribution here is empirical namely, how many times a given value of x appeared during the lookback period. The problem is to find such x that the probability of a price being greater or equal to x will be equal to a probability selected by the user. Probability is the area under the distribution curve. The task is to find such value of x that the area under the distribution curve to the right of x will be equal to the probability selected by the user. That x is the dynamic zone.
Included:
Bar coloring
3 signal variations w/ alerts
Divergences w/ alerts
Loxx's Expanded Source Types