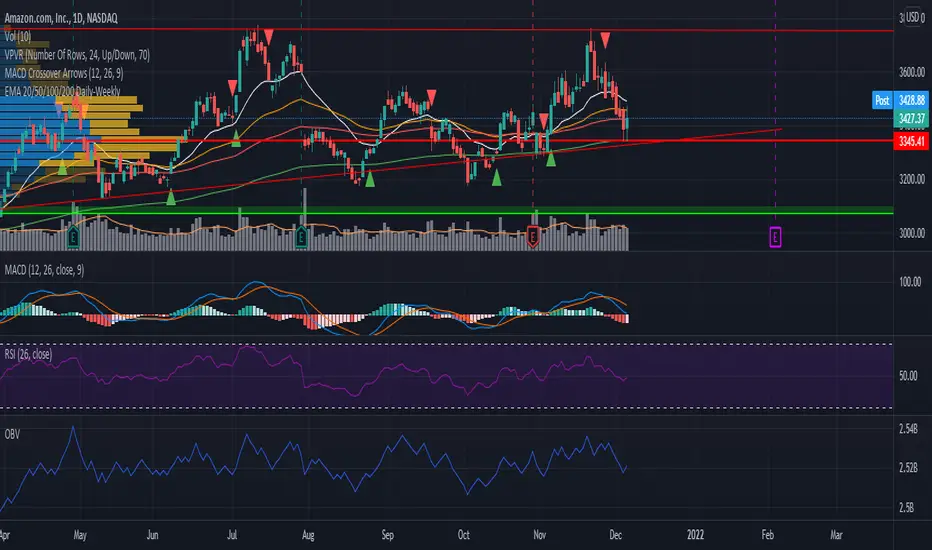
EMA 20/50/100/200 Daily-WeeklyHello!
In case this helps others when using EMA's on multiple timeframes, I decided to publish this script I modified.
It adds the EMA for 20/50/100/200 timeframes and gives them the color white, orange, red, green respectively.
The weekly timeframe will get the corresponding weekly EMA.
The monthly timeframe will get the corresponding monthly EMA.
The daily timeframe, and all timeframes below this, will get the daily timeframe. The idea that that a ticker symbol might respect with strength the daily EMA's - you'll be able to move to a smaller timeframe and still view the daily EMA's in an effort to better view how close the ticker came to taking a specific EMA.
在腳本中搜尋"daily"
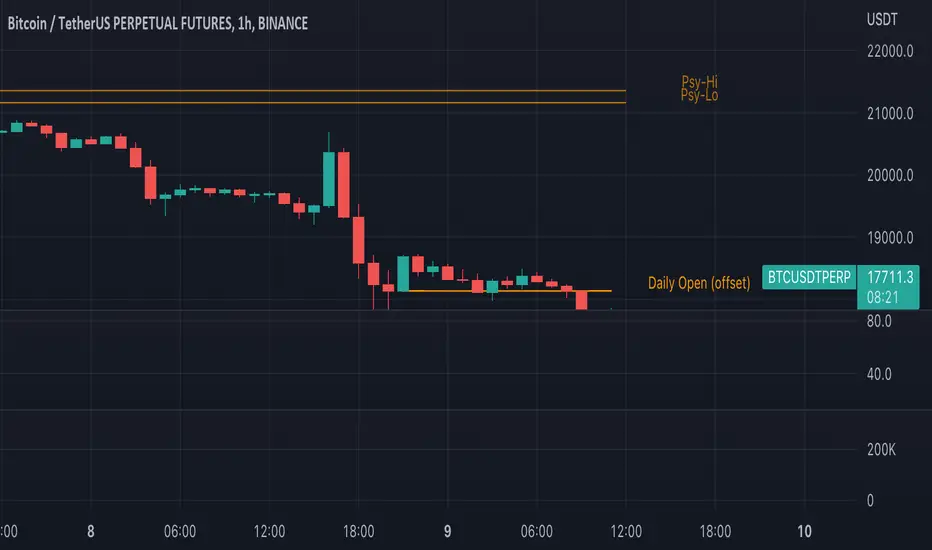
Traders Reality Psy Levels/Daily Open GMT AwareTraders Reality Psy Levels/Daily Open GMT Aware
This indicator serves as the Tradingview equivalent of an MT4 indicator suite (Psy Levels and Daily Open)
Functionality:
In general we define Asia session to start with the Sydney exchange open.
For all intends and purposes for this indicator Asia session is defined as the open of the NZX market and close of the ASX market according to the 24 hour market clock.
The Daily Open is defined as the open of the Asia session.
The Psychological High and Low are defined as the first high and first low the Asian session starting at Saturday night and going into Sunday morning.
These are 2 key confluences that can be used in various strategies. These are in some sense similar to pivot points.
The script is GMT ( UTC ) offset aware meaning you can adjust the start of the day to any point within the allowed GMT offsets (-12 to 14)
For example if your exchange timezone is UTC+0 then the start of the Asia session starts at 2000 (UTC+0) and ends at 0400 (UTC+0) when Sydney if not in DST
You will set the offset to 4. When Sydney is in DST you will set the offset to 3
Naturally since the offset allows the entire range of GMT offsets to be used you do not need to choose the Asia market as the start of the day.
The default setting is set to 4 as of Nov 1st 2021
The GMT offset puts the calculation in the correct place regardless of exchange timezone so you do not need to adjust any settings
when working with exchanges not on UTC+0
Psy levels works only on exchanges that are open on the weekends that provide with 24x7 data.
The GMT offset puts the calculation in the correct place regardless of exchange timezone.
Features:
1) Plot the current Daily Open for timeframes between 4 hour and 1 min.
2) Plot the current weekly Psychological High and Low for timeframes between 4 hour and 1 min.
3) Configurable GMT offset, default set to Sydney open (as defined above)
4) Toggle to show historical Daily Open values (line)
5) Toggle to show historical Psychological High and Low values (line)
6) Turn labels on and off
7) Change line/label colors
Foot notes:
Use at your own risk and your own responsibility. No guarantees are provided and no responsibility is assumed by the developers of this script.
Original @plasmapug, additional edits (with permission) by @infernixx and @Peshocore
INSECURITY() from @JayRogers (enhanced for gmt offset)
TradingGroundhog - Fundamental Analysis - Multiple RSI Ema(Script Available Version of my previous Fundamental Analysis - Multiple RSI Ema )
As the number of crypto currencies is expanding, we need to find the one which will boom in the next months, weeks or even days.
Therefore, I present to you a Fundamental Analysis tool based on RSI built in order to compare the RSI between the diverse cryptocurrencies.
When cryptocurrencies start to trend, become active, minable and especially "buyable", people are investing their money into them.
As a result,the Daily RSI rises and the price of the crypto in question increases steadily.
With "Fundamental Analysis - Multiple RSI EMA" you can :
Follow up to 20 RSI from different exchanges at the same time.
Find easily Increasing/Decreasing RSI as the lines get transparent if their RSI decrease.
You can also select market with high potential of booming as :
Booming Market : 60 < Daily RSI <= 100 (Strong green background)
Potent Market : 55 < Daily RSI <= 60 (Light green background)
Sleepy Market : 50 < Daily RSI <= 55 (Light red background)
Dying Market : 0 < Daily RSI <= 50 (Strong red background)
Futur booming crypto will go from the Potent Market to the Booming Market
Can be used with the following time frames depending on the necessity:
4H
Daily (Preferred)
Weekly
Monthly
Good trades !
Disclaimer (As it should always be one to any script)
***
This script is intended for and only to be used for personal purposes only. No such information provided by it constitutes advice or a recommendation for any investment or trading strategy for any specific person. There is no guarantee presented or implied as to the accuracy of specific forecasts, projections, or predictive statements offered by the script. Users of the script agree that its original developer does not take responsibility for any of your investment decisions. Please seek professional advice before trading.
***

Horizontal Line At Daily Moving AveragesThis script allows you to see the major daily moving average levels on a smaller time frame.
One challenge with day trading is, when trading on a smaller time frame, you are not paying as much attention to the daily price levels. One solution might be to select a chart layout on Tradingview which allows you to see both the daily and a smaller time frame at the same time. However, this approach takes up valuable screen space. All you are really looking for is the significant daily price level and the price action near that level. This script allows you to merge the 2 goals on 1 chart. You have the smaller time frame open to monitor detailed price action and horizontal lines at the major moving average levels.
Red: 9 EMA
Navy: 20 MA
Green: 50 MA
Blue: 100 MA
Purple: 200 MA

Ticker Dashboard For Better Stock SelectionHey, this indicator will help you with your stock selection. The goal is to focus on stocks that move (higher ADR) and provide enough liquidity which means less risk.
ADR - Average Daily Range in % (measured from High to Low - does not include gaps like ATR does / Threshold color can be adjusted from input)
%Change - Current % change from prior close price
Vol- Todays Volume in MIO
ADV- Average Daily Volume in MIO - default set to 1 month (20 days, can be changed from input - Colored red if < 1 MIO)
$VOL- Dollar Volume - Average Daily Volume multiplied with the last daily close price. Important for liquidity issues.
MTF Key Levels - Support and ResistanceThis indicator shows how to Multi Time Frame (MTF) interpret levels:
Watch how price acts around these levels and how they can act as support/resistance and can be used as great confluence levels for your technical analysis.
This indicator displays:
VWAP Levels
Daily / Weekly / Monthly / Yearly
Within the chart above I have marked out how displaying these VWAP levels can provide support and resistance levels to be aware of.
Daily – Weekly - Monthly – Yearly Levels
O = Open / H = High / L = Low
pO = Previous Open / pH = Previous High / pL = Previous Low / pEQ = Previous Equlibrium
Having previous Low/High levels makes you aware of Swing Failure Patterns (SFP). Also the daily/weekly/monthly opening and previous opening can assist with the trend.
Daily Open: Gives you an idea who is in control for the day. This level very often acts as strong support or resistance.
Weekly Open: Indicates where the price is within the higher timeframe.
Monthly Open & Yearly Levels: Overview of direction for the whole month without looking at a monthly chart and Yearly chart
Line Options
Within the line options you can choose to have a clean chart and display a “short line”. These line length can be adjusted by the user.
Line just to the right.
Line across the screen.
Disclaimer: The Monthly and Yealy VWAP will only show on higher timeframes this is due to restriction of how many candles can be shown on the chart. The candles displayed need to go back to either the start of the month of year to be able to calculate their VWAPs.

Financial Astrology Crypto ML Daily TrendThis daily trend indicator is based on financial astrology cycles detected with advanced machine learning techniques for the crypto-currencies research portfolio: ADA, BAT, BNB, BTC, DASH, EOS, ETC, ETH, LINK, LTC, XLM, XMR, XRP, ZEC and ZRX. The daily price trend is forecasted through this planets cycles (angular aspects, speed, declination), fast ones are based on Moon, Mercury, Venus and Sun and Mid term cycles are based on Mars, Vesta and Ceres. The combination of all this cycles produce a daily price trend prediction that is encoded into a PineScript array using binary format "0 or 1" that represent sell and buy signals respectively. The indicator provides signals since 2021-01-01 to 2022-12-31, the past months signals purpose is to support backtesting of the indicator combined with other technical indicator entries like MAs, RSI or Stochastic. For future predictions besides 2022 a machine learning models re-train phase will be required.
The resolution of this indicator is 1D, you can tune a parameter where you can determine how many future bars of daily trend are plotted and adjust an hours shift to anticipate future signals into current bar in order to produce a leading indicator effect to anticipate the trend changes with some hours of anticipation. Combined with technical analysis indicators this daily trend is very powerful because can help to produce approximately 60% of profitable signals based on the backtesting results. You can look at our open source Github repositories to validate accuracy using the backtesting strategies we have implemented in Jesse Crypto Trading Framework as proof of concept of the predictive potential of this indicator. Alternatively, we have implemented a PineScript strategy that use this indicator, just consider that we are pending to do signals update to the period July 2021 to December 2022: This strategy have accumulated more than 110 likes and many traders have validated the predictive power of Financial Astrology.
DISCLAIMER: This indicator is experimental and don’t provide financial or investment advice, the main purpose is to demonstrate the predictive power of financial astrology. Any allocation of funds following the documented machine learning model prediction is a high-risk endeavour and it’s the users responsibility to practice healthy risk management according to your situation.

Multi Time Frame Bollinger Bands(Daily/4H/1H)/MTFボリンジャーバンドJapanese below. / 日本語説明は下記
-----Republishing after issues resolved.---------
Summary
This indicator shows 3 multi time frame Bollinger bands (MTF BB) from different time frames which is daily, 4 hour and 1 hour to lower time frames with 3 bands(+-1-3ς).
Example: If you set daily BB, it will be shown on daily, 4hour, 1hour, 30M, 15M, 5M and 1M charts. It will not appear on weekly and monthly charts as it is not necessary to see it on higher time frames.
Purpose
This indicator has been developed to show higher timeframe’s BB as they are expected to work as support and resistance .
How is it different from other BB indicators?
Problems with other conventional BB indicators are;
-If you set higher timeframe BB(MTF BB), it will also be shown on further higher time frames.
i.e. If you set 4hour chart BB on 1 hour or lower time frame charts, it will also appear on daily and weekly chart, which is not necessary.
-One indicator displays one BB only which impacts the number of indicators that you can set(depending on your account plan)
-One indicator displays one band only. If you need 1-3ς, you need to add the same BB indicator.
To tackle these problems, this indicator has incorporated functions below.
-Control timeframes where BB is displayed to eliminate unnecessary information on higher time frames.
-One indicator contains 3 BB with 3 bands(minus 1-3ς & plus 1-3ς) which contributes to save the number of indicators that you can set.
These are the value added on this indicator.
Spec
-This indicator shows daily BB, 4 hour BB and 1 hour BB.
To be clear, daily BB means that BB created based on daily chart , which can be shown on lower timeframes.
-Each BB displays 3 bands(minus 1-3ς & plus 1-3ς) and middle line
-Display of each band can be parameterized to show and not to show
e.g. Showing only plus/minus 2 and 3ς etc.
-The middle line adopts SMA ( simple moving average ) only and you can set period of SMA .
-Each BB will be shown as follows based on timeframes that you select.
Daily BB: Shown on daily, 4hour, 1 hour, 30M, 15M, 5M and 1M chart
(Weekly and Monthly chart does not show BB)
4hour BB: Shown on 4hour, 1 hour, 30M, 15M, 5M and 1M chart
(Daily, Weekly and Monthly chart does not show BB)
1hour BB: Shown on 1 hour, 30M, 15M, 5M and 1M chart
(4hour, Daily, Weekly and Monthly chart does not show BB)
-Each BB can be enabled and disabled by ticking checkbox.
e.g. On 1 hour chart, you can disable 4 hour BB and show daily BB only etc.
Please see the sample chart below.
Sample chart with the indicator
Daily chart
4hour chart showing daily BB and 4H BB
1hour chart showing daily BB, 4H BB and 1H BB
5Mchart showing daily BB, 4H BB and 1H BB
Journey to use indicator
This indicator is paid indicator and invited-only indicator.
Please contact me via private chat or follow links in my signature so that we can initiate the process to access the indicator
--------------------------------------------------------------------------------------------------
日足、4時間足、1時間足の3つのボリンジャーバンド(プラスマイナス1-3シグマのバンド)を下位足含めて表示するマルチタイムフレームボリンジャーバンドのインジケーターです。
インジケーターの目的
上位足のボリンジャーバンドを下位足に表示することで、レジサポの判断に使うことを想定しています。
他のボリンジャーバンドインジケーターとの違い
他のボリンジャーバンドインジケーターでは、よく以下の問題に直面します。
・上位足のボリンジャーバンドを表示しようとすると、さらに上位足でもそのバンドが表示されチャートがみにくくなる。
例: 4時間足のボリンジャーバンドを下位足で表示可能な様に設定すると、日足や週足でも表示され、チャートがノイズだらけに・・・
・一つのインジケーターでは一つのボリンジャーバンドのみ表示。異なる時間軸のボリンジャーバンドを表示しようとするとその数だけインジケーターを追加する必要あり。
・バンドが一つしか設定できず、1-3シグマまで表示しようとするとインジケーターを追加する必要がある。
これらの問題に対して、このインジケーターでは、
・ボリンジャーバンドを表示する時間軸を制御することで上位足側で不必要な情報を表示させない。これによりチャートをスッキリ見やすくすることができる。
・一つのインジケーターで3つの異なる時間軸のボリンジャーバンドを表示し、かつそれぞれでプラスマイナス1-3のバンドを表示することでインジケーター数を節約。
という機能を加えることでこれらの問題を解決しています。
これがこのインジケーターが提供する付加価値だと考えています。
仕様
機能概要
・このインジケーターでは日足、4時間足、1時間足の3つの時間軸のボリンジャーバンドを表示します。
・それぞれのボリンジャーバンドはプラスマイナス1-3シグマまでのバンドと基準線を表示します。
・各バンドは表示・非表示の切り替えが可能です。(例: プラスマイナス2、3シグマのみ表示など)
・各ボリンジャーバンドの基準線(ミドルライン)はSMA(単純移動平均線)です。移動平均線の期間は自由に設定できます。
・各ボリンジャーバンドは表示しているチャートの時間軸に応じて以下の様に表示されます。
日足のボリンジャーバンド : 日足, 4時間足、1時間足、30分足、15分足、5分足、1分足チャートにのみ表示(週足以上では非表示の仕様です。)
4時間足のボリンジャーバンド : 4時間足、1時間足、30分足、15分足、5分足、1分足チャートにのみ表示(日足以上では非表示の仕様です。)
1時間足のボリンジャーバンド : 1時間足、30分足、15分足、5分足、1分足チャートにのみ表示(4時間足以上では非表示の仕様です。)
・各ボリンジャーバンドは表示・非表示のフラグをON/OFFにすることで表示を制御することができます。
例えば1時間足のチャートでは日足のボリンジャーバンドのみを表示し、4時間足のボリンジャーバンドを表示させない、など。
サンプルチャート
日足
日足では日足ボリンジャーバンドしか表示されない設定ですので、4時間足や1時間足の設定が邪魔になりません。
ここが他のボリンジャーバンドインジケーターと違う点です。
4時間足
4時間足に日足と4時間足のボリンジャーバンドを表示した状態です。不要な場面では両方もしくはいずれか一方を非表示にすることができます。
1時間足
1時間足に日足と4時間足と1時間足のボリンジャーバンドを表示した状態です。
5分足
5分足に全てのボリンジャーバンドを表示したチャートです。
短期トレードで上位足ボリンジャーバンドによる反発を狙う時などに活用できるのではないでしょうか。
インジケーターの使用について
当インジケーターは招待制インジケーター(有料)となっています。
使用を希望される方はプライベートチャットや下記リンクのDMでご連絡ください。
このページのコメント欄はインジケーターそのものに対するコメントやアップデートの記載のためのものとなっております。Tradingviewのハウスルールを守るためにもコメント欄からの連絡はご遠慮ください。
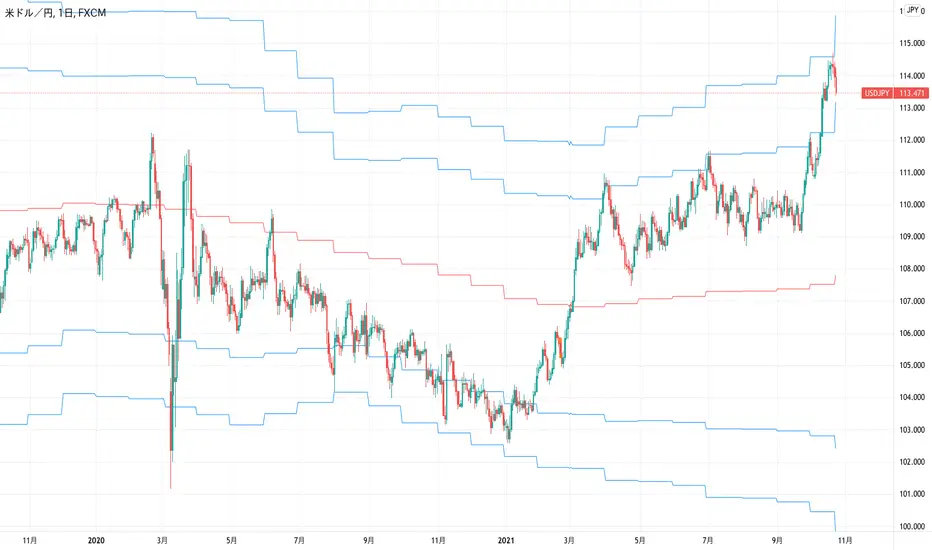
Alternative Daily Reference Points for Intra-hour ChartsThis is a different version of my www.tradingview.com used high, lows and pivots. One problem with pivot points is the number of calculation methods. The alternative version shows historical lows, closes, highs one basic period back.
► On lower timeframes - hour or less - this will show High, Low and Close from the previous day, two days ago, the previous week and two weeks ago and VWAP.
► On 1h daily reference points need to be enabled. On higher timeframes, daily reference points will not be shown. On the daily chart, weekly levels need to be enabled to still show and will be disabled on all higher periods.
► It is configured only for normal timeframes. If you use something like 17-minutes timeframe, you will have to allow this timeframe in the code.
Bear in mind, using all lines at the same time can be a little confusing and price doesn't react to every one of them. You can probably disable lows in the uptrend or scratch closes to simplify your chart.
Have a great trade!

EMA with time-interval dependant visiblity settingThis scrip exposes 4 Exponential Moving Average (EMA) indicators which their visibility can be set to a daily or weekly time-frame (aka intervals). Based on your current chart time-frame, the matching EMA indicators come on and off.
This helps to have meaningful EMAs relevant to your time internal.
In a traditional 10 EMA indicates a plotted indicator would bear a meaning of a 10 day EMA when in daily and 10 week EMA when in weekly chart which may or may not be useful as some who for example only require a 10 week EMA for thier analysis and wouldn't want to cloud a daily chart with an EMA which won't resemble a valuable output for this particular user.
With EMA+, you can choose to see the 10 week EMA only when your chart is in the weekly time interval, so when switched to a daily interval a 10x EMA is not shown anymore.
If you prefer to see a 10 week EMA and a 21 day EMA on the other hand, you will only have 1 EMA shown when in weekly mode which is a 10 week EMA and one EMA when in daily mode with is 21 day EMA.

$0 Monthly Weekly & Daily OHLC Viewer
Visualizer of current or previous month(s), week(s) & days ranges
Purpose: View last Monthly, Weekly, Daily, and/or a custom time interval OHLC, i.e. previously closed/confirmed or the ongoing higher time interval ranges
Main configurations available:
- 2 main reporting modes: View the current/ongoing M/W/D candles' OHLC (live, repaints) or report OHLC of last closed ones, i.e. previous Montly, Weekly and/or Daily
- View only latest Monthly, Weekly and/or Daily OHLC (lines) or all past ones (~channel)
- Set your own time interval for its price range(s) to be reported, e.g. last quarter '3M', 12H '720', or hide it
- View one specific day of the week OHLC reported all over the week
Graphic/visual configuration:
- Show the High & Low levels or not
- Show the Open & close levels or not
- Display a background color between top & down or lines only
- Change the background color depending if is/was rising or falling price
- Highlight the top & down breaches of higher timeframe resolution candles: Daily breaching last Weekly range, and/or the Weekly the Monthly one
- Colors & styling can be edited from the indicator's styling configuration panel
Depending on its expected usage, those configurations enable to:
- Consider previously closed candles OLHC as reference top & down ranges (support & resistance, breaches)
- Review chart's current candles evolution within their higher time interval / candle (M/W/D)
- Consider specific week days' range as a reference for the week trend
- Have a general overview of the market evolution trends
Default config is to view current candles evolving within their higher time interval / candle, while reporting last previously closed M+W is a preferred usage. Play with the config settings to find your setup.
View ongoing M+W+D OHLC with dynamic background color:
View previously closed M+W+D OHLC:
View closed H&L for M+W+D, latest only:
View Mondays' OHLC:
Feedback & support welcome.

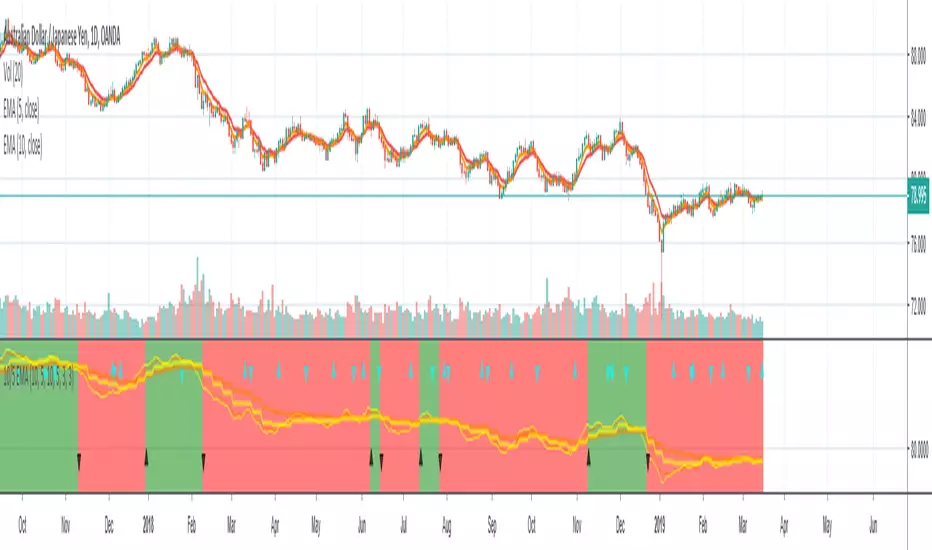
Current vs. Average price performance (daily and weekly)This indicator is to be used only by the values it gives back, don't use the lines .
In "current week days" choose number of days that already BEGAN this week (ex. on Wednesday type 3)
Green1 - Current Daily Range
Orange1 - Average Daily Range
Green2 - Current Weekly Range
Red1 - Average Weekly Range
Orange2 - Today's price movement compared to the average daily price movement (in percentage)
Red2 - This week price movement compared to the average weekly price movement (in percentage)
By these values you can check how price performed today and this week in comparison to the average daily and weekly values - you can check with some probability if the movement is already exhausted or price can do some more action.

Pivot Points Daily and WeeklyThis will let trader see Daily and Weekly Pivot points with R/S5.
Daily Pivot point line --> Orange Color
Daily R1-5 ---> Black circles
Daily S1-5 ---> Black circles
Weekly Pivot lines ---> Purple Color
Weekly R1-5 ---> Red Circles
Weekly S1-5 ---> Red Circles

10/5 Weekly/Daily EMAs with ConfirmationsPlots Daily and Weekly 10 & 5 EMAs (but fully customizable to your own).
In addition to plotting the EMAs it color coordinates trend bias and has cross confirmation signals.
Philosophy and how to read:
I use this indicator when trading strictly on the daily timeframe. I have not tested it on other timeframes.
In my trade system I start with both the monthly and weekly charts to define overall bias.
Here’s the general rule of thumb.
10 EMA is direction (bias) and 5 EMA is price.
If 5EMA is below 10EMA there is a bear bias. If 5EMA is above 10EMA there is a bull bias.
This indicator will plot both the daily and weekly 10 & 5 EMAs.
It will also color code the background based on how these EMAs relate to each other.
Light red typically is just the daily is confirmed bear (typically because it could be either or)
Dark red, both daily and weekly in confirmed bear.
Light green, typically just daily is confirmed bull (typically because it could be either or)
Dark green, both daily and weekly in confirmed bull.
In addition to background highlight there is confirmation crosses.
The daily confirmation cross is default yellow triangle.
Down triangle is 5 crossing the 10 downward.
Up triangle is the 5 crossing the 10 upward.
The weekly confirmation is the same only is aqua color.
Generally, on a color change you want to see one or both confirmation in the direction of the bias change.
If you only want to plot the daily bias in the options unclick the setting: Include Weekly Background Plotting. Unclicking this will remove the background coloring for the weekly bias. This might be helpful if you only want to see the strength of what the weekly timeframe is telling you.
Also, I’m primarily a trend trader but I also do have a reversal system I trade with lower R:R parameters.
A good reversal confirmation signal I’ve noticed is the instrument that you are trading should go through a cycle of light color to dark color.
You could also create alerts with this indicator based on just signals. When the signal fires the value will be 1.
Future Updates:
I want to find some way to correlate the distance between these EMAs to enhance the signal. Also to include a velocity component. Plus a few more things.
If you like this indicator please like and leave a comment down below.
Binque's Multi-Moving Average Binque's Multi-Moving Average - One indicator with four simple moving average and four exponential moving averages, plus as a bonus a Day High moving average and a Day Low Moving Average.
Simple Moving Average or MA(14), MA(50), MA(100) and MA(200) all in one indicator
Exponential Moving Average or EMA(8), EMA(14), EMA(20) and EMA(33) all in one indicator
Day High Moving Average - Tracks the Daily High versus most moving averages track the daily close.
Day Low Moving Average - Tracks the Daily Low versus most moving average track the daily close.
To Disable moving averages, Set the color to the chart background and then set the length to 1 and uncheck.
I Use the Daily High Moving Average to track upward resistance in a stock movement for Swing Trading.
I Use the Daily Low Moving Average to track my trailing stop in a stock movement for Swing Trading.

CM_Pivot Points Daily To IntradayNew Pivots Indicator With Options for Daily, 4 Hour, 2 Hour, 1 Hour, 30 Minute Pivot Levels!
Great for Forex Traders! - Take a Look at Chart with Weekly, Daily, and 4 Hour levels. Weekly Pivots Indicator is separate - Link is Below.
Plot one Pivot Level or Multiple at the Same Time via Check Boxes in the Inputs tab.
Defaults to 4 Hour Pivot Levels - Adjust in Inputs Tab.
S3 and R3 are turned off by Default - You can Activate Them In The Inputs Tab.
These Intraday Options were Requested By Users Using My CM_ Pivots Point Custom Indicator that Plots Daily, Weekly, Monthly, Quarterly, and Yearly Pivot Levels. Link is Below.
Now Both Longer-Term Traders and Shorter Term Traders Have All The Pivot Levels They Need. From Yearly Levels All The Way Down to 30 Minute Levels!
***The Candles On The Chart Are Custom Heikin-Ashi Paint Bars. Link is Below
CM_ Pivot Points Custom
Daily, Weekly, Monthly, Quarterly, Yearly Pivot Levels
Heikin-Ashi Paint Bars

Session Levels (Daily & Weekly Targets)This indicator provides market structure and contextual reference only. It does not generate trade signals, entries, or trading advice.
Plots rolling previous daily and weekly highs/lows as potential target levels. Levels automatically remove once touched (including wicks). Default visibility is NY session with optional toggles for London and Asia. Designed for intraday structure, confluence, and target identification.

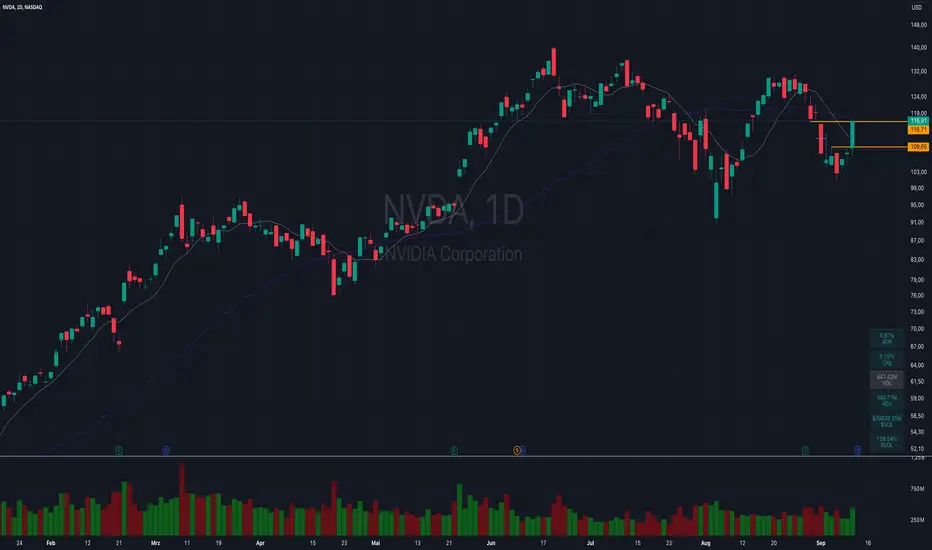
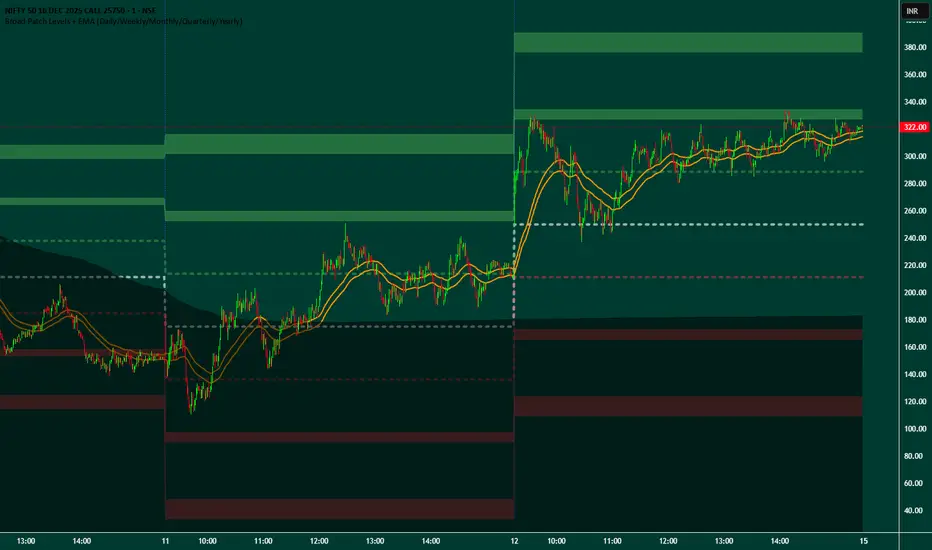
Broad Patch Levels + EMA (Daily/Weekly) with Directional AlertsThis indicator provides dynamic support and resistance levels along with trend guidance using EMA lines for daily or weekly timeframes. It is fully customizable, offering toggles for individual levels, trend lines, and alert notifications.
Key highlights:
Clearly visualize key market levels for potential trade entries and exits.
Monitor trend direction with EMA-based guidance.
Receive alerts when price interacts with important levels or trend zones.
Configurable visibility and alert options for a clean and personalized chart layout.
Ideal for professional traders looking for a structured, easy-to-read market perspective without exposing proprietary methods or calculations.
Golden Cross RSI Daily Helper (US Stocks)//@version=5
indicator("Golden Cross RSI Daily Helper (US Stocks)", overlay=true, timeframe="D", timeframe_gaps=true)
//========= الإعدادات الأساسية =========//
emaFastLen = input.int(50, "EMA سريع (اتجاه قصير المدى)")
emaSlowLen = input.int(200, "EMA بطيء (اتجاه طويل المدى)")
rsiLen = input.int(14, "فترة RSI")
rsiMin = input.float(40.0, "حد RSI الأدنى للدخول", 0.0, 100.0)
rsiMax = input.float(60.0, "حد RSI الأعلى للدخول", 0.0, 100.0)
slBufferPerc = input.float(1.5, "نسبة البفر لوقف الخسارة (%) أسفل/أعلى EMA200", 0.1, 5.0)
rrRatio = input.float(2.0, "نسبة العائد إلى المخاطرة (R:R)", 1.0, 5.0)
//========= حساب المؤشرات =========//
emaFast = ta.ema(close, emaFastLen)
emaSlow = ta.ema(close, emaSlowLen)
rsiVal = ta.rsi(close, rsiLen)
// اتجاه السوق
trendUp = emaFast > emaSlow
trendDown = emaFast < emaSlow
// ارتداد السعر من EMA50 أو EMA200 تقريبياً
bounceFromEmaFast = close > emaFast and low <= emaFast
bounceFromEmaSlow = close > emaSlow and low <= emaSlow
bounceLong = bounceFromEmaFast or bounceFromEmaSlow
bounceFromEmaFastShort = close < emaFast and high >= emaFast
bounceFromEmaSlowShort = close < emaSlow and high >= emaSlow
bounceShort = bounceFromEmaFastShort or bounceFromEmaSlowShort
// فلتر RSI
rsiOk = rsiVal >= rsiMin and rsiVal <= rsiMax
//========= شروط الدخول =========//
// شراء
longSignal = trendUp and bounceLong and rsiOk
// بيع
shortSignal = trendDown and bounceShort and rsiOk
//========= حساب وقف الخسارة والأهداف =========//
// نستخدم سعر إغلاق شمعة الإشارة كسعر دخول افتراضي
entryPriceLong = close
entryPriceShort = close
// وقف الخسارة حسب EMA200 + البفر
slLong = emaSlow * (1.0 - slBufferPerc / 100.0)
slShort = emaSlow * (1.0 + slBufferPerc / 100.0)
// المسافة بين الدخول ووقف الخسارة
riskLong = math.max(entryPriceLong - slLong, syminfo.mintick)
riskShort = math.max(slShort - entryPriceShort, syminfo.mintick)
// هدف الربح حسب R:R
tpLong = entryPriceLong + rrRatio * riskLong
tpShort = entryPriceShort - rrRatio * riskShort
//========= الرسم على الشارت =========//
// رسم المتوسطات
plot(emaFast, title="EMA 50", color=color.new(color.blue, 0), linewidth=2)
plot(emaSlow, title="EMA 200", color=color.new(color.orange, 0), linewidth=2)
// تلوين الخلفية حسب الاتجاه
bgcolor(trendUp ? color.new(color.green, 92) : trendDown ? color.new(color.red, 92) : na)
// إشارة شراء
plotshape(
longSignal,
title = "إشارة شراء",
style = shape.triangleup,
location = location.belowbar,
size = size.large,
color = color.new(color.green, 0),
text = "BUY")
// إشارة بيع
plotshape(
shortSignal,
title = "إشارة بيع",
style = shape.triangledown,
location = location.abovebar,
size = size.large,
color = color.new(color.red, 0),
text = "SELL")
// رسم SL و TP عند ظهور الإشارة
slPlotLong = longSignal ? slLong : na
tpPlotLong = longSignal ? tpLong : na
slPlotShort = shortSignal ? slShort : na
tpPlotShort = shortSignal ? tpShort : na
plot(slPlotLong, title="وقف خسارة شراء", color=color.new(color.red, 0), style=plot.style_linebr)
plot(tpPlotLong, title="هدف شراء", color=color.new(color.green, 0), style=plot.style_linebr)
plot(slPlotShort, title="وقف خسارة بيع", color=color.new(color.red, 0), style=plot.style_linebr)
plot(tpPlotShort, title="هدف بيع", color=color.new(color.green, 0), style=plot.style_linebr)
//========= إعداد التنبيهات =========//
alertcondition(longSignal, title="تنبيه إشارة شراء", message="إشارة شراء: ترند صاعد + ارتداد من EMA + RSI في المنطقة المسموحة.")
alertcondition(shortSignal, title="تنبيه إشارة بيع", message="إشارة بيع: ترند هابط + ارتداد من EMA + RSI في المنطقة المسموحة.")

Weekly Moving Average50, 21, 200 & Daily 200This indicator plots key higher-timeframe moving averages on any chart:
Weekly 50 SMA (orange) – medium-term trend guide.
Weekly 21 EMA (lime) – faster trend and pullback zone.
Weekly 70 EMA (pink/purple) – swing trend and “deeper dip” buy/sell area.
Weekly 200 & 300 SMA (red / blue) – long-term bull/bear lines and major support/resistance.
Daily 200 SMA (yellow) – classic trend filter for shorter-term trades.
By overlaying weekly and daily MAs on the same chart, this tool helps you quickly see where price is in relation to major trend levels, potential support/resistance zones, and areas of confluence for entries, take-profits, or invalidation levels.
Use it to keep your lower-timeframe trades aligned with the higher-timeframe structure. This is a visual tool for market context only, not financial advice.

TraderForge - Genesis xMA - EMAs + Daily SMAsA clean, powerful multi-MA system designed for momentum and trend clarity on any symbol and any timeframe.
Intraday Momentum:
• EMA 9, 13, and 21 form a responsive ribbon that reveals direction, pullbacks, and acceleration zones.
Higher-Timeframe Trend Structure:
• Daily (or any HTF you choose) SMA 20 / 50 / 200 projected on your chart act as long-range “trend rails,” giving you instant awareness of bullish/bearish bias, mean-reversion zones, and key swing levels.
Fully Editable:
• Change all EMA/SMA lengths
• Select any higher timeframe (default: Daily)
• Turn each group on/off from the settings panel
Simple. Fast. Visual. Perfect for scalping, day trading, or swing analysis.
TraderForge — Simple indicators. Powerful results.

MC2 Daily Screener//@version=5
indicator("MC2 Daily Screener", overlay = false)
// 🔹 Inputs
relVolThresh = input.float(2.0, "RelVol Threshold")
rangeMult = input.float(2.0, "Range Multiplier")
lookback = input.int(20, "Lookback Bars")
// 🔹 Calculations
relVol = volume / ta.sma(volume, lookback)
rangeNow = high - low
rangeAvg = ta.sma(rangeNow, lookback)
// 🔥 MC² condition
mc2 = relVol > relVolThresh and rangeNow > rangeAvg * rangeMult
// 🔹 Convert to numeric (1 = signal, 0 = none)
mc2Value = mc2 ? 1.0 : 0.0
// This plot is what Pine Screener will use as a column/filter
plot(mc2Value, title = "MC2", style = plot.style_columns)
// Optional: alert so you can also use alertconditions in the Screener
alertcondition(mc2, title = "MC2 Signal", message = "MC2 signal on {{ticker}} ({{interval}})")

TraderForge - Genesis Daily ATR HistoryMaps today’s ATR range plus historical days.
Genesis Daily ATR History projects Open Plus ATR and Open Minus ATR for the current session and prior sessions, giving you a clear view of how price reacts to volatility boundaries across multiple days. Perfect for spotting recurring reversal zones, volatility shifts, and range behavior at a glance.
TraderForge – Simple indicators. Powerful results.
