Daily Average True Range OverlayPlots the upper and lower average true range away from the previous days close on all time frames.Pine Script®指標由steakatrisk提供228
Daily Deviations (Lazy Edition) Plots the standard deviation resistance/support lines. Uses Previous days close and the VIX as the volatility factor. credit to u/UberBotMan and u/Living_Granger for the idea and formulas Pine Script®指標由edin228提供101
Daily Deviations (Self Input Version) Plots the standard deviation resistance/support levels. Input the previous settlement price and the implied volatility. credit to u/UberBotMan and u/Living_Granger for the idea and formulas (preview example is using settlement of 2420 and IV of 11)Pine Script®指標由edin228提供11246
Daily Returns & STDWhat happened last time when xx increased by xx%? - Start collecting some stats! You can choose the ticker and the timeframe you're interested in Pine Script®指標由AleksanderThor提供33113
RSI Oversold/UndersoldThe study script will place GREEN BUY arrows BELOW oversold conditions and RED SHORT arrows ABOVE overbought conditions. You can configure the period Most RSI(14) indicators use a 14-period, I prefer a 5-period. The period, overbought and oversold periods are settings that can easily be changed by adding this study to your chart and clicking the "gear" icon next to the study inside your chart.Pine Script®指標由MattDeLong提供77690
Daily Delta Analysis Plotting with 50 and 200 simple moving averagesPine Script®指標由TheBulltrader提供286
Lucia XAUUSD Complete Indicator (FVG, High, Low, OB)This indicator is a complete multi‑timeframe Smart Money Concept toolkit designed specifically for XAUUSD intraday trading. It combines high‑timeframe levels, liquidity, imbalances, order blocks, sessions, and trend tools into one clean overlay indicator with optional labels and alerts. All modules can be enabled or disabled individually in the settings. 📌 Features Overview 1. Previous Day High/Low (D1) Automatically plots the previous day's High and Low. Strong liquidity levels for intraday gold trading. Optional labels: “Daily High (Prev Day)” / “Daily Low (Prev Day)”. Optional alerts for crossing these levels. 2. 4‑Hour Imbalances (H4) Detects newly formed H4 imbalances (Fair Value Gaps). Plots colored boxes for both bullish and bearish imbalances. Optional label: “Imbalance 4H (UP)” “Imbalance 4H (DOWN)” Optional alert when price touches the most recent imbalance. 3. 1‑Hour Fair Value Gaps (H1 FVG) Detects 1H FVGs with clear colored boxes. Shows text labels: “FVG 1H (UP)” “FVG 1H (DOWN)” Optional alert when price enters the latest FVG zone. 4. 1‑Hour Order Blocks + 50% Mean Threshold Detects bullish and bearish 1H Order Blocks based on the previous candle structure. Plots: OB top line OB median line (50% MT level) Text labels: “Order Block 1H (Bull)” “Order Block 1H (Bear)” “MT 50% 1H” Optional alert when price taps the most recent OB. 5. EMAs and VWAP Trend filters: EMA 8 (micro‑trend) EMA 20 (intraday trend) EMA 200 (macro bias) Volume‑weighted trend: VWAP All can be individually toggled ON/OFF. 6. Session Tools Asian Session Range Draws a box for the 00:00–06:59 UTC session. Label: “Asian Range”. London Open Draws a dotted line at 07:00 UTC (≈08:00 CET). Label: “London Open”. Optional alert on price cross. New York Open Draws a solid line at 14:30 UTC (≈15:30 CET). Label: “New York Open”. Optional alert on price cross. 7. H1 Liquidity Levels (Swing High/Low) Detects H1 swing highs and swing lows with pivot settings (left/right bars). Plots thin black dashed lines as liquidity levels. Labels: “H1 Liquidity High” “H1 Liquidity Low” Adjustable: Pivot size Maximum number of lines ON/OFF toggle 📌 Customization Options Label Settings Enable/disable all text labels. Choose label size (tiny, small, normal). Set label background transparency. Session Controls Enable/disable Asian box, London open line, NY open line. Alert Settings Alerts available for: Daily High/Low cross 4H Imbalance touch 1H FVG touch 1H OB touch London/NY open cross You can create alerts using Create Alert → Condition: This indicator → Choose event. 📌 Designed For: XAUUSD intraday trading Smart Money Concepts (SMC) Precision liquidity entries Session trading strategies Confluence stacking (FVG + OB + EMA + VWAP + Liquidity) 📌 Notes Works best on lower timeframes (1m–15m) with higher‑timeframe logic built‑in (H1, H4, D1). All objects (lines, boxes, labels) are optimized to avoid exceeding TradingView limits.Pine Script®指標由lucinka_krchlikova提供3
Parkinson Range Oscillator [BackQuant]Parkinson Range Oscillator Overview Parkinson Range Oscillator is a volatility regime indicator built around the Parkinson volatility estimator , a high-low based variance model originally proposed as a more statistically efficient alternative to close-to-close volatility. Instead of measuring volatility from closing returns, this script measures volatility from the intrabar price range using ln(H/L), then converts it into a normalized oscillator (z-score) so you can identify volatility expansion vs compression relative to the asset’s own history. The indicator is designed to answer questions like: Is volatility currently elevated or suppressed relative to its baseline? Is volatility expanding (risk rising) or compressing (coiling)? How extreme is the current vol state in percentile terms? How does range-based vol compare to a more common ATR-based vol read? It plots: A Parkinson-based volatility z-score oscillator with gradient fills. A signal line (EMA) for expansion/compression transitions. An ATR-based z-score for context comparison. A dashboard with current vol %, z-score, percentile rank, regime label, and ATR z-score. Where Parkinson volatility comes from (origin and intuition) The Parkinson estimator comes from academic finance and the study of volatility estimation. The key insight is simple: The daily high and low contain more information about variability than the close alone. Close-to-close volatility only uses one price per bar (the close), throwing away intrabar information. The high-low range captures the realized dispersion inside the bar, so under ideal assumptions it can estimate variance more efficiently. The Parkinson model is derived assuming: Price follows a continuous-time diffusion process (often framed like geometric Brownian motion). No drift matters for the variance estimate over the interval. No jumps and no microstructure distortions (idealized). Even though real markets violate these assumptions (gaps, jumps, wicks from order flow), the estimator remains useful because: Range is still a strong proxy for realized volatility. It reacts to intrabar expansion earlier than close-based methods. It is less dependent on where the bar closes. Core Parkinson formula (what the script implements) Parkinson variance for a window of n bars is: Var = (1 / (4 * n * ln(2))) * Σ This script computes it in the common rolling form: logHL2 = (ln(high/low))² parkVar = SMA(logHL2, n) / (4 * ln(2)) parkVol = sqrt(parkVar) * 100 Key details: ln(H/L) makes the range scale-invariant (percent-like), so it behaves more consistently across price levels. Squaring gives variance contribution. The 1/(4 ln 2) constant comes from the expected distribution of high-low range under a Brownian diffusion. sqrt converts variance to standard deviation (volatility). *100 expresses it as a percentage for readability. So parkVol is a “range-based realized volatility proxy” in percent terms. Why range-based volatility behaves differently than ATR ATR measures average true range, which is a linear range magnitude measure (high-low plus gaps). Parkinson uses ln(H/L) which is: Log-scaled (closer to a return-based measure). More directly tied to variance estimation theory. In practice: ATR can be driven by gaps and absolute range. Parkinson is driven by proportional range and tends to emphasize how wide the bar is relative to its price level. Parkinson often reacts sharply when wicks expand even if closes are stable. Normalization into an oscillator (making it comparable through time) Raw volatility values are hard to interpret across regimes because every market has different “normal.” This script normalizes Parkinson volatility against its own rolling baseline using a z-score: parkMA = SMA(parkVol, baselineLen) parkSD = stdev(parkVol, baselineLen) osc = (parkVol - parkMA) / parkSD Interpretation: osc = 0 means current vol is at its baseline average. osc = +1 means 1 standard deviation above normal (high vol). osc = -1 means 1 standard deviation below normal (compressed). osc > +2 flags extreme expansion states. This is the core output. It turns “volatility” into “volatility regime” in standardized units. Signal line and expansion/compression transitions The oscillator is smoothed with an EMA to create a signal line: signal = EMA(osc, signalLen) Then transitions are defined as: Expansion cross: crossover(osc, signal) and osc > 0 Compression cross: crossunder(osc, signal) and osc < 0 Why the extra osc > 0 and osc < 0 conditions: It prevents treating small oscillations around zero as meaningful. It forces expansion signals to occur in above-average volatility territory. It forces compression signals to occur in below-average volatility territory. So signals are regime-confirming, not constant cross spam. Percentile rank (how extreme is vol relative to the past) In addition to the z-score, the script computes the percentile rank of the raw Parkinson volatility: pctRank = percentrank(parkVol, pctRankLookback) Interpretation: pctRank near 90–100 means current vol is among the highest levels seen in that lookback. pctRank near 0–10 means it is among the lowest (compression). Z-score tells you “how many SDs from mean.” Percentile tells you “how rare is this state historically.” Those are different but complementary. ATR comparison line (context, not the main engine) The indicator also computes an ATR-based volatility proxy and normalizes it in the same way: atrVol = ATR(n) / close * 100 atrOsc = zscore(atrVol, baselineLen) This gives you a direct visual comparison: If Parkinson oscillator is high but ATR oscillator isn’t, range expansion may be happening in a way ATR is not emphasizing (or vice versa). If both agree, you have stronger confirmation of a true volatility regime shift. ATR is included as a “common benchmark,” not as the primary signal. Regime classification (human-readable state mapping) The script labels regimes from osc: osc > 2.0 → EXTREME osc > 1.0 → HIGH osc > 0.0 → ABOVE AVG osc > -1.0 → BELOW AVG else → COMPRESSED This is a practical mapping for dashboards and quick reads. It is not pretending that 2.0 is a universal constant, it is just a standardized “rare expansion” threshold. Coloring follows the same logic: More positive = more “expansion” coloring (bearCol). More negative = more “compression” coloring (bullCol). Note: the color naming is semantic here: “Low Vol / Compression” is bullCol because compression often precedes trend expansion opportunities. “High Vol / Expansion” is bearCol because high vol often implies risk, disorder, liquidation, or unstable conditions. You can interpret those however you prefer, the tool is measuring volatility regime, not directional bias. Plot design (why the oscillator is split into positive/negative) The oscillator is split into two series: oscPos = osc if osc > 0 else na oscNeg = osc if osc < 0 else na This is purely for visuals: Positive region is drawn with expansion color and expansion gradient fill to zero. Negative region is drawn with compression color and compression gradient fill to zero. This makes it obvious at a glance which side of “normal volatility” you’re on. How to interpret the indicator correctly 1) The oscillator is volatility regime, not price direction High osc does not mean price will go down. It means the market is moving violently relative to its baseline. That can occur in: Selloffs, liquidations, panic. Breakouts and momentum expansions. News-driven repricing. Low osc does not mean price will go up. It means the market is quiet relative to baseline: Ranges, coils, low realized movement. Slow grind trends with suppressed pullbacks. Pre-breakout compressions. 2) Compression regimes are often “setup states” When osc is deeply negative (compressed), it often indicates that realized movement has collapsed. In many markets this precedes: Breakouts (vol expansion from compression). Trend acceleration. Mean reversion bursts. But compression can also persist. This is why the script includes signal crosses and percentile rank to judge when compression is shifting. 3) Expansion regimes are often “risk states” When osc is positive and rising, the environment is more chaotic: Stops are more likely to be hit. Mean reversion can get violent. Trend continuation can be strong but timing becomes harder. In those regimes, the tool can be used to: Reduce leverage. Widen stops (if your system supports it). Switch to volatility-aware sizing. Wait for stabilization if you trade mean reversion. 4) Use percentile rank to identify “rare” volatility Two markets can both show osc = +1, but one might be at the 95th percentile and the other at the 70th depending on distribution shape. Percentile tells you whether the current vol is truly rare in that lookback. Cross dots (how to treat them) ExpansionCross and CompressionCross are not buy/sell signals. They are “volatility phase change” markers: ExpansionCross: vol regime moving up, above baseline, acceleration risk increases. CompressionCross: vol regime moving down, below baseline, quieting environment. These are useful for: Strategy toggles (trend mode vs chop mode). Sizing changes. Timing filters (avoid entries during extreme expansion if your edge hates noise). Dashboard (what it gives you at a glance) The table summarizes everything that matters without you needing to interpret plots manually: Parkinson Vol %: current raw range-based volatility level. Z-Score: current standardized regime reading. Percentile: rarity of current vol in the lookback. Regime: discrete label based on z-score thresholds. ATR Z-Score: comparison metric in standardized units. The dashboard is positioned and sized via inputs so it can fit different chart layouts. Parameter tuning guidance Parkinson Length Controls how quickly the raw Parkinson vol responds: Shorter = more reactive to immediate range changes. Longer = smoother volatility estimate, less noisy. Baseline Length Controls what “normal” means: Long baseline (like 100) creates stable regime definitions. Short baseline makes z-scores jump around and can overreact. Signal Length Controls how quickly you detect regime turning points: Short signal = more crosses, earlier detection, more noise. Long signal = fewer crosses, later detection, cleaner regime shifts. Percentile Lookback Controls rarity context: 252 approximates one trading year on daily charts. On intraday, it becomes “252 bars,” so adjust to match your horizon. Limitations and what to watch for Parkinson assumes continuous diffusion. Jumps and gaps can distort it. Wicks caused by illiquidity can inflate ln(H/L) and produce false “expansion.” Z-score assumes the baseline distribution is reasonably stable. If volatility distribution shifts structurally, your z-scores can be biased until baseline catches up. Percentile rank is lookback-dependent. Different lookbacks can change “rarity” classification materially. Summary Parkinson Range Oscillator converts a statistically grounded high-low volatility estimator into a regime oscillator by z-scoring Parkinson volatility against its own rolling baseline. It highlights expansion vs compression states with clear gradients, flags volatility phase changes via oscillator-signal crosses, ranks current volatility by percentile for rarity context, and overlays an ATR-based z-score for comparison. This makes it a practical tool for volatility-aware trading, regime filtering, sizing adjustments, and identifying compression-to-expansion transitions.Pine Script®指標由BackQuant提供10
Smart Money Concepts AI - AdaptiveSmart Money Concepts AI scores every Fair Value Gap and Order Block with a 5-factor quality engine so you can instantly see which zones are worth trading and which are noise. ◈ How It Works This indicator detects three core Smart Money / ICT concepts and layers an AI scoring system on top. Market Structure tracks swing highs and lows to identify Break of Structure (BOS) and Change of Character (CHoCH). BOS means the trend is continuing. CHoCH means it may be reversing. The indicator automatically classifies each break and draws labeled lines on your chart. CHoCH lines are solid and thicker since they're the more significant events. BOS lines are dashed. Both can be toggled independently. Fair Value Gaps (FVGs) are 3-candle imbalances where price moved so fast it left a gap. The indicator detects these automatically and draws scored boxes on the chart. Each FVG gets a quality score from 0 to 100. Higher-scored zones appear more vivid; lower-scored zones fade out. When price fills the gap (mitigation), the box turns dashed. Order Blocks (OBs) are the last opposite candle before a structural break. They represent institutional accumulation or distribution. When a bullish CHoCH/BOS fires, the indicator looks back for the last bearish candle near the swing low and marks it as a demand zone. Bearish OBs work in reverse. Each OB is scored by displacement strength, volume, and trend alignment. ◈ The AI Scoring Engine Every zone gets a 0-100 quality score based on 5 factors: For FVGs: Gap Size vs ATR: sweet spot is 0.3x to 1.5x ATR. Too small = noise, too big = likely fills fast Displacement Strength: body-to-range ratio of the middle candle. Full-body candles = institutional conviction Volume: displacement candle volume vs 20-period average Trend Alignment: does the FVG direction match the EMA trend? Structure Alignment: does it align with the current BOS/CHoCH direction? For Order Blocks: OB Size: tighter zones (0.3-1.0 ATR) score higher for precision Post-OB Displacement: how far price moved after leaving the OB. Bigger moves = stronger institutional interest Volume, Trend, and Structure: same alignment checks as FVGs The score directly controls visual opacity. High-scoring zones are vivid and prominent, low-scoring zones are subtle and transparent. You can filter to "High Only" to hide zones scoring below 50. ◈ Signals Signals fire when price enters a scored FVG zone with structural and trend alignment. If a scored Order Block overlaps the FVG, the score increases further. ★ Bright signals = high confluence (score ≥ 70 default). FVG + OB overlap + structure + trend all confirm. ○ Dim signals = moderate confluence (score ≥ 50). The setup exists but not all factors align perfectly. By default, only ★ bright signals are shown to keep the chart clean. You can enable dim signals in settings if you want to see every zone touch. A configurable cooldown (default 10 bars) prevents signal spam. All signals are non-repainting. They only appear on confirmed bar closes. ◈ How to Read the Dashboard SMC AI ◈: header Structure: current direction (▲ BULLISH / ▼ BEARISH / — RANGING) with bias label Trend(50): whether the EMA trend agrees with structure (✓ ALIGNED = go / ✗ COUNTER = caution) Best FVG: quality score of the highest-rated active FVG in the current direction, with visual bar Best OB: quality score of the highest-rated active Order Block, with visual bar Signal: last signal state (★ LONG / ○ SHORT / — WAITING) with the actual entry score Zones: count of active bull/bear FVGs and OBs on chart The Signal row shows the actual score from when the signal fired, so it always matches the label on the chart. ◈ Recommended Settings Forex (EUR/USD, GBP/JPY) 1H to 4H: Swing Length 5, ATR 14, Trend EMA 50, Signal Cooldown 10 Forex scalping 15min: Swing Length 3, ATR 10, Trend EMA 34, Signal Cooldown 5 Crypto (BTC, ETH) 1H to 4H: Swing Length 5, ATR 14, Trend EMA 50, Signal Cooldown 10 Gold / Commodities 4H to Daily: Swing Length 7, ATR 14, Trend EMA 50, Signal Cooldown 15 Indices (NAS100, SPX500) 15min to 1H: Swing Length 3 to 5, ATR 10, Trend EMA 34, Signal Cooldown 8 For aggressive setups: Lower Min Signal Score to 40, enable dim signals, show more FVGs (8 to 10) For conservative setups: Raise Min Signal Score to 70, filter FVGs to "High Only", increase cooldown ◈ Key Features ✓ Non-repainting: all signals confirmed on bar close ✓ AI zone scoring: 5-factor quality engine, 0-100 per zone ✓ Visual hierarchy: opacity reflects score, you instantly see what matters ✓ Mitigation tracking: filled FVGs and broken OBs fade automatically ✓ Rich tooltips: hover any signal for full breakdown ✓ 9 alert conditions: BOS, CHoCH, bull/bear signals, AI-confirmed signals ✓ Signal clutter control: cooldown + dim toggle keeps charts clean ✓ Fully customizable: colors, zone counts, thresholds, all adjustable ✓ 100% original code: not derived from any existing script ◈ What This Is NOT This is not a "paint arrows and win" indicator. SMC/ICT trading requires understanding context. Where is structure pointing? Which zones are institutionally significant? Is the trend aligned? This indicator helps you answer those questions faster by scoring every zone objectively. Always use proper risk management. Past performance does not guarantee future results. Happy trading.Pine Script®指標由DefinedEdge提供10
Xiznit EMA Cross StrategyXiznit EMA Cross Strategy is a robust, filtered trend-following trading system built in Pine Script v6 for TradingView. It improves upon classic EMA crossover signals by incorporating multiple confirmations to reduce whipsaws and fakeouts, while using dynamic risk management to protect capital and let winners run in strong trends. Core Concept The strategy enters trades on Exponential Moving Average (EMA) crossovers (fast EMA crossing above/below slow EMA), but only when the market shows sufficient trend strength and momentum confirmation. This helps focus on higher-probability setups and avoids choppy, range-bound conditions where simple EMA crosses often fail. Key Features & Logic Entry Signals (Filtered for Quality) Long Entry: Fast EMA crosses above Slow EMA AND all filters pass: ADX > user-defined threshold (default 25) — confirms a strong trend. +DI > -DI — confirms bullish directional momentum. Current volume > SMA(volume, length) × multiplier (default 1.5) — ensures volume surge backing the move (reduces low-conviction fakeouts). Short Entry: Fast EMA crosses below Slow EMA AND: ADX > threshold. -DI > +DI (bearish momentum). Volume surge condition. Trades respect the selected direction mode: Long only, Short only, or Both (reversals allowed). Position Management & Exits Initial Stop-Loss: Placed at entry price ± ATR × multiplier (default 1.5× ATR(14)). Visualized as a short red dashed horizontal line for the first 10 bars after entry. Trailing Stop (Chandelier Exit style): Dynamic ATR-based trail: Longs: Trails below price at highest high since entry minus ATR × multiplier (default 3.0). Shorts: Trails above price at lowest low since entry plus ATR × multiplier. Updates every bar to move only in the trade's favor. Visualized as a stepped line on the chart (green/teal for longs, red/maroon for shorts) — only shown while position is open. Breakeven (BE) Move: When unrealized profit reaches RR × initial risk (default RR = 1.0), the stop-loss automatically moves to the exact entry price (breakeven). Triggers a label ("SL → BE") near the current price. Changes trailing line appearance: brighter color (lime for longs, fuchsia for shorts), thicker width, and solid style instead of dashed — clear visual cue that the trade is now risk-free. Exit: Position closes only when price hits the trailing stop (market order at close). No opposite EMA cross exits — allows trades to capture larger moves in trending markets. Visuals on the Chart (Clean & Informative) Fast EMA (orange, thick) and Slow EMA (blue, thick). Entry markers: Green upward triangle below bar + "Long" label for valid longs. Red downward triangle above bar + "Short" label for valid shorts. Trailing stop line (dynamic, position-based). Temporary initial SL dashed red line (fades after 10 bars). Breakeven trigger label and trailing line style/color change. ADX/DMI pane elements (overlaid but visually distinct): ADX line (purple). +DI (green) and -DI (red) lines. Dashed red horizontal at ADX threshold. Small diamond markers on +DI/-DI crossovers. Background fill: light green when ADX > threshold (trending allowed), light gray when below (range-bound, signals blocked). Overall chart background tint: subtle green/gray based on ADX condition for quick trend context. Inputs (Fully Customizable) Fast EMA & Slow EMA lengths (defaults 10 / 20). Trade Direction: Long, Short, or Both. ADX/DMI Length (default 14) and ADX Threshold (default 25.0). Volume SMA Length (default 20) and Volume Multiplier (default 1.5). ATR Length (default 14). Trailing ATR Multiplier (default 3.0 — Chandelier distance). Initial SL ATR Multiplier (default 1.5 — starting risk distance). RR for BE Move (default 1.0 — reward:risk ratio to trigger breakeven). Important Notes & Disclaimers This is a trend-following strategy — performs best in trending markets (e.g., stocks, forex, crypto on higher timeframes like 1H, 4H, Daily). It may underperform or generate few signals in sideways/choppy conditions due to strict ADX + DMI + volume filters. No guarantees of profitability — past backtest results do not predict future performance. Always forward-test, paper trade, and use proper risk management. Designed for illustration and educational purposes only. Not financial advice. Trading involves substantial risk of loss. Uses calc_on_every_tick=true for real-time responsiveness. No pyramiding, fixed quantity sizing (uses strategy defaults — adjust in Settings/Properties tab). Commission, slippage, and realistic fill assumptions should be set in the Strategy Tester for more accurate results.Pine Script®策略由Xiznit提供112
DIGAQM BreakoutDiga QM Breakout chart pattern according to first Qullamaggie setup use it in daily chart, buy if break blue linePine Script®策略由prajogodiga提供1
ZLT - Date and Time MarkerPine Script v5 indicator called “DateTime Marker” that overlays on the chart and marks bars whose timestamp matches a user-defined schedule. When a bar “matches,” it can draw: a vertical line through the bar, a label with a time/date string, and a triangle marker below the bar (always plotted on matches). What you can configure Marker Type (the matching rule) You choose one of five modes: Every Minute Inputs: everyNMinutes (default 15), minuteOffset (default 0) Match condition: minute % everyNMinutes == minuteOffset Example with defaults: marks bars at :00, :15, :30, :45 each hour. Hourly Inputs: everyNHours (default 4), hourlyMinute (default 0) Match condition: hour % everyNHours == 0 AND minute == hourlyMinute Example with defaults: marks bars at 00:00, 04:00, 08:00, 12:00, 16:00, 20:00 (at minute 00). Daily Time Inputs: dailyHour (default 10), dailyMinute (default 0) Match condition: hour == dailyHour AND minute == dailyMinute Example with defaults: marks 10:00 every day. Weekly Day & Time Inputs: weekDay (default Tuesday), weeklyHour (default 16), weeklyMinute (default 0) It converts the weekday name to Pine’s dayofweek number via getDayNumber(). Match condition: dayofweek == targetDay AND hour == weeklyHour AND minute == weeklyMinute Example with defaults: marks Tuesday 16:00. Monthly Date & Time Inputs: monthlyDay (default 2), monthlyHour (default 23), monthlyMinute (default 0) Match condition: dayofmonth == monthlyDay AND hour == monthlyHour AND minute == monthlyMinute Example with defaults: marks the 2nd day of each month at 23:00. Visual settings showLine: whether to draw the vertical line. lineStyle: Solid/Dashed/Dotted (mapped to Pine line styles by getLineStyle()). lineColor, lineWidth: styling for the line (width is rounded to an integer because Pine line width is integer). showLabel: whether to draw a label. labelColor: background color of the label (text is forced white). What happens when a bar matches When isMatch becomes true on a bar: Vertical line: line.new() at that bar’s bar_index, from low to high, extended extend.both (so it spans the full chart vertically). Label: label.new() at the bar’s high, with mode-specific text: Minute/Hourly/Daily: "HH:mm" Weekly: "Tuesday HH:mm" (or whatever day selected) Monthly: "Day 2 - HH:mm" (or chosen day) Triangle marker: plotshape() draws a triangle up below the bar on every match (this happens regardless of showLine / showLabel). Important practical implications This uses the bar’s exchange/chart time (TradingView’s time, hour, minute, etc.), so results depend on the symbol/session and chart timezone settings. On timeframes coarser than 1 minute, “Every Minute” still checks only the bar’s timestamp minute value; it won’t mark intra-bar minutes that don’t exist as separate bars. Because it can create many objects (lines/labels), it sets max_labels_count=500. Lines are not capped here, so very dense marking can still clutter the chart. If you tell me your intended use (e.g., “mark NY open,” “mark every 15m candle close,” “mark macro events weekly”), I can point out whether the current matching logic fits that precisely or needs adjustments (sessions, timezones, avoiding duplicates, limiting lines, etc.).Pine Script®指標由Kaeya提供3
ADR % RangesThis indicator is designed to visually represent percentage lines from the open of the day. The % amount is determined by X amount of the last days to create an average...or Average Daily Range (ADR). 1. ADR Percentage Lines: The core function of the script is to apply lines to the chart that represent specific percentage changes from the daily open. It first calculates the average over X amount of days and then displays two lines that are 1/3rd of that average. One line goes above the other line goes below. The other two lines are the full "range" of the average. These lines can act as boundaries or targets to know how an asset has moved recently. *Past performance is not indicative of current or future results. The calculation for ADR is: Step 1. Calculate Today's Range = DailyHigh - DailyLow Step 2. Store this average after the day has completed Step 3. Sum all day's ranges Step 4. Divide by total number of days Step 5. Draw on chart 2. Customizable Inputs: Users have the flexibility to customize the script through various inputs. This includes the option to display lines only for the current trading day (`todayonly`), and to select which lines are displayed. The user can also opt to show a table the displays the total range of previous days and the average range of those previous days. 3. No Secondary Timeframe: The ADR is computed based on whatever timeframe the chart is and does not reference secondary periods. Therefore the script cannot be used on charts greater than daily. This script is can be used by all traders for any market. The trader might have to adjust the "X" number of days back to compute a historical average. Maybe they only want to know the average over the past week (5 days) or maybe the past month (20 days).Pine Script®指標由GoodGains提供44558
Humble Student OB/OS Trifecta indicatorAfter reading Cam Hui's blog post about his "Trifecta" bottom spotting model I thought I'd try my hand at scripting it as an indicator. The results are pretty close to what he describes. Though the data TradingView feeds me doesn't seem to be identical to what he's using on StockCharts.com the results are close enough that I will call the effort a success worth publishing.Pine Script®指標由gurple提供2294
Mul TF Flow PRO ( 79 Fx )//@version=5 indicator("Multi TF Flow PRO (79 Fx )", overlay=true) // ===== GET CLOSED CANDLES ===== d_open = request.security(syminfo.tickerid, "D", open) d_close = request.security(syminfo.tickerid, "D", close) h4_open = request.security(syminfo.tickerid, "240", open) h4_close = request.security(syminfo.tickerid, "240", close) h1_open = request.security(syminfo.tickerid, "60", open) h1_close = request.security(syminfo.tickerid, "60", close) m15_open = request.security(syminfo.tickerid, "15", open) m15_close = request.security(syminfo.tickerid, "15", close) // ===== FLOW LOGIC ===== dailyFlow = d_close > d_open ? 1 : -1 h4Flow = h4_close > h4_open ? 1 : -1 h1Flow = h1_close > h1_open ? 1 : -1 m15Flow = m15_close > m15_open ? 1 : -1 // ===== COUNT ===== bullCount = (dailyFlow == 1 ? 1 : 0) + (h4Flow == 1 ? 1 : 0) + (h1Flow == 1 ? 1 : 0) + (m15Flow == 1 ? 1 : 0) bearCount = (dailyFlow == -1 ? 1 : 0) + (h4Flow == -1 ? 1 : 0) + (h1Flow == -1 ? 1 : 0) + (m15Flow == -1 ? 1 : 0) // ===== TOTAL FLOW ===== string totalFlow = bullCount > bearCount ? "TOTAL BULLISH" : bearCount > bullCount ? "TOTAL BEARISH" : "NEUTRAL" // ===== CREATE TABLE ===== var table t = table.new(position.top_right, 2, 6, border_width=1) // ===== UPDATE TABLE ===== if barstate.islast table.cell(t, 0, 0, "Timeframe", bgcolor=color.gray, text_color=color.white) table.cell(t, 1, 0, "Flow", bgcolor=color.gray, text_color=color.white) table.cell(t, 0, 1, "Daily") table.cell(t, 1, 1, dailyFlow == 1 ? "Bullish" : "Bearish", text_color=dailyFlow==1?color.lime:color.red) table.cell(t, 0, 2, "4H") table.cell(t, 1, 2, h4Flow == 1 ? "Bullish" : "Bearish", text_color=h4Flow==1?color.lime:color.red) table.cell(t, 0, 3, "1H") table.cell(t, 1, 3, h1Flow == 1 ? "Bullish" : "Bearish", text_color=h1Flow==1?color.lime:color.red) table.cell(t, 0, 4, "15M") table.cell(t, 1, 4, m15Flow == 1 ? "Bullish" : "Bearish", text_color=m15Flow==1?color.lime:color.red) table.cell(t, 0, 5, "TOTAL FLOW") table.cell(t, 1, 5, totalFlow, text_color = totalFlow=="TOTAL BULLISH"?color.lime: totalFlow=="TOTAL BEARISH"?color.red: color.orange, bgcolor = totalFlow=="TOTAL BULLISH"?color.new(color.green,80): totalFlow=="TOTAL BEARISH"?color.new(color.red,80): color.new(color.orange,80)) Pine Script®指標由sakadasakada018提供39
Flow Dashboard PRO ( 79 Fx Create ) sakada//@version=5 indicator("Multi TF Flow Dashboard PRO (Stable)", overlay=true) // ===== GET CLOSED CANDLES ===== d_open = request.security(syminfo.tickerid, "D", open) d_close = request.security(syminfo.tickerid, "D", close) h4_open = request.security(syminfo.tickerid, "240", open) h4_close = request.security(syminfo.tickerid, "240", close) h1_open = request.security(syminfo.tickerid, "60", open) h1_close = request.security(syminfo.tickerid, "60", close) m15_open = request.security(syminfo.tickerid, "15", open) m15_close = request.security(syminfo.tickerid, "15", close) // ===== FLOW LOGIC ===== dailyFlow = d_close > d_open ? 1 : -1 h4Flow = h4_close > h4_open ? 1 : -1 h1Flow = h1_close > h1_open ? 1 : -1 m15Flow = m15_close > m15_open ? 1 : -1 // ===== COUNT ===== bullCount = (dailyFlow == 1 ? 1 : 0) + (h4Flow == 1 ? 1 : 0) + (h1Flow == 1 ? 1 : 0) + (m15Flow == 1 ? 1 : 0) bearCount = (dailyFlow == -1 ? 1 : 0) + (h4Flow == -1 ? 1 : 0) + (h1Flow == -1 ? 1 : 0) + (m15Flow == -1 ? 1 : 0) // ===== TOTAL FLOW ===== string totalFlow = bullCount > bearCount ? "TOTAL BULLISH" : bearCount > bullCount ? "TOTAL BEARISH" : "NEUTRAL" // ===== CREATE TABLE ===== var table t = table.new(position.top_right, 2, 6, border_width=1) // ===== UPDATE TABLE ===== if barstate.islast table.cell(t, 0, 0, "Timeframe", bgcolor=color.gray, text_color=color.white) table.cell(t, 1, 0, "Flow", bgcolor=color.gray, text_color=color.white) table.cell(t, 0, 1, "Daily") table.cell(t, 1, 1, dailyFlow == 1 ? "Bullish" : "Bearish", text_color=dailyFlow==1?color.lime:color.red) table.cell(t, 0, 2, "4H") table.cell(t, 1, 2, h4Flow == 1 ? "Bullish" : "Bearish", text_color=h4Flow==1?color.lime:color.red) table.cell(t, 0, 3, "1H") table.cell(t, 1, 3, h1Flow == 1 ? "Bullish" : "Bearish", text_color=h1Flow==1?color.lime:color.red) table.cell(t, 0, 4, "15M") table.cell(t, 1, 4, m15Flow == 1 ? "Bullish" : "Bearish", text_color=m15Flow==1?color.lime:color.red) table.cell(t, 0, 5, "TOTAL FLOW") table.cell(t, 1, 5, totalFlow, text_color = totalFlow=="TOTAL BULLISH"?color.lime: totalFlow=="TOTAL BEARISH"?color.red: color.orange, bgcolor = totalFlow=="TOTAL BULLISH"?color.new(color.green,80): totalFlow=="TOTAL BEARISH"?color.new(color.red,80): color.new(color.orange,80)) Pine Script®指標由sakadasakada018提供1121
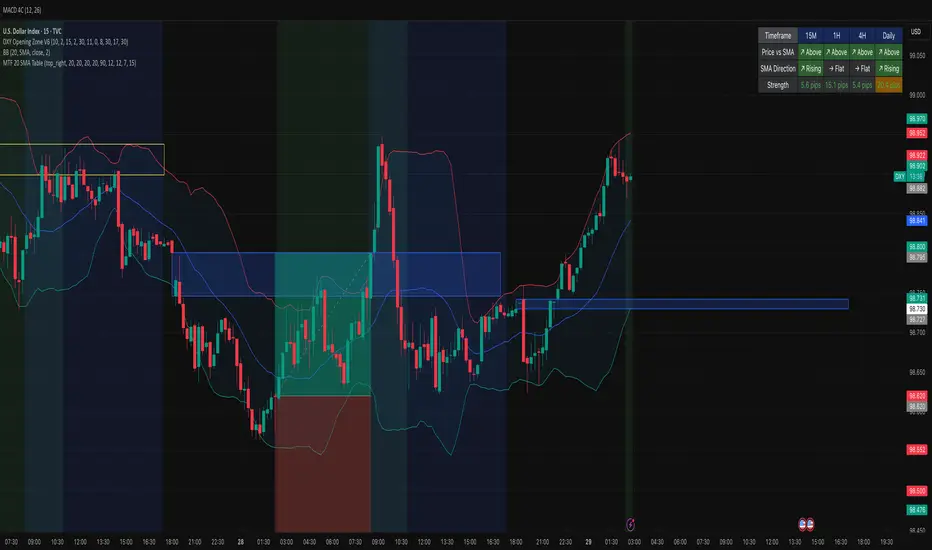
MTF 20 SMA Table - DXY**MTF 20 SMA Table - Multi-Timeframe Trend Analysis Dashboard** **Overview:** This indicator provides a comprehensive multi-timeframe analysis dashboard that displays the relationship between price and the 20-period Simple Moving Average (SMA) across four key timeframes: 15-minute, 1-hour, 4-hour, and Daily. It's designed to help traders quickly identify trend alignment and potential trading opportunities across multiple timeframes at a glance. It's definitely not perfect but has helped me speed up my backtesting efforts as it's worked well for me eliminating flipping back and forth between timeframes excpet when I have confluence on the table, then I check the HTF. **How It Works:** The indicator creates a table overlay on your chart showing three critical metrics for each timeframe: 1. **Price vs SMA (Row 1):** Shows whether price is currently above (bullish) or below (bearish) the 20 SMA - Green = Price Above SMA - Red = Price Below SMA 2. **SMA Direction (Row 2):** Indicates the trend direction of the SMA itself over a lookback period - Green (↗ Rising) = Uptrend - Red (↘ Falling) = Downtrend - Gray (→ Flat) = Ranging/Consolidation 3. **Strength (Row 3):** Displays the distance between current price and the SMA in pips - Purple background = Strong move (>50 pips away) - Orange background = Moderate move (20-50 pips) - Gray background = Weak/consolidating (<20 pips) - Text color: Green for positive distance, Red for negative **Key Features:** - **Customizable Table Position:** Place the table anywhere on your chart (9 position options) - **Adjustable SMA Lengths:** Modify the SMA period for each timeframe independently (default: 20) - **Direction Lookback Settings:** Fine-tune how far back the indicator looks to determine SMA direction for each timeframe - **Flat Threshold:** Set the pip threshold for determining when an SMA is "flat" vs trending (default: 5 pips) - **DXY Optimized:** Calculations are calibrated for the US Dollar Index (1 pip = 0.01) **Best Use Cases:** 1. **Trend Alignment:** Identify when multiple timeframes align in the same direction for higher probability trades 2. **Divergence Spotting:** Detect when lower timeframes diverge from higher timeframes (potential reversals) 3. **Entry Timing:** Use lower timeframe signals while higher timeframes confirm overall trend 4. **Strength Assessment:** Gauge how extended price is from the mean (SMA) to avoid overextended entries **Settings Guide:** - **SMA Settings Group:** Adjust the SMA period for each timeframe (15M, 1H, 4H, Daily) - **SMA Direction Group:** Control lookback periods to determine trend direction - 15M: Default 5 candles - 1H: Default 10 candles - 4H: Default 15 candles - Daily: Default 20 candles - **Flat Threshold:** Set sensitivity for "flat" detection (lower = more sensitive to ranging markets) **Trading Strategy Examples:** 1. **Trend Following:** Look for all timeframes showing the same direction (all green or all red) 2. **Pullback Trading:** When Daily/4H are green but 15M/1H show red, wait for lower timeframes to flip green for entry 3. **Ranging Markets:** When multiple SMAs show "flat", consider range-bound strategies **Important Notes:** - This is a reference tool only, not a standalone trading system - Always use proper risk management and combine with other analysis methods - Best suited for trending instruments like indices and major forex pairs - Calculations are optimized for DXY but can be used on other instruments (pip calculations may need adjustment) **Credits:** Feel free to modify and improve this code! Suggestions for enhancements are welcome in the comments. --- **Installation Instructions:** 1. Add the indicator to your TradingView chart 2. Adjust the table position via settings to avoid overlap with price action 3. Customize SMA lengths and lookback periods to match your trading style 4. Monitor the table for timeframe alignment and trend confirmation --- This indicator is published as open source for the community to learn from and improve upon. Happy trading! 📈Pine Script®指標由stuartm69提供11
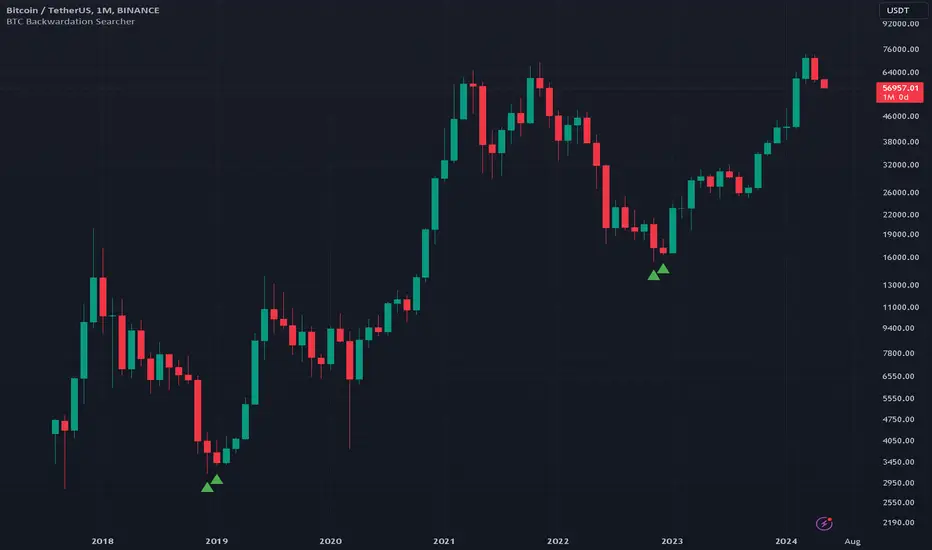
BTC Backwardation SearcherThis Pine Script code is a custom indicator named "BTC Backwardation Searcher" designed for the TradingView platform. The indicator aims to identify and visualize the price difference between two Bitcoin futures contracts: CME:BTC1! and CME:BTC2!. Here's a breakdown of the code: 1. The script fetches the daily close prices of CME:BTC1! and CME:BTC2! using the security() function. 2. It calculates the percentage price difference between the two contracts using the formula: (btc1Price - btc2Price) / btc2Price * 100. 3. The script also calculates the price difference for the previous two days (2 days ago and 3 days ago) using the same formula. 4. Two conditions are defined: (1) dailyGreenCondition: If the price difference is greater than or equal to 0.3% for three consecutive days, including the current day and the previous two days. (2) dailyRedCondition(commented): If the price difference is less than or equal to -1% for three consecutive days, including the current day and the previous two days. (I commented it out because I don't think it's useful.) 5. The plotshape() function is used to display green triangles on the chart when the dailyGreenCondition is met, and red triangles when the dailyRedCondition is met. These triangles are displayed on the daily, weekly, and monthly timeframes. The purpose of this indicator is to help traders identify potential trading opportunities based on the price difference between the two Bitcoin futures contracts. The green triangles suggest a bullish scenario where CME:BTC1! is significantly higher than CME:BTC2!, while the red triangles indicate a bearish scenario where CME:BTC2! is significantly lower than CME:BTC1!. However, it's important to note that this indicator should be used in conjunction with other technical analysis tools and fundamental analysis. Traders should also consider their risk tolerance, investment goals, and market conditions before making any trading decisions based on this indicator.Pine Script®指標由Ikboong提供69
ES Multi-Timeframe SMC Entry SystemOverviewThis is a comprehensive Smart Money Concepts (SMC) trading strategy for ES1! (E-mini S&P 500) futures that provides simultaneous buy and sell signals across three timeframes: Daily, Weekly, and Monthly. It incorporates your complete entry checklists, confluence scoring system, and automated risk management.Core Features1. Multi-Timeframe Signal Generation Daily Signals (D) - For intraday/swing trades (1-3 day holds) Weekly Signals (W) - For swing trades (3-10 day holds) Monthly Signals (M) - For position trades (weeks to months) All three timeframes can trigger simultaneously (pyramiding enabled) 2. Smart Money Concepts ImplementationOrder Blocks (OB) Automatically detects bullish and bearish order blocks Bullish OB = Down candle before strong impulse up Bearish OB = Up candle before strong impulse down Validates freshness (< 10 bars = higher quality) Visual boxes displayed on chart Fair Value Gaps (FVG) Identifies 3-candle imbalance patterns Bullish FVG = Gap between high and current low Bearish FVG = Gap between low and current high Tracks unfilled gaps as targets/entry zones Auto-removes when filled Premium/Discount Zones Calculates 50-period swing range Premium = Upper 50% (short from here) Discount = Lower 50% (long from here) Deep zones (<30% or >70%) for higher quality setups Visual shading: Red = Premium, Green = Discount Liquidity Sweeps Sell-Side Sweep (SSL) = False break below lows → reversal up Buy-Side Sweep (BSL) = False break above highs → reversal down Marked with yellow labels on chart Valid for 10 bars after occurrence Break of Structure (BOS) Identifies when price breaks recent swing high/low Confirms trend continuation Marked with small circles on chart 3. Confluence Scoring SystemEach timeframe has a 10-point scoring system based on your checklist requirements:Daily Score (10 points max) HTF Trend Alignment (2 pts) - 4H and Daily EMAs aligned SMC Structure (2 pts) - OB in correct zone with HTF bias Liquidity Sweep (1 pt) - Recent SSL/BSL occurred Volume Confirmation (1 pt) - Volume > 1.2x 20-period average Optimal Time (1 pt) - 9:30-12 PM or 2-4 PM ET (avoids lunch) Risk-Reward >2:1 (1 pt) - Built into exit strategy Clean Price Action (1 pt) - BOS occurred FVG Present (1 pt) - Near unfilled fair value gap Minimum Required: 6/10 (adjustable)Weekly Score (10 points max) Weekly/Monthly Alignment (2 pts) - W and M EMAs aligned Daily/Weekly Alignment (2 pts) - D and W trends match Premium/Discount Correct (2 pts) - Deep zone + trend alignment Major Liquidity Event (1 pt) - SSL/BSL sweep Order Block Present (1 pt) - Valid OB detected Risk-Reward >3:1 (1 pt) - Built into exit Fresh Order Block (1 pt) - OB < 10 bars old Minimum Required: 7/10 (adjustable)Monthly Score (10 points max) Monthly/Weekly Alignment (2 pts) - M and W trends match Weekly OB in Monthly Zone (2 pts) - OB in deep discount/premium Major Liquidity Sweep (2 pts) - Significant SSL/BSL Strong Trend Alignment (2 pts) - D, W, M all aligned Risk-Reward >4:1 (1 pt) - Built into exit Extreme Zone (1 pt) - Price <20% or >80% of range Minimum Required: 8/10 (adjustable)4. Entry ConditionsDaily Long Entry ✅ Daily score ≥ 6/10 ✅ 4H trend bullish (price > EMAs) ✅ Price in discount zone ✅ Bullish OB OR SSL sweep OR near bullish FVG ✅ NOT during avoid times (lunch/first 5 min)Daily Short Entry ✅ Daily score ≥ 6/10 ✅ 4H trend bearish ✅ Price in premium zone ✅ Bearish OB OR BSL sweep OR near bearish FVG ✅ NOT during avoid timesWeekly Long Entry ✅ Weekly score ≥ 7/10 ✅ Weekly trend bullish ✅ Daily trend bullish ✅ Price in discount ✅ Bullish OB OR SSL sweepWeekly Short Entry ✅ Weekly score ≥ 7/10 ✅ Weekly trend bearish ✅ Daily trend bearish ✅ Price in premium ✅ Bearish OB OR BSL sweepMonthly Long Entry ✅ Monthly score ≥ 8/10 ✅ Monthly trend bullish ✅ Weekly trend bullish ✅ Price in DEEP discount (<30%) ✅ Bullish order block presentMonthly Short Entry ✅ Monthly score ≥ 8/10 ✅ Monthly trend bearish ✅ Weekly trend bearish ✅ Price in DEEP premium (>70%) ✅ Bearish order block present5. Automated Risk ManagementPosition Sizing (Per Entry) Daily: 1.0% account risk per trade Weekly: 0.75% account risk per trade Monthly: 0.5% account risk per trade Formula: Contracts = (Account Equity × Risk%) ÷ (Stop Points × $50) Minimum = 1 contractStop Losses Daily: 12 points ($600 per contract) Weekly: 40 points ($2,000 per contract) Monthly: 100 points ($5,000 per contract) Profit Targets (Risk:Reward) Daily: 2:1 = 24 points ($1,200 profit) Weekly: 3:1 = 120 points ($6,000 profit) Monthly: 4:1 = 400 points ($20,000 profit) Example with $50,000 AccountDaily Trade: Risk = $500 (1% of $50k) Stop = 12 points × $50 = $600 Contracts = $500 ÷ $600 = 0.83 → 1 contract Target = 24 points = $1,200 profit Weekly Trade: Risk = $375 (0.75% of $50k) Stop = 40 points × $50 = $2,000 Contracts = $375 ÷ $2,000 = 0.18 → 1 contract Target = 120 points = $6,000 profit Monthly Trade: Risk = $250 (0.5% of $50k) Stop = 100 points × $50 = $5,000 Contracts = $250 ÷ $5,000 = 0.05 → 1 contract Target = 400 points = $20,000 profit 6. Visual Elements on ChartKey Levels Previous Daily High/Low - Red/Green solid lines Previous Weekly High/Low - Red/Green circles Previous Monthly High/Low - Red/Green crosses Equilibrium Line - White dotted line (50% of range) Zones Premium Zone - Light red shading (upper 50%) Discount Zone - Light green shading (lower 50%) SMC Markings Bullish Order Blocks - Green boxes with "Bull OB" label Bearish Order Blocks - Red boxes with "Bear OB" label Bullish FVGs - Green boxes with "FVG↑" Bearish FVGs - Red boxes with "FVG↓" Liquidity Sweeps - Yellow "SSL" (down) or "BSL" (up) labels Break of Structure - Small lime/red circles Entry Signals Daily Long - Small lime triangle ▲ with "D" below price Daily Short - Small red triangle ▼ with "D" above price Weekly Long - Medium green triangle ▲ with "W" below price Weekly Short - Medium maroon triangle ▼ with "W" above price Monthly Long - Large aqua triangle ▲ with "M" below price Monthly Short - Large fuchsia triangle ▼ with "M" above price 7. Information TablesConfluence Score Table (Top Right) ┌──────────┬────────┬────────┬────────┐ │ TF │ SCORE │ STATUS │ SIGNAL │ ├──────────┼────────┼────────┼────────┤ │ 📊 DAILY │ 7/10 │ ✓ PASS │ 🔼 │ │ 📈 WEEKLY│ 6/10 │ ✗ WAIT │ ━ │ │ 🌙 MONTH │ 9/10 │ ✓ PASS │ 🔽 │ ├──────────┴────────┴────────┴────────┤ │ P&L: $2,450 │ └─────────────────────────────────────┘ Green scores = Pass (meets minimum threshold) Orange/Red scores = Fail (wait for better setup) 🔼 = Long signal active 🔽 = Short signal active ━ = No signal Entry Checklist Table (Bottom Right) ┌──────────────┬───┐ │ CHECKLIST │ ✓ │ ├──────────────┼───┤ │ ━ DAILY ━ │ │ │ HTF Trend │ ✓ │ │ Zone │ ✓ │ │ OB │ ✗ │ │ Liq Sweep │ ✓ │ │ Volume │ ✓ │ │ ━ WEEKLY ━ │ │ │ W/M Align │ ✓ │ │ Deep Zone │ ✗ │ │ ━ MONTHLY ━ │ │ │ M/W/D Align │ ✓ │ │ Zone: Discount│ │ └──────────────┴───┘ Green ✓ = Condition met Red ✗ = Condition not met Real-time updates as market conditions change 8. Alert SystemIndividual Alerts: "Daily Long" - Triggers when daily long setup appears "Daily Short" - Triggers when daily short setup appears "Weekly Long" - Triggers when weekly long setup appears "Weekly Short" - Triggers when weekly short setup appears "Monthly Long" - Triggers when monthly long setup appears "Monthly Short" - Triggers when monthly short setup appears Combined Alerts: "Any Long Signal" - Catches any bullish opportunity (D/W/M) "Any Short Signal" - Catches any bearish opportunity (D/W/M) Alert Messages Include: 🔼/🔽 Direction indicator Timeframe (DAILY/WEEKLY/MONTHLY) Current confluence scorePine Script®策略由Prototype1111提供25
HTF Current/Average RangeThe "HTF(Higher Timeframe) Current/Average Range" indicator calculates and displays the current and average price ranges across multiple timeframes, including daily, weekly, monthly, 4 hour, and user-defined custom timeframes. Users can customize the lookback period, table size, timeframe, and font color; with the indicator efficiently updating on the final bar to optimize performance. When the current range surpasses the average range for a given timeframe, the corresponding table cell is highlighted in green, indicating potential maximum price expansion and signaling the possibility of an impending retracement or consolidation. For day trading strategies, the daily average range can serve as a guide, allowing traders to hold positions until the current daily range approaches or meets the average range, at which point exiting the trade may be considered. For scalping strategies, the 15min and 5min average range can be utilized to determine optimal holding periods for fast trades. Other strategies: Intraday Trading - 1h and 4h Average Range Swing Trading - Monthly Average Range Short-term Trading - Weekly Average Range Also using these statistics in accordance with Power 3 ICT concepts, will assist in holding trades to their statistical average range of the chosen HTF candle. CODE The core functionality lies in the data retrieval and table population sections. The request.security function (e.g., = request.security(syminfo.tickerid, "D", , lookahead = barmerge.lookahead_off)) retrieves high and low prices from specified timeframes without lookahead bias, ensuring accurate historical data. These values are used to compute current ranges and average ranges (ta.sma(high - low, avgLength)), which are then displayed in a dynamically generated table starting at (if barstate.islast) using table.new, with conditional green highlighting when the current range is greater than average range, providing a clear visual cue for volatility analysis. Pine Script®指標由Eightgent7提供20
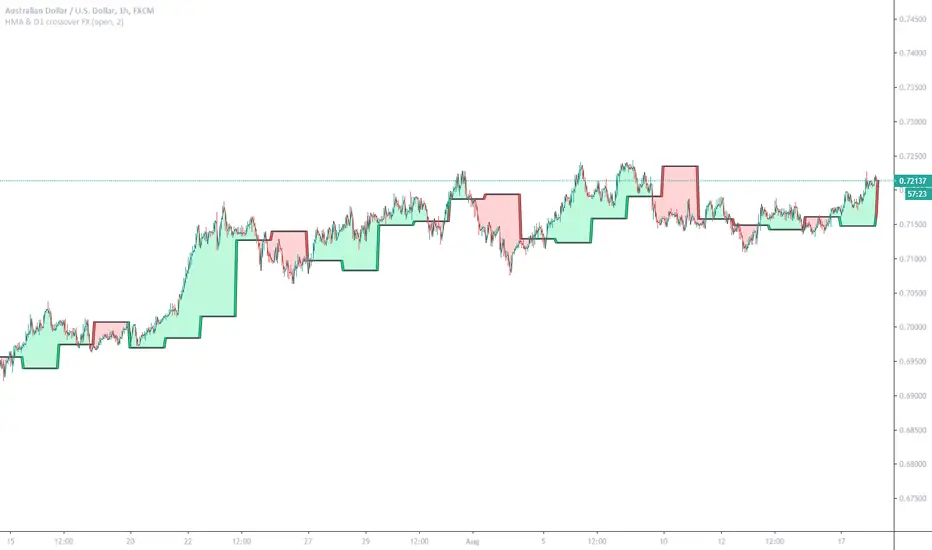
HMA & D1 crossover FX (Study)Can work on other Forex pairs if change settings: Period This example tuned for AUDUSD (FX Version) Enter new order on HMA ( Hull Moving Average ) and D1 ( Daily Candle) crossovers, Exit orders as basket when profit = Your Target Profit This study version built for users of Alerts. Crossover of HMA and DailyCandle1 (and/or DailyCandle1 cross DailyCandle2) (also possible Price cross HMA)Pine Script®指標由SeaSide420提供11176
Luxy Super-Duper SuperTrend Predictor Engine and Buy/Sell signalA professional trend-following grading system that analyzes historical trend patterns to provide statistical duration estimates using advanced similarity matching and k-nearest neighbors analysis. Combines adaptive Supertrend with intelligent duration statistics, multi-timeframe confluence, volume confirmation, and quality scoring to identify high-probability setups with data-driven target ranges across all timeframes. Note: All duration estimates are statistical calculations based on historical data, not guarantees of future performance. WHAT MAKES THIS DIFFERENT Unlike traditional SuperTrend indicators that only tell you trend direction, this system answers the critical question: "What is the typical duration for trends like this?" The Statistical Analysis Engine: • Analyzes your chart's last 15+ completed SuperTrend trends (bullish and bearish separately) • Uses k-nearest neighbors similarity matching to find historically similar setups • Calculates statistical duration estimates based on current market conditions • Learns from estimation errors and adapts over time (Advanced mode) • Displays visual duration analysis box showing median, average, and range estimates • Tracks Statistical accuracy with backtest statistics Complete Trading System: • Statistical trend duration analysis with three intelligence levels • Adaptive Supertrend with dynamic ATR-based bands • Multi-timeframe confluence analysis (6 timeframes: 5M to 1W) • Volume confirmation with spike detection and momentum tracking • Quality scoring system (0-70 points) rating each setup • One-click preset optimization for all trading styles • Anti-repaint guarantee on all signals and duration estimates METHODOLOGY CREDITS This indicator's approach is inspired by proven trading methodologies from respected market educators: • Mark Minervini - Volatility Contraction Pattern (VCP) and pullback entry techniques • William O'Neil - Volume confirmation principles and institutional buying patterns (CANSLIM methodology) • Dan Zanger - Volatility expansion entries and momentum breakout strategies Important: These are educational references only. This indicator does not guarantee any specific trading results. Always conduct your own analysis and risk management. KEY FEATURES 1. TREND DURATION ANALYSIS SYSTEM - The Core Innovation The statistical analysis engine is what sets this indicator apart from standard SuperTrend systems. It doesn't just identify trend changes - it provides statistical analysis of potential duration. How It Works: Step 1: Historical Tracking • Automatically records every completed SuperTrend trend (duration in bars) • Maintains separate databases for bullish trends and bearish trends • Stores up to 15 most recent trends of each type • Captures market conditions at each trend flip: volume ratio, ATR ratio, quality score, price distance from SuperTrend, proximity to support/resistance Step 2: Similarity Matching (k-Nearest Neighbors) • When new trend begins, system compares current conditions to ALL historical flips • Calculates similarity score based on: - Volume similarity (30% weight) - Is volume behaving similarly? - Volatility similarity (30% weight) - Is ATR/volatility similar? - Quality similarity (20% weight) - Is setup strength comparable? - Distance similarity (10% weight) - Is price distance from ST similar? - Support/Resistance proximity (10% weight) - Similar structural context? • Selects the 15 MOST SIMILAR historical trends (not just all trends) • This is like asking: "When conditions looked like this before, how long did trends last?" Step 3: Statistical Analysis • Calculates median duration (most common outcome) • Calculates average duration (mean of similar trends) • Determines realistic range (min to max of similar trends) • Applies exponential weighting (recent trends weighted more heavily) • Outputs confidence-weighted statistical estimate Step 4: Advanced Intelligence (Advanced Mode Only) The Advanced mode applies five sophisticated multipliers to refine estimates: A) Market Structure Multiplier (±30%): • Detects nearby support/resistance levels using pivot detection • If flip occurs NEAR a key level: Estimate adjusted -30% (expect bounce/rejection) • If flip occurs in open space: Estimate adjusted +30% (clear path for continuation) • Uses configurable lookback period and ATR-based proximity threshold B) Asset Type Multiplier (±40%): • Adjusts duration estimates based on asset volatility characteristics • Small Cap / Biotech: +40% (explosive, extended moves) • Tech Growth: +20% (momentum-driven, longer trends) • Blue Chip / Large Cap: 0% (baseline, steady trends) • Dividend / Value: -20% (slower, grinding trends) • Cyclical: Variable based on macro regime • Crypto / High Volatility: +30% (parabolic potential) C) Flip Strength Multiplier (±20%): • Analyzes the QUALITY of the trend flip itself • Strong flip (high volume + expanding ATR + quality score 60+): +20% • Weak flip (low volume + contracting ATR + quality score under 40): -20% • Logic: Historical data shows that powerful flips tend to be followed by longer trends D) Error Learning Multiplier (±15%): • Tracks Statistical accuracy over last 10 completed trends • Calculates error ratio: (estimated duration / Actual Duration) • If system consistently over-estimates: Apply -15% correction • If system consistently under-estimates: Apply +15% correction • Learns and adapts to current market regime E) Regime Detection Multiplier (±20%): • Analyzes last 3 trends of SAME TYPE (bull-to-bull or bear-to-bear) • Compares recent trend durations to historical average • If recent trends 20%+ longer than average: +20% adjustment (trending regime detected) • If recent trends 20%+ shorter than average: -20% adjustment (choppy regime detected) • Detects whether market is in trending or mean-reversion mode Three analysis modes: SIMPLE MODE - Basic Statistics • Uses raw median of similar trends only • No multipliers, no adjustments • Best for: Beginners, clean trending markets • Fastest calculations, minimal complexity STANDARD MODE - Full Statistical Analysis • Similarity matching with k-nearest neighbors • Exponential weighting of recent trends • Median, average, and range calculations • Best for: Most traders, general market conditions • Balance of accuracy and simplicity ADVANCED MODE - Statistics + Intelligence • Everything in Standard mode PLUS • All 5 advanced multipliers (structure, asset type, flip strength, learning, regime) • Highest Statistical accuracy in testing • Best for: Experienced traders, volatile/complex markets • Maximum intelligence, most adaptive Visual Duration Analysis Box: When a new trend begins (SuperTrend flip), a box appears on your chart showing: • Analysis Mode (Simple / Standard / Advanced) • Number of historical trends analyzed • Median expected duration (most likely outcome) • Average expected duration (mean of similar trends) • Range (minimum to maximum from similar trends) • Advanced multipliers breakdown (Advanced mode only) • Backtest accuracy statistics (if available) The box extends from the flip bar to the estimated endpoint based on historical data, giving you a visual target for trend duration. Box updates in real-time as trend progresses. Backtest & Accuracy Tracking: • System backtests its own duration estimates using historical data • Shows accuracy metrics: how well duration estimates matched actual durations • Tracks last 10 completed duration estimates separately • Displays statistics in dashboard and duration analysis boxes • Helps you understand statistical reliability on your specific symbol/timeframe Anti-Repaint Guarantee: • duration analysis boxes only appear AFTER bar close (barstate.isconfirmed) • Historical duration estimates never disappear or change • What you see in history is exactly what you would have seen real-time • No future data leakage, no lookahead bias 2. INTELLIGENT PRESET CONFIGURATIONS - One-Click Optimization Unlike indicators that require tedious parameter tweaking, this system includes professionally optimized presets for every trading style. Select your approach from the dropdown and ALL parameters auto-configure. "AUTO (DETECT FROM TF)" - RECOMMENDED The smartest option: automatically selects optimal settings based on your chart timeframe. • 1m-5m charts → Scalping preset (ATR: 7, Mult: 2.0) • 15m-1h charts → Day Trading preset (ATR: 10, Mult: 2.5) • 2h-4h-D charts → Swing Trading preset (ATR: 14, Mult: 3.0) • W-M charts → Position Trading preset (ATR: 21, Mult: 4.0) Benefits: • Zero configuration - works immediately • Always matched to your timeframe • Switch timeframe = automatic adjustment • Perfect for traders who use multiple timeframes "SCALPING (1-5M)" - Ultra-Fast Signals Optimized for: 1-5 minute charts, high-frequency trading, quick profits Target holding period: Minutes to 1-2 hours maximum Best markets: High-volume stocks, major crypto pairs, active futures Parameter Configuration: • Supertrend: ATR 7, Multiplier 2.0 (very sensitive) • Volume: MA 10, High 1.8x, Spike 3.0x (catches quick surges) • Volume Momentum: AUTO-DISABLED (too restrictive for fast scalping) • Quality minimum: 40 points (accepts more setups) • Duration Analysis: Uses last 15 trends with heavy recent weighting Trading Logic: Speed over precision. Short ATR period and low multiplier create highly responsive SuperTrend. Volume momentum filter disabled to avoid missing fast moves. Quality threshold relaxed to catch more opportunities in rapid market conditions. Signals per session: 5-15 typically Hold time: Minutes to couple hours Best for: Active traders with fast execution "DAY TRADING (15M-1H)" - Balanced Approach Optimized for: 15-minute to 1-hour charts, intraday moves, session-based trading Target holding period: 30 minutes to 8 hours (within trading day) Best markets: Large-cap stocks, major indices, established crypto Parameter Configuration: • Supertrend: ATR 10, Multiplier 2.5 (balanced) • Volume: MA 20, High 1.5x, Spike 2.5x (standard detection) • Volume Momentum: 5/20 periods (confirms intraday strength) • Quality minimum: 50 points (good setups preferred) • Duration Analysis: Balanced weighting of recent vs historical Trading Logic: The most balanced configuration. ATR 10 with multiplier 2.5 provides steady trend following that avoids noise while catching meaningful moves. Volume momentum confirms institutional participation without being overly restrictive. Signals per session: 2-5 typically Hold time: 30 minutes to full day Best for: Part-time and full-time active traders "SWING TRADING (4H-D)" - Trend Stability Optimized for: 4-hour to Daily charts, multi-day holds, trend continuation Target holding period: 2-15 days typically Best markets: Growth stocks, sector ETFs, trending crypto, commodity futures Parameter Configuration: • Supertrend: ATR 14, Multiplier 3.0 (stable) • Volume: MA 30, High 1.3x, Spike 2.2x (accumulation focus) • Volume Momentum: 10/30 periods (trend stability) • Quality minimum: 60 points (high-quality setups only) • Duration Analysis: Favors consistent historical patterns Trading Logic: Designed for substantial trend moves while filtering short-term noise. Higher ATR period and multiplier create stable SuperTrend that won't flip on minor corrections. Stricter quality requirements ensure only strongest setups generate signals. Signals per week: 2-5 typically Hold time: Days to couple weeks Best for: Part-time traders, swing style "POSITION TRADING (D-W)" - Long-Term Trends Optimized for: Daily to Weekly charts, major trend changes, portfolio allocation Target holding period: Weeks to months Best markets: Blue-chip stocks, major indices, established cryptocurrencies Parameter Configuration: • Supertrend: ATR 21, Multiplier 4.0 (very stable) • Volume: MA 50, High 1.2x, Spike 2.0x (long-term accumulation) • Volume Momentum: 20/50 periods (major trend confirmation) • Quality minimum: 70 points (excellent setups only) • Duration Analysis: Heavy emphasis on multi-year historical data Trading Logic: Conservative approach focusing on major trend changes. Extended ATR period and high multiplier create SuperTrend that only flips on significant reversals. Very strict quality filters ensure signals represent genuine long-term opportunities. Signals per month: 1-2 typically Hold time: Weeks to months Best for: Long-term investors, set-and-forget approach "CUSTOM" - Advanced Configuration Purpose: Complete manual control for experienced traders Use when: You understand the parameters and want specific optimization Best for: Testing new approaches, unusual market conditions, specific instruments Full control over: • All SuperTrend parameters • Volume thresholds and momentum periods • Quality scoring weights • analysis mode and multipliers • Advanced features tuning Preset Comparison Quick Reference: Chart Timeframe: Scalping (1M-5M) | Day Trading (15M-1H) | Swing (4H-D) | Position (D-W) Signals Frequency: Very High | High | Medium | Low Hold Duration: Minutes | Hours | Days | Weeks-Months Quality Threshold: 40 pts | 50 pts | 60 pts | 70 pts ATR Sensitivity: Highest | Medium | Lower | Lowest Time Investment: Highest | High | Medium | Lowest Experience Level: Expert | Advanced | Intermediate | Beginner+ 3. QUALITY SCORING SYSTEM (0-70 Points) Every signal is rated in real-time across three dimensions: Volume Confirmation (0-30 points): • Volume Spike (2.5x+ average): 30 points • High Volume (1.5x+ average): 20 points • Above Average (1.0x+ average): 10 points • Below Average: 0 points Volatility Assessment (0-30 points): • Expanding ATR (1.2x+ average): 30 points • Rising ATR (1.0-1.2x average): 15 points • Contracting/Stable ATR: 0 points Volume Momentum (0-10 points): • Strong Momentum (1.2x+ ratio): 10 points • Rising Momentum (1.0-1.2x ratio): 5 points • Weak/Neutral Momentum: 0 points Score Interpretation: 60-70 points - EXCELLENT: • All factors aligned • High conviction setup • Maximum position size (within risk limits) • Primary trading opportunities 45-59 points - STRONG: • Multiple confirmations present • Above-average setup quality • Standard position size • Good trading opportunities 30-44 points - GOOD: • Basic confirmations met • Acceptable setup quality • Reduced position size • Wait for additional confirmation or trade smaller Below 30 points - WEAK: • Minimal confirmations • Low probability setup • Consider passing • Only for aggressive traders in strong trends Only signals meeting your minimum quality threshold (configurable per preset) generate alerts and labels. 4. MULTI-TIMEFRAME CONFLUENCE ANALYSIS The system can simultaneously analyze trend alignment across 6 timeframes (optional feature): Timeframes analyzed: • 5-minute (scalping context) • 15-minute (intraday momentum) • 1-hour (day trading bias) • 4-hour (swing context) • Daily (primary trend) • Weekly (macro trend) Confluence Interpretation: • 5-6/6 aligned - Very strong multi-timeframe agreement (highest confidence) • 3-4/6 aligned - Moderate agreement (standard setup) • 1-2/6 aligned - Weak agreement (caution advised) Dashboard shows real-time alignment count with color-coding. Higher confluence typically correlates with longer, stronger trends. 5. VOLUME MOMENTUM FILTER - Institutional Money Flow Unlike traditional volume indicators that just measure size, Volume Momentum tracks the RATE OF CHANGE in volume: How it works: • Compares short-term volume average (fast period) to long-term average (slow period) • Ratio above 1.0 = Volume accelerating (money flowing IN) • Ratio above 1.2 = Strong acceleration (institutional participation likely) • Ratio below 0.8 = Volume decelerating (money flowing OUT) Why it matters: • Confirms trend with actual money flow, not just price • Leading indicator (volume often leads price) • Catches accumulation/distribution before breakouts • More intuitive than complex mathematical filters Integration with signals: • Optional filter - can be enabled/disabled per preset • When enabled: Only signals with rising volume momentum fire • AUTO-DISABLED in Scalping mode (too restrictive for fast trading) • Configurable fast/slow periods per trading style 6. ADAPTIVE SUPERTREND MULTIPLIER Traditional SuperTrend uses fixed ATR multiplier. This system dynamically adjusts the multiplier (0.8x to 1.2x base) based on: • Trend Strength: Price correlation over lookback period • Volume Weight: Current volume relative to average Benefits: • Tighter bands in calm markets (less premature exits) • Wider bands in volatile conditions (avoids whipsaws) • Better adaptation to biotech, small-cap, and crypto volatility • Optional - can be disabled for classic constant multiplier 7. VISUAL GRADIENT RIBBON 26-layer exponential gradient fill between price and SuperTrend line provides instant visual trend strength assessment: Color System: • Green shades - Bullish trend + volume confirmation (strongest) • Blue shades - Bullish trend, normal volume • Orange shades - Bearish trend + volume confirmation • Red shades - Bearish trend (weakest) Opacity varies based on: • Distance from SuperTrend (farther = more opaque) • Volume intensity (higher volume = stronger color) The ribbon provides at-a-glance trend strength without cluttering your chart. Can be toggled on/off. 8. INTELLIGENT ALERT SYSTEM Two-tier alert architecture for flexibility: Automatic Alerts: • Fire automatically on BUY and SELL signals • Include full context: quality score, volume state, volume momentum • One alert per bar close (alert.freq_once_per_bar_close) • Message format: "BUY: Supertrend bullish + Quality: 65/70 | Volume: HIGH | Vol Momentum: STRONG (1.35x)" Customizable Alert Conditions: • Appear in TradingView's "Create Alert" dialog • Three options: BUY Signal Only, SELL Signal Only, ANY Signal (BUY or SELL) • Use TradingView placeholders: {{ticker}}, {{interval}}, {{close}}, {{time}} • Fully customizable message templates All alerts use barstate.isconfirmed - Zero repaint guarantee. 9. ANTI-REPAINT ARCHITECTURE Every component guaranteed non-repainting: • Entry signals: Only appear after bar close • duration analysis boxes: Created only on confirmed SuperTrend flips • Informative labels: Wait for bar confirmation • Alerts: Fire once per closed bar • Multi-timeframe data: Uses lookahead=barmerge.lookahead_off What you see in history is exactly what you would have seen in real-time. No disappearing signals, no changed duration estimates. HOW TO USE THE INDICATOR QUICK START - 3 Steps to Trading: Step 1: Select Your Trading Style Open indicator settings → "Quick Setup" section → Trading Style Preset dropdown Options: • Auto (Detect from TF) - RECOMMENDED: Automatically configures based on your chart timeframe • Scalping (1-5m) - For 1-5 minute charts, ultra-fast signals • Day Trading (15m-1h) - For 15m-1h charts, balanced approach • Swing Trading (4h-D) - For 4h-Daily charts, trend stability • Position Trading (D-W) - For Daily-Weekly charts, long-term trends • Custom - Manual configuration (advanced users only) Choose "Auto" and you're done - all parameters optimize automatically. Step 2: Understand the Signals BUY Signal (Green Triangle Below Price): • SuperTrend flipped bullish • Quality score meets minimum threshold (varies by preset) • Volume confirmation present (if filter enabled) • Volume momentum rising (if filter enabled) • duration analysis box shows expected trend duration SELL Signal (Red Triangle Above Price): • SuperTrend flipped bearish • Quality score meets minimum threshold • Volume confirmation present (if filter enabled) • Volume momentum rising (if filter enabled) • duration analysis box shows expected trend duration Duration Analysis Box: • Appears at SuperTrend flip (start of new trend) • Shows median, average, and range duration estimates • Extends to estimated endpoint based on historical data visually • Updates mode-specific intelligence (Simple/Standard/Advanced) Step 3: Use the Dashboard for Context Dashboard (top-right corner) shows real-time metrics: • Row 1 - Quality Score: Current setup rating (0-70) • Row 2 - SuperTrend: Direction and current level • Row 3 - Volume: Status (Spike/High/Normal/Low) with color • Row 4 - Volatility: State (Expanding/Rising/Stable/Contracting) • Row 5 - Volume Momentum: Ratio and trend • Row 6 - Duration Statistics: Accuracy metrics and track record Every cell has detailed tooltip - hover for full explanations. SIGNAL INTERPRETATION BY QUALITY SCORE: Excellent Setup (60-70 points): • Quality Score: 60-70 • Volume: Spike or High • Volatility: Expanding • Volume Momentum: Strong (1.2x+) • MTF Confluence (if enabled): 5-6/6 • Action: Primary trade - maximum position size (within risk limits) • Statistical reliability: Highest - duration estimates most accurate Strong Setup (45-59 points): • Quality Score: 45-59 • Volume: High or Above Average • Volatility: Rising • Volume Momentum: Rising (1.0-1.2x) • MTF Confluence (if enabled): 3-4/6 • Action: Standard trade - normal position size • Statistical reliability: Good - duration estimates reliable Good Setup (30-44 points): • Quality Score: 30-44 • Volume: Above Average • Volatility: Stable or Rising • Volume Momentum: Neutral to Rising • MTF Confluence (if enabled): 3-4/6 • Action: Cautious trade - reduced position size, wait for additional confirmation • Statistical reliability: Moderate - duration estimates less certain Weak Setup (Below 30 points): • Quality Score: Below 30 • Volume: Low or Normal • Volatility: Contracting or Stable • Volume Momentum: Weak • MTF Confluence (if enabled): 1-2/6 • Action: Pass or wait for improvement • Statistical reliability: Low - duration estimates unreliable USING duration analysis boxES FOR TRADE MANAGEMENT: Entry Timing: • Enter on SuperTrend flip (signal bar close) • duration analysis box appears simultaneously • Note the median duration - this is your expected hold time Profit Targets: • Conservative: Use MEDIAN duration as profit target (50% probability) • Moderate: Use AVERAGE duration (mean of similar trends) • Aggressive: Aim for MAX duration from range (best historical outcome) Position Management: • Scale out at median duration (take partial profits) • Trail stop as trend extends beyond median • Full exit at average duration or SuperTrend flip (whichever comes first) • Re-evaluate if trend exceeds estimated range analysis mode Selection: • Simple: Clean trending markets, beginners, minimal complexity • Standard: Most markets, most traders (recommended default) • Advanced: Volatile markets, complex instruments, experienced traders seeking highest accuracy Asset Type Configuration (Advanced Mode): If using Advanced analysis mode, configure Asset Type for optimal accuracy: • Small Cap: Stocks under $2B market cap, low liquidity • Biotech / Speculative: Clinical-stage pharma, penny stocks, high-risk • Blue Chip / Large Cap: S&P 500, mega-cap tech, stable large companies • Tech Growth: High-growth tech (TSLA, NVDA, growth SaaS) • Dividend / Value: Dividend aristocrats, value stocks, utilities • Cyclical: Energy, materials, industrials (macro-driven) • Crypto / High Volatility: Bitcoin, altcoins, highly volatile assets Correct asset type selection improves Statistical accuracy by 15-20%. RISK MANAGEMENT GUIDELINES: 1. Stop Loss Placement: Long positions: • Place stop below recent swing low OR • Place stop below SuperTrend level (whichever is tighter) • Use 1-2 ATR distance as guideline • Recommended: SuperTrend level (built-in volatility adjustment) Short positions: • Place stop above recent swing high OR • Place stop above SuperTrend level (whichever is tighter) • Use 1-2 ATR distance as guideline • Recommended: SuperTrend level 2. Position Sizing by Quality Score: • Excellent (60-70): Maximum position size (2% risk per trade) • Strong (45-59): Standard position size (1.5% risk per trade) • Good (30-44): Reduced position size (1% risk per trade) • Weak (Below 30): Pass or micro position (0.5% risk - learning trades only) 3. Exit Strategy Options: Option A - Statistical Duration-Based Exit: • Exit at median estimated duration (conservative) • Exit at average estimated duration (moderate) • Trail stop beyond average duration (aggressive) Option B - Signal-Based Exit: • Exit on opposite signal (SELL after BUY, or vice versa) • Exit on SuperTrend flip (trend reversal) • Exit if quality score drops below 30 mid-trend Option C - Hybrid (Recommended): • Take 50% profit at median estimated duration • Trail stop on remaining 50% using SuperTrend as trailing level • Full exit on SuperTrend flip or quality collapse 4. Trade Filtering: For higher win-rate (fewer trades, better quality): • Increase minimum quality score (try 60 for swing, 50 for day trading) • Enable volume momentum filter (ensure institutional participation) • Require higher MTF confluence (5-6/6 alignment) • Use Advanced analysis mode with appropriate asset type For more opportunities (more trades, lower quality threshold): • Decrease minimum quality score (40 for day trading, 35 for scalping) • Disable volume momentum filter • Lower MTF confluence requirement • Use Simple or Standard analysis mode SETTINGS OVERVIEW Quick Setup Section: • Trading Style Preset: Auto / Scalping / Day Trading / Swing / Position / Custom Dashboard & Display: • Show Dashboard (ON/OFF) • Dashboard Position (9 options: Top/Middle/Bottom + Left/Center/Right) • Text Size (Auto/Tiny/Small/Normal/Large/Huge) • Show Ribbon Fill (ON/OFF) • Show SuperTrend Line (ON/OFF) • Bullish Color (default: Green) • Bearish Color (default: Red) • Show Entry Labels - BUY/SELL signals (ON/OFF) • Show Info Labels - Volume events (ON/OFF) • Label Size (Auto/Tiny/Small/Normal/Large/Huge) Supertrend Configuration: • ATR Length (default varies by preset: 7-21) • ATR Multiplier Base (default varies by preset: 2.0-4.0) • Use Adaptive Multiplier (ON/OFF) - Dynamic 0.8x-1.2x adjustment • Smoothing Factor (0.0-0.5) - EMA smoothing applied to bands • Neutral Bars After Flip (0-10) - Hide ST immediately after flip Volume Momentum: • Enable Volume Momentum Filter (ON/OFF) • Fast Period (default varies by preset: 3-20) • Slow Period (default varies by preset: 10-50) Volume Analysis: • Volume MA Length (default varies by preset: 10-50) • High Volume Threshold (default: 1.5x) • Spike Threshold (default: 2.5x) • Low Volume Threshold (default: 0.7x) Quality Filters: • Minimum Quality Score (0-70, varies by preset) • Require Volume Confirmation (ON/OFF) Trend Duration Analysis: • Show Duration Analysis (ON/OFF) - Display duration analysis boxes • analysis mode - Simple / Standard / Advanced • Asset Type - 7 options (Small Cap, Biotech, Blue Chip, Tech Growth, Dividend, Cyclical, Crypto) • Use Exponential Weighting (ON/OFF) - Recent trends weighted more • Decay Factor (0.5-0.99) - How much more recent trends matter • Structure Lookback (3-30) - Pivot detection period for support/resistance • Proximity Threshold (xATR) - How close to level qualifies as "near" • Enable Error Learning (ON/OFF) - System learns from estimation errors • Memory Depth (3-20) - How many past errors to remember Box Visual Settings: • duration analysis box Border Color • duration analysis box Background Color • duration analysis box Text Color • duration analysis box Border Width • duration analysis box Transparency Multi-Timeframe (Optional Feature): • Enable MTF Confluence (ON/OFF) • Minimum Alignment Required (0-6) • Individual timeframe enable/disable toggles • Custom timeframe selection options All preset configurations override manual inputs except when "Custom" is selected. ADVANCED FEATURES 1. Scalpel Mode (Optional) Advanced pullback entry system that waits for healthy retracements within established trends before signaling entry: • Monitors price distance from SuperTrend levels • Requires pullback to configurable range (default: 30-50%) • Ensures trend remains intact before entry signal • Reduces whipsaw and false breakouts • Inspired by Mark Minervini's VCP pullback entries Best for: Swing traders and day traders seeking precision entries Scalpers: Consider disabling for faster entries 2. Error Learning System (Advanced analysis mode Only) The system learns from its own estimation errors: • Tracks last 10-20 completed duration estimates (configurable memory depth) • Calculates error ratio for each: estimated duration / Actual Duration • If system consistently over-estimates: Applies negative correction (-15%) • If system consistently under-estimates: Applies positive correction (+15%) • Adapts to current market regime automatically This self-correction mechanism improves accuracy over time as the system gathers more data on your specific symbol and timeframe. 3. Regime Detection (Advanced analysis mode Only) Automatically detects whether market is in trending or choppy regime: • Compares last 3 trends to historical average • Recent trends 20%+ longer → Trending regime (+20% to estimates) • Recent trends 20%+ shorter → Choppy regime (-20% to estimates) • Applied separately to bullish and bearish trends Helps duration estimates adapt to changing market conditions without manual intervention. 4. Exponential Weighting Option to weight recent trends more heavily than distant history: • Default decay factor: 0.9 • Recent trends get higher weight in statistical calculations • Older trends gradually decay in importance • Rationale: Recent market behavior more relevant than old data • Can be disabled for equal weighting 5. Backtest Statistics System backtests its own duration estimates using historical data: • Walks through past trends chronologically • Calculates what duration estimate WOULD have been at each flip • Compares to actual duration that occurred • Displays accuracy metrics in duration analysis boxes and dashboard • Helps assess statistical reliability on your specific chart Note: Backtest uses only data available AT THE TIME of each historical flip (no lookahead bias). TECHNICAL SPECIFICATIONS • Pine Script Version: v6 • Indicator Type: Overlay (draws on price chart) • Max Boxes: 500 (for duration analysis box storage) • Max Bars Back: 5000 (for comprehensive historical analysis) • Security Calls: 1 (for MTF if enabled - optimized) • Repainting: NO - All signals and duration estimates confirmed on bar close • Lookahead Bias: NO - All HTF data properly offset, all duration estimates use only historical data • Real-time Updates: YES - Dashboard and quality scores update live • Alert Capable: YES - Both automatic alerts and customizable alert conditions • Multi-Symbol: Works on stocks, crypto, forex, futures, indices Performance Optimization: • Conditional calculations (duration analysis can be disabled to reduce load) • Efficient array management (circular buffers for trend storage) • Streamlined gradient rendering (26 layers, can be toggled off) • Smart label cooldown system (prevents label spam) • Optimized similarity matching (analyzes only relevant trends) Data Requirements: • Minimum 50-100 bars for initial duration analysis (builds historical database) • Optimal: 500+ bars for robust statistical analysis • Longer history = more accurate duration estimates • Works on any timeframe from 1 minute to monthly KNOWN LIMITATIONS • Trending Markets Only: Performs best in clear trends. May generate false signals in choppy/sideways markets (use quality score filtering and regime detection to mitigate) • Lagging Nature: Like all trend-following systems, signals occur AFTER trend establishment, not at exact tops/bottoms. Use duration analysis boxes to set realistic profit targets. • Initial Learning Period: Duration analysis system requires 10-15 completed trends to build reliable historical database. Early duration estimates less accurate (first few weeks on new symbol/timeframe). • Visual Load: 26-layer gradient ribbon may slow performance on older devices. Disable ribbon if experiencing lag. • Statistical accuracy Variables: Duration estimates are statistical estimates, not guarantees. Accuracy varies by: - Market regime (trending vs choppy) - Asset volatility characteristics - Quality of historical pattern matches - Timeframe traded (higher TF = more reliable) • Not Best Suitable For: - Ultra-short-term scalping (sub-1-minute charts) - Mean-reversion strategies (designed for trend-following) - Range-bound trading (requires trending conditions) - News-driven spikes (estimates based on technical patterns, not fundamentals) FREQUENTLY ASKED QUESTIONS Q: Does this indicator repaint? A: Absolutely not. All signals, duration analysis boxes, labels, and alerts use barstate.isconfirmed checks. They only appear after the bar closes. What you see in history is exactly what you would have seen in real-time. Zero repaint guarantee. Q: How accurate are the trend duration estimates? A: Accuracy varies by mode, market conditions, and historical data quality: • Simple mode: 60-70% accuracy (within ±20% of actual duration) • Standard mode: 70-80% accuracy (within ±20% of actual duration) • Advanced mode: 75-85% accuracy (within ±20% of actual duration) Best accuracy achieved on: • Higher timeframes (4H, Daily, Weekly) • Trending markets (not choppy/sideways) • Assets with consistent behavior (Blue Chip, Large Cap) • After 20+ historical trends analyzed (builds robust database) Remember: All duration estimates are statistical calculations based on historical patterns, not guarantees. Q: Which analysis mode should I use? A: • Simple: Beginners, clean trending markets, want minimal complexity • Standard: Most traders, general market conditions (RECOMMENDED DEFAULT) • Advanced: Experienced traders, volatile/complex markets (biotech, small-cap, crypto), seeking maximum accuracy Advanced mode requires correct Asset Type configuration for optimal results. Q: What's the difference between the trading style presets? A: Each preset optimizes ALL parameters for a specific trading approach: • Scalping: Ultra-sensitive (ATR 7, Mult 2.0), more signals, shorter holds • Day Trading: Balanced (ATR 10, Mult 2.5), moderate signals, intraday holds • Swing Trading: Stable (ATR 14, Mult 3.0), fewer signals, multi-day holds • Position Trading: Very stable (ATR 21, Mult 4.0), rare signals, week/month holds Auto mode automatically selects based on your chart timeframe. Q: Should I use Auto mode or manually select a preset? A: Auto mode is recommended for most traders. It automatically matches settings to your timeframe and re-optimizes if you switch charts. Only use manual preset selection if: • You want scalping settings on a 15m chart (overriding auto-detection) • You want swing settings on a 1h chart (more conservative than auto would give) • You're testing different approaches on same timeframe Q: Can I use this for scalping and day trading? A: Absolutely! The preset system is specifically designed for all trading styles: • Select "Scalping (1-5m)" for 1-5 minute charts • Select "Day Trading (15m-1h)" for 15m-1h charts • Or use "Auto" mode and it configures automatically Volume momentum filter is auto-disabled in Scalping mode for faster signals. Q: What is Volume Momentum and why does it matter? A: Volume Momentum compares short-term volume (fast MA) to long-term volume (slow MA). It answers: "Is money flowing into this asset faster now than historically?" Why it matters: • Volume often leads price (early warning system) • Confirms institutional participation (smart money) • No lag like price-based indicators • More intuitive than complex mathematical filters When the ratio is above 1.2, you have strong evidence that institutions are accumulating (bullish) or distributing (bearish). Q: How do I set up alerts? A: Two options: Option 1 - Automatic Alerts: 1. Right-click on chart → Add Alert 2. Condition: Select this indicator 3. Choose "Any alert() function call" 4. Configure notification method (app, email, webhook) 5. You'll receive detailed alerts on every BUY and SELL signal Option 2 - Customizable Alert Conditions: 1. Right-click on chart → Add Alert 2. Condition: Select this indicator 3. You'll see three options in dropdown: - "BUY Signal" (long signals only) - "SELL Signal" (short signals only) - "ANY Signal" (both BUY and SELL) 4. Choose desired option and customize message template 5. Uses TradingView placeholders: {{ticker}}, {{close}}, {{time}}, etc. All alerts fire only on confirmed bar close (no repaint). Q: What is Scalpel Mode and should I use it? A: Scalpel Mode waits for healthy pullbacks within established trends before signaling entry. It reduces whipsaws and improves entry timing. Recommended ON for: • Swing traders (want precision entries on pullbacks) • Day traders (willing to wait for better prices) • Risk-averse traders (prefer fewer but higher-quality entries) Recommended OFF for: • Scalpers (need immediate entries, can't wait for pullbacks) • Momentum traders (want to enter on breakout, not pullback) • Aggressive traders (prefer more opportunities over precision) Q: Why do some duration estimates show wider ranges than others? A: Range width reflects historical trend variability: • Narrow range: Similar historical trends had consistent durations (high confidence) • Wide range: Similar historical trends had varying durations (lower confidence) Wide ranges often occur: • Early in analysis (fewer historical trends to learn from) • In volatile/choppy markets (inconsistent trend behavior) • On lower timeframes (more noise, less consistency) The median and average still provide useful targets even when range is wide. Q: Can I customize the dashboard position and appearance? A: Yes! Dashboard settings include: • Position: 9 options (Top/Middle/Bottom + Left/Center/Right) • Text Size: Auto, Tiny, Small, Normal, Large, Huge • Show/Hide: Toggle entire dashboard on/off Choose position that doesn't overlap important price action on your specific chart. Q: Which timeframe should I trade on? A: Depends on your trading style and time availability: • 1-5 minute: Active scalping, requires constant monitoring • 15m-1h: Day trading, check few times per session • 4h-Daily: Swing trading, check once or twice daily • Daily-Weekly: Position trading, check weekly General principle: Higher timeframes produce: • Fewer signals (less frequent) • Higher quality setups (stronger confirmations) • More reliable duration estimates (better statistical data) • Less noise (clearer trends) Start with Daily chart if new to trading. Move to lower timeframes as you gain experience. Q: Does this work on all markets (stocks, crypto, forex)? A: Yes, it works on all markets with trending characteristics: Excellent for: • Stocks (especially growth and momentum names) • Crypto (BTC, ETH, major altcoins) • Futures (indices, commodities) • Forex majors (EUR/USD, GBP/USD, etc.) Best results on: • Trending markets (not range-bound) • Liquid instruments (tight spreads, good fills) • Volatile assets (clear trend development) Less effective on: • Range-bound/sideways markets • Ultra-low volatility instruments • Illiquid small-caps (use caution) Configure Asset Type (in Advanced analysis mode) to match your instrument for best accuracy. Q: How many signals should I expect per day/week? A: Highly variable based on: By Timeframe: • 1-5 minute: 5-15 signals per session • 15m-1h: 2-5 signals per day • 4h-Daily: 2-5 signals per week • Daily-Weekly: 1-2 signals per month By Market Volatility: • High volatility = more SuperTrend flips = more signals • Low volatility = fewer flips = fewer signals By Quality Filter: • Higher threshold (60-70) = fewer but better signals • Lower threshold (30-40) = more signals, lower quality By Volume Momentum Filter: • Enabled = Fewer signals (only volume-confirmed) • Disabled = More signals (all SuperTrend flips) Adjust quality threshold and filters to match your desired signal frequency. Q: What's the difference between entry labels and info labels? A: Entry Labels (BUY/SELL): • Your primary trading signals • Based on SuperTrend flip + all confirmations (quality, volume, momentum) • Include quality score and confirmation icons • These are actionable entry points Info Labels (Volume Spike): • Additional market context • Show volume events that may support or contradict trend • 8-bar cooldown to prevent spam • NOT necessarily entry points - contextual information only Control separately: Can show entry labels without info labels (recommended for clean charts). Q: Can I combine this with other indicators? A: Absolutely! This works well with: • RSI: For divergences and overbought/oversold conditions • Support/Resistance: Confluence with key levels • Fibonacci Retracements: Pullback targets in Scalpel Mode • Price Action Patterns: Flags, pennants, cup-and-handle • MACD: Additional momentum confirmation • Bollinger Bands: Volatility context This indicator provides trend direction and duration estimates - complement with other tools for entry refinement and additional confluence. Q: Why did I get a low-quality signal? Can I filter them out? A: Yes! Increase the Minimum Quality Score in settings. If you're seeing signals with quality below your preference: • Day Trading: Set minimum to 50 • Swing Trading: Set minimum to 60 • Position Trading: Set minimum to 70 Only signals meeting the threshold will appear. This reduces frequency but improves win-rate. Q: How do I interpret the MTF Confluence count? A: Shows how many of 6 timeframes agree with current trend: • 6/6 aligned: Perfect agreement (extremely rare, highest confidence) • 5/6 aligned: Very strong alignment (high confidence) • 4/6 aligned: Good alignment (standard quality setup) • 3/6 aligned: Moderate alignment (acceptable) • 2/6 aligned: Weak alignment (caution) • 1/6 aligned: Very weak (likely counter-trend) Higher confluence typically correlates with longer, stronger trends. However, MTF analysis is optional - you can disable it and rely solely on quality scoring. Q: Is this suitable for beginners? A: Yes, but requires foundational knowledge: You should understand: • Basic trend-following concepts (higher highs, higher lows) • Risk management principles (position sizing, stop losses) • How to read candlestick charts • What volume and volatility mean Beginner-friendly features: • Auto preset mode (zero configuration) • Quality scoring (tells you signal strength) • Dashboard tooltips (hover for explanations) • duration analysis boxes (visual profit targets) Recommended for beginners: 1. Start with "Auto" or "Swing Trading" preset on Daily chart 2. Use Standard Analysis Mode (not Advanced) 3. Set minimum quality to 60 (fewer but better signals) 4. Paper trade first for 2-4 weeks 5. Study methodology references (Minervini, O'Neil, Zanger) Q: What is the Asset Type setting and why does it matter? A: Asset Type (in Advanced analysis mode) adjusts duration estimates based on volatility characteristics: • Small Cap: Explosive moves, extended trends (+30-40%) • Biotech / Speculative: Parabolic potential, news-driven (+40%) • Blue Chip / Large Cap: Baseline, steady trends (0% adjustment) • Tech Growth: Momentum-driven, longer trends (+20%) • Dividend / Value: Slower, grinding trends (-20%) • Cyclical: Macro-driven, variable (±10%) • Crypto / High Volatility: Parabolic potential (+30%) Correct configuration improves Statistical accuracy by 15-20%. Using Blue Chip settings on a biotech stock may underestimate trend length (you'll exit too early). Q: Can I backtest this indicator? A: Yes! TradingView's Strategy Tester works with this indicator's signals. To backtest: 1. Note the entry conditions (SuperTrend flip + quality threshold + filters) 2. Create a strategy script using same logic 3. Run Strategy Tester on historical data Additionally, the indicator includes BUILT-IN duration estimate validation: • System backtests its own duration estimates • Shows accuracy metrics in dashboard and duration analysis boxes • Helps assess reliability on your specific symbol/timeframe Q: Why does Volume Momentum auto-disable in Scalping mode? A: Scalping requires ultra-fast entries to catch quick moves. Volume Momentum filter adds friction by requiring volume confirmation before signaling, which can cause missed opportunities in rapid scalping. Scalping preset is optimized for speed and frequency - the filter is counterproductive for that style. It remains enabled for Day Trading, Swing Trading, and Position Trading presets where patience improves results. You can manually enable it in Custom mode if desired. Q: How much historical data do I need for accurate duration estimates? A: Minimum: 50-100 bars (indicator will function but duration estimates less reliable) Recommended: 500+ bars (robust statistical database) Optimal: 1000+ bars (maximum Statistical accuracy) More history = more completed trends = better pattern matching = more accurate duration estimates. New symbols or newly-switched timeframes will have lower Statistical accuracy initially. Allow 2-4 weeks for the system to build historical database. IMPORTANT DISCLAIMERS No Guarantee of Profit: This indicator is an educational tool and does not guarantee any specific trading results. All trading involves substantial risk of loss. Duration estimates are statistical calculations based on historical patterns and are not guarantees of future performance. Past Performance: Historical backtest results and Statistical accuracy statistics do not guarantee future performance. Market conditions change constantly. What worked historically may not work in current or future markets. Not Financial Advice: This indicator provides technical analysis signals and statistical duration estimates only. It is not financial, investment, or trading advice. Always consult with a qualified financial advisor before making investment decisions. Risk Warning: Trading stocks, options, futures, forex, and cryptocurrencies involves significant risk. You can lose all of your invested capital. Never trade with money you cannot afford to lose. Only risk capital you can lose without affecting your lifestyle. Testing Required: Always test this indicator on a demo account or with paper trading before risking real capital. Understand how it works in different market conditions. Verify Statistical accuracy on your specific instruments and timeframes before trusting it with real money. User Responsibility: You are solely responsible for your trading decisions. The developer assumes no liability for trading losses, incorrect duration estimates, software errors, or any other damages incurred while using this indicator. Statistical Estimation Limitations: Trend Duration estimates are statistical estimates based on historical pattern matching. They are NOT guarantees. Actual trend durations may differ significantly from duration estimates due to unforeseen news events, market regime changes, or lack of historical precedent for current conditions. CREDITS & ACKNOWLEDGMENTS Methodology Inspiration: • Mark Minervini - Volatility Contraction Pattern (VCP) concepts and pullback entry techniques • William O'Neil - Volume analysis principles and CANSLIM institutional buying patterns • Dan Zanger - Momentum breakout strategies and volatility expansion entries Technical Components: • SuperTrend calculation - Classic ATR-based trend indicator (public domain) • Statistical analysis - Standard median, average, range calculations • k-Nearest Neighbors - Classic machine learning similarity matching concept • Multi-timeframe analysis - Standard request.security implementation in Pine Script For questions, feedback, or support, please comment below or send a private message. Happy Trading!Pine Script®指標由orenluxy提供已更新 4343 3.9 K