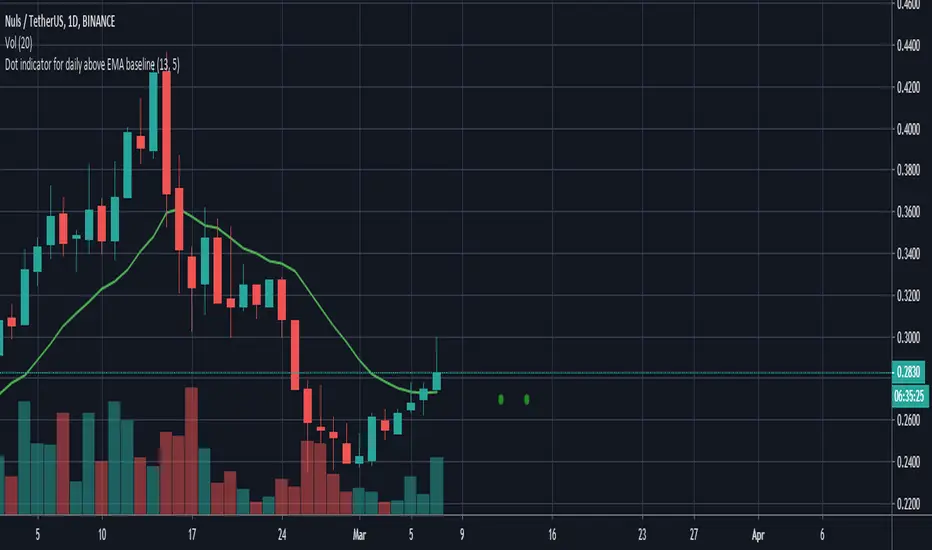
在腳本中搜尋"daily"
Ema Daily In current TimeframeThis simple indicator shows the Ema with data extracted from daily timeframe in your current displayed timeframe.
All my scripts: es.tradingview.com
CL Daily Bitcoin Volume (All exchange included, even Mt.GOX)This daily volume data contains collective total from
____________________________________________________
Historical:
BTC-e BTC/USD (From Q3 2011 to Q3 2016)
BTCChina BTC/CNY (From Q3 2011 to Q2 2017)
Coinsetter BTC/USD (From Q3 2014 to Q1 2016)
MtGox BTC/USD (From July 2010 - 2014 only))
OKcoin International BTC/USD (From Q3 2014 to Q2 2017)
____________________________________________________
Institutions:
CME Bitcoin Futures
Grayscale Bitcoin Trust OTC
____________________________________________________
Spot exchanges:
Bitfinex BTC/USD
Bitstamp BTC/USD
Coinbase BTC/USD
Coinbase BTC/EUR
Binance BTC/USDT
Binance BTC/USDC
Binance BTC/PAX
Gemini BTC/USD
itBit BTC/USD
Kraken BTC/EUR
Kraken BTC/USD
Huobi BTC/USDT
Korbit BTC/KRW
Bitflyer BTC/JPY
____________________________________________________
Others:
Bitmex
Key Distances (Weekly, Daily Open, & EMA)This indicator provides the pip value from various key levels I've found important in my trading system.
The results are graphed. I suggest that you choose the 2 most important ones you want to graph otherwise the indicator gets difficult to read.
The important data is the actual numbers but I've found it helpful to understand how a ticker moves in regards to weekly open and distance from 200EMA to be most helpful.
Here is the order of the data listed:
Distance from weekly open (green if above open, red if below open, also paints color on line)
Distance from last week opening price
Distance from daily open
Distance to 200EMA
Future Possible Updates:
- customized EMA
- Distance from weekly low/high
DRS - Daily Range SystemAn indicator that visualizes the evolution of a daily candle, inspired by a thread on forexfactory: www.forexfactory.com
Applied on a timeframe lower than D (actually lower than H4), it visualizes the evolution of the day's high and low, as well as mid and 25% and 75% lines.
The sole input parameters are the hour at which a day is supposed to start, and the extent of the "trade allowed" region as explained in the FF -1.44% thread.
Always show daily EMAThis script will always plot the daily EMA regardless of which timeframe you are on.
[naoligo] Pivot Points (Daily)Suporte/Resistência do Pivot diário para gráficos intraday
Marcação do S/R tradicional e S/R Fibonacci
Daily Pivot Point Support/Resistances on intraday charts
Both Traditional and Fibonacci methods plotted
Daily Delta TrendDaily Delta Trend is a useful exponential moving average of the 50 day and 200 day simple moving average. In the first Daily Delta Trend I realized that the simple moving averages were pretty choppy as they were buy then sell over short period of times. So I thought taking an average of another average would smooth my results and give it buy and sell signals more clearly. In chart 1, you can see that it is choppy, and in chart 2 is much smoother.
The way I've been interpreting the chart is to trade it only when the 50-day average (GREEN) Trades with 200-day average (RED). For example, when red and green are both >0 = Buy and both <0 = Sell.
Just from a little of pretesting, I was able to find solid trades from multiple pairs.
DISCLAIMER, I have not actually traded this indicator as I just wrote it for the past few hours, But I thought it was interesting and maybe I might trade it. Feel free to play with it and comment back :P
CD_Average Daily Range Zones- highs and lows of the dayUses daily average ranges of 5 and 10 (most used) as buy (support) and highs (resistance) areas - half ranges used in calculations for a more accurate "forecast" of the H and L . Uses open but not close, so it does not repaint - experimental
Open Daily LineThis will place circles on your chart for the opening daily price. If price is above, the circles are green. If price is below, the circles are red. I wanted to be able to see the opening price a bit easier while in smaller time frames.
Consecutive Candle CountAdaptation of www.fxcmapps.com from FXCM's Marketscope
Coded by David Rodriguez, Quantitative Strategist for DailyFX.com
Daily Close GAP Detector [Yosiet]User Manual for "Daily Close GAP Detector "
Overview
This script is designed to help traders identify and react to significant gaps in daily market prices. It plots daily open and close prices and highlights significant gaps with a cross. The script is particularly useful for identifying potential breakouts or reversals based on these gaps.
Configuration
GAP Close Threshold: This input allows you to set a threshold for the gap size that you consider significant. The default value is 0.001.
Timeframe Seeker: This input lets you choose the timeframe for the gap detection. The default is 'D' for daily.
Features
Daily Open and Close Lines: The script plots daily open and close prices. If the close price is lower than the open price, the line is colored red; otherwise, it's green.
Gap Detection: It calculates the difference between the current day's close and the previous day's close, both adjusted for the selected timeframe. If this difference exceeds the threshold, it's considered a significant gap.
Significant Gap Indicator: A cross is plotted on the chart to indicate significant gaps. The color of the cross indicates whether the gap is a short or long gap: red for short gaps and green for long gaps.
Alert Conditions: The script sets up alert conditions for short and long gap breakouts. You can customize the alert messages to include details like the ticker symbol, interval, price, and exchange.
How to Use
Add the Script to Your Chart: Copy the script into the Pine Script editor on TradingView and add it to your chart.
Configure Inputs: Adjust the "GAP Close Threshold" and "Timeframe Seeker" inputs as needed.
Review the Chart: The script will overlay daily open and close prices on your chart, along with crosses indicating significant gaps.
Set Alerts: Use the script's alert conditions to set up alerts for short and long gap breakouts. You can customize the alert messages to suit your trading strategy.
Extending the Code
To extend this script, you can modify the gap detection logic, add more indicators, or integrate it with other scripts for a more comprehensive trading strategy. Remember to test any changes thoroughly before using them in live trading.
Daily Number/Trend Reversal IndicatorIndicator identifies potential price trend exhaustion.
Compares this period against the 4th prior period for the condition.
9 periods (or more) with the same condition is an indicator that the trend is ending soon.
Daily Levels Suite + Market BreadthThere are many levels suites out there but many of them use the line series and/or label series to create multiple levels. Pine v5 provides the capability to use line arrays and labels so I wanted to create some code that is extensible to add additional lines/levels and labels to an array of lines with very little effort.
There is also some Market Breadth info that can be shown in the corners of the chart to allow a user to understand how the broader markets are moving compared to the security they are charting.
Current Levels provided are as follows:
Today's Open
Previous Days Close
Previous Days High/Low
Previous Days 50%
T+2 High/Low
All levels and the market breadth table is configurable to be hidden or shown based upon the user's desire.
Daily Session Windows background highlight indicatorIn intraday studies of stock indexes and Forex I have this weird habit of highlighting premarket, core session, lunch break and extended session with different backgrounds. If done by hand, this is tedious work that has to be repeated daily.
I think this feature should be built-in in TradingView. But it isn't.
For a few months now, I have been using this tiny indicator that does precisely that job. It saved me literally hours of focus time and mistakes. I have decided to revamp it and release it. I'm sure it can be useful to others.
Features:
Background color highlighting for premarket , core session , lunch hour and extended session of the trading day.
Session timing preset to match US session, but can be customized.
Can be enabled or disabled on a day of the week basis, including week-end.
Timezone is selectable, matches the chart's instrument but can be set independently to track a different timezone.
Not affected by the timezone you decided to assign to the chat's time scale.
Ready for stock indexes, but can be used to highlight Forex sessions too.
⭐ Daily Star Finder (Universal)当然,这是一段适合发布在 TradingView 上、用于描述「每日之星」指标的英文介绍文案:
---
### 📈 **Daily Star Indicator** – Breakout Strength Screener
**The Daily Star Indicator** is a technical tool designed to identify potential breakout coins that exhibit strong trend initiation characteristics. It's especially useful for spotting intraday or daily bullish setups in altcoins.
---
### 🔍 **Core Logic**:
This indicator flags a coin when it meets **all of the following breakout conditions**:
* 🔸 **Volume Spike**: Current volume exceeds moving average volume significantly;
* 🔸 **Price Breakout**: Current candle breaks above recent highs (e.g., 20 bars);
* 🔸 **Momentum Strength**: RSI is above a bullish threshold (e.g., >55);
* 🔸 **Positive Price Change**: Candle body shows meaningful gain (e.g., >5%).
When all conditions are met, a ⭐ signal appears above the bar.
---
### 💡 **Use Cases**:
* Perfect for **daily top gainer scanning** on exchanges like OKX or Binance;
* Can be used on both **daily charts** and **15-minute charts** for early detection;
* Works well as part of a larger **“altcoin momentum rotation” strategy**.
---
Let me know if you need a shorter or more casual version (for social posts or scripts).