OPEN-SOURCE SCRIPT
已更新 Key Distances (Weekly, Daily Open, & EMA)
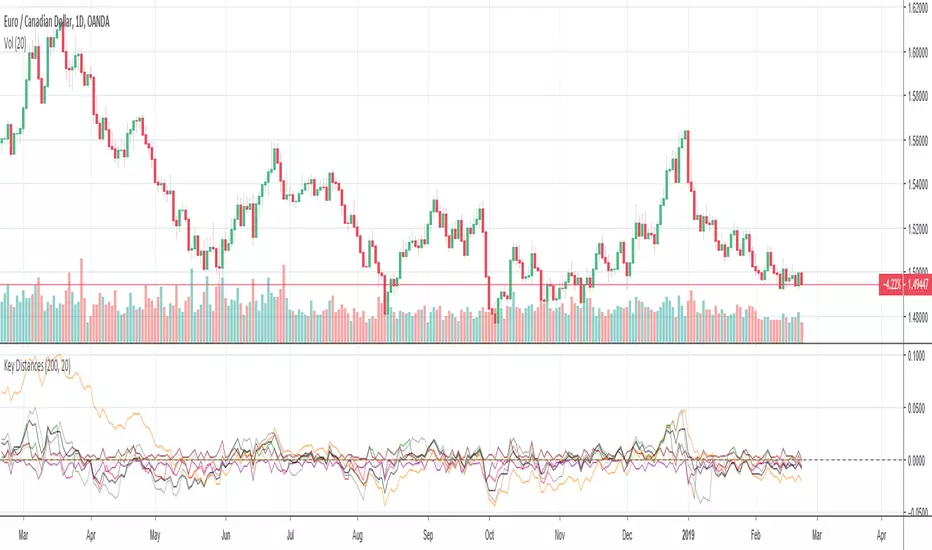
This indicator provides the pip value from various key levels I've found important in my trading system.
The results are graphed. I suggest that you choose the 2 most important ones you want to graph otherwise the indicator gets difficult to read.
The important data is the actual numbers but I've found it helpful to understand how a ticker moves in regards to weekly open and distance from 200EMA to be most helpful.
Here is the order of the data listed:
Future Possible Updates:
- customized EMA
- Distance from weekly low/high
The results are graphed. I suggest that you choose the 2 most important ones you want to graph otherwise the indicator gets difficult to read.
The important data is the actual numbers but I've found it helpful to understand how a ticker moves in regards to weekly open and distance from 200EMA to be most helpful.
Here is the order of the data listed:
- Distance from weekly open (green if above open, red if below open, also paints color on line)
- Distance from last week opening price
- Distance from daily open
- Distance to 200EMA
Future Possible Updates:
- customized EMA
- Distance from weekly low/high
發行說明
Wanted to add some customization and zero line. Here's details to this update:- Zero Line added. Now you can turn on and plot the zero line.
- Added slow EMA input that can be changed (default is 200)
- Added fast EMA input that can be changed (default is 20)
The numbers are what I feel are most important but graphing 1-3 of these numbers can help in possibly getting a good feel of how a ticker moves from these distances or in creating alerts.
發行說明
Added Daily high, low and close.You can turn off or customize all plots. This indicator is primarily used to visually backtest other indicators to look for patterns in price action. So usually just turn on a few plots or use the information panel to get the raw numbers.
開源腳本
本著TradingView的真正精神,此腳本的創建者將其開源,以便交易者可以查看和驗證其功能。向作者致敬!雖然您可以免費使用它,但請記住,重新發佈程式碼必須遵守我們的網站規則。
Get the best... join my Discord: discord.gg/WgjsxVz
免責聲明
這些資訊和出版物並不意味著也不構成TradingView提供或認可的金融、投資、交易或其他類型的意見或建議。請在使用條款閱讀更多資訊。
開源腳本
本著TradingView的真正精神,此腳本的創建者將其開源,以便交易者可以查看和驗證其功能。向作者致敬!雖然您可以免費使用它,但請記住,重新發佈程式碼必須遵守我們的網站規則。
Get the best... join my Discord: discord.gg/WgjsxVz
免責聲明
這些資訊和出版物並不意味著也不構成TradingView提供或認可的金融、投資、交易或其他類型的意見或建議。請在使用條款閱讀更多資訊。