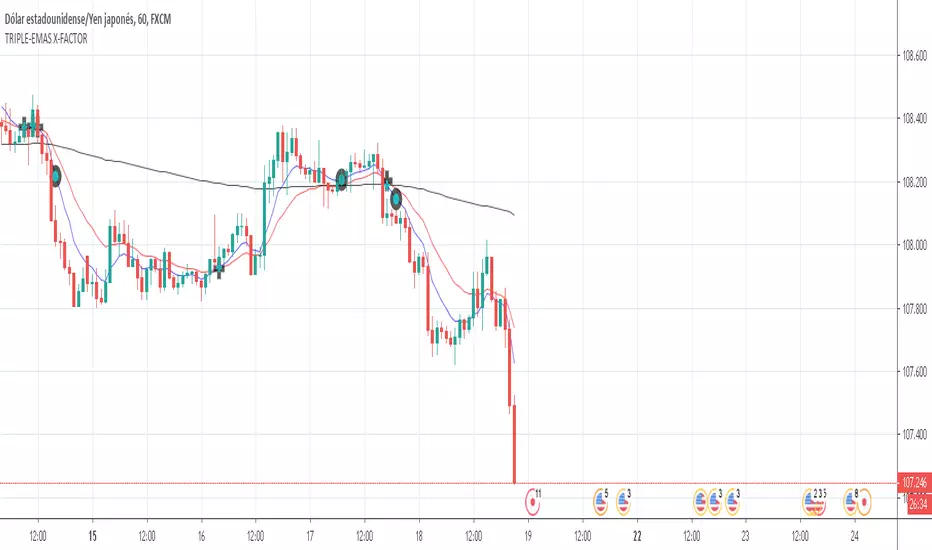
TRIPLE-EMAS X-FACTORindicador que nos simplifica la utilización de las EMAS 8,18 y 200 que utilizaremos para confirmar las entradas de las operaciones. Las EMAS o Medias Móviles Exponenciales nos muestra el valor medio del precio de un instrumento durante un determinado período de tiempo, es decir nos marcan la tendencia momentánea y la tendencia larga.
在腳本中搜尋"ema"
Crypto Investidor EMA e MA Crypto Investidor EMA e MA consiste em um conjunto de 4 EMAs de 21 / 50 / 100 / 200 períodos e também 4 MAs de 21 / 50 / 100 / 200, criado para facilitar o entendimento dos nossos seguidores, a ponto de poder verificar no gráfico tanto as Medias Móveis Exponenciais, quanto as Medias Móveis Simples. Um excelente indicador para quem utiliza o tradingview free.

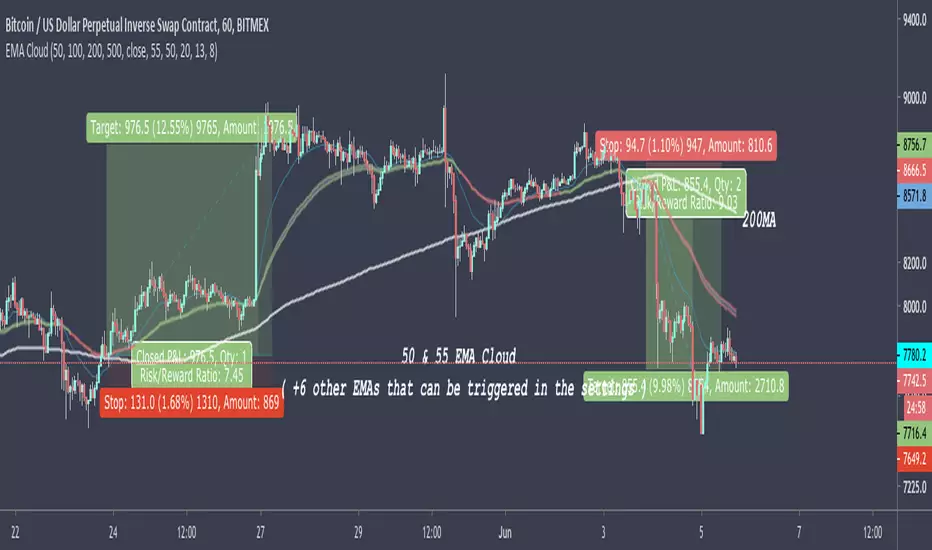
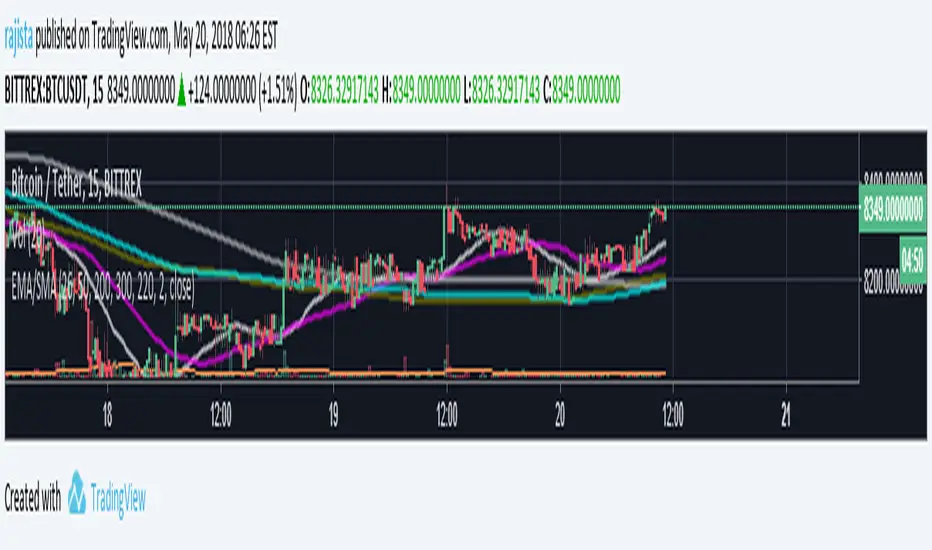
50 & 55 EMA CloudAfter testing thousands of indicators over the years, this simple EMA cloud indicator that I built is still my main weapon. It's always the first one I add to a blank charts and that is not going to change anytime soon.
I find EMAs and MAs are such underrated tools, By observing the price action surrounding these, I can see straight away if it's a good time to get into a trade or not.
As seen here, I also use the 200MA along with the 50/55EMA cloud to find extra strong support and resistances. If price starts to reject both the cloud and the 200MA at the same time/level, then it's a very good indication the price is going to make a big move in that direction as seen here in this chart.
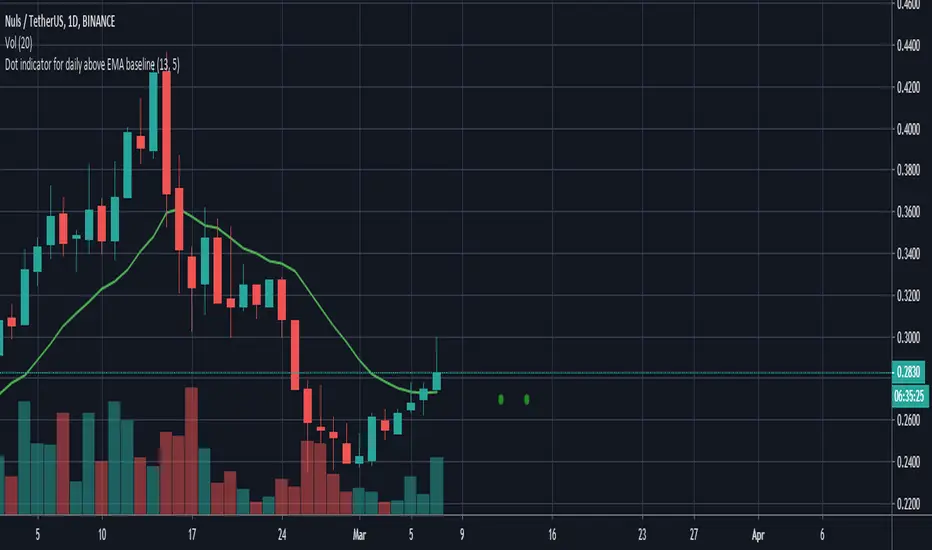
Dot indicator - Daily candle opened above the daily EMA baseline
//@version=3
//Written by David Carruthers
//Objective
//This is to support scanning the market to check if the daily candle opened above the daily EMA baseline for a selected pair
//This can be done in some measure by using trading view's screening tools
//However it would be useful, if someone references a pair, to instantly see if that pair opened above the daily baseline regardless of what resolution you are in
//This script, works out a green dot if the pairs daily candle opened above the daily EMA baseline, and a red dot if it didn't
//It then displays a green or red dot on the open for the last candle you are looking at regardless of resolution
//This saves jumping back and forth between the daily resolution and current resolution
Note please excuse my Pine scripting I am new to it :-)
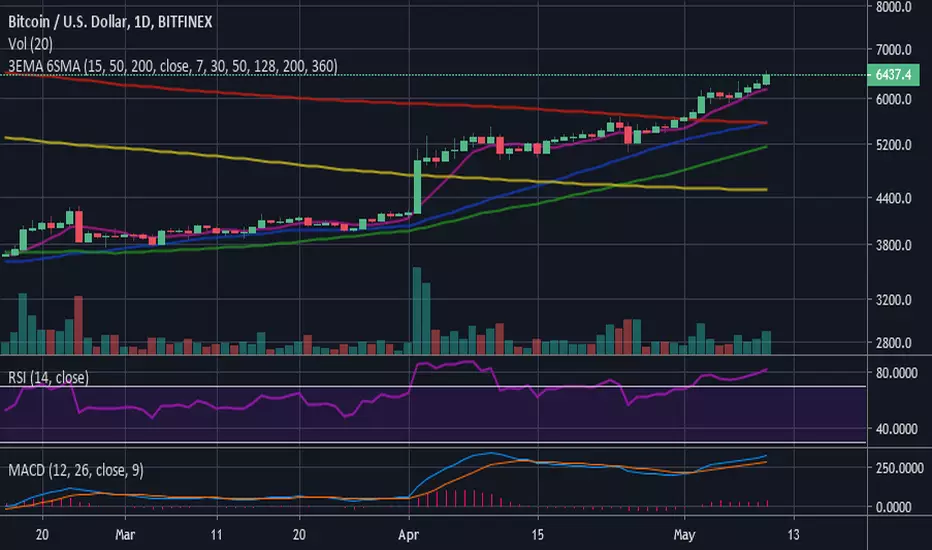
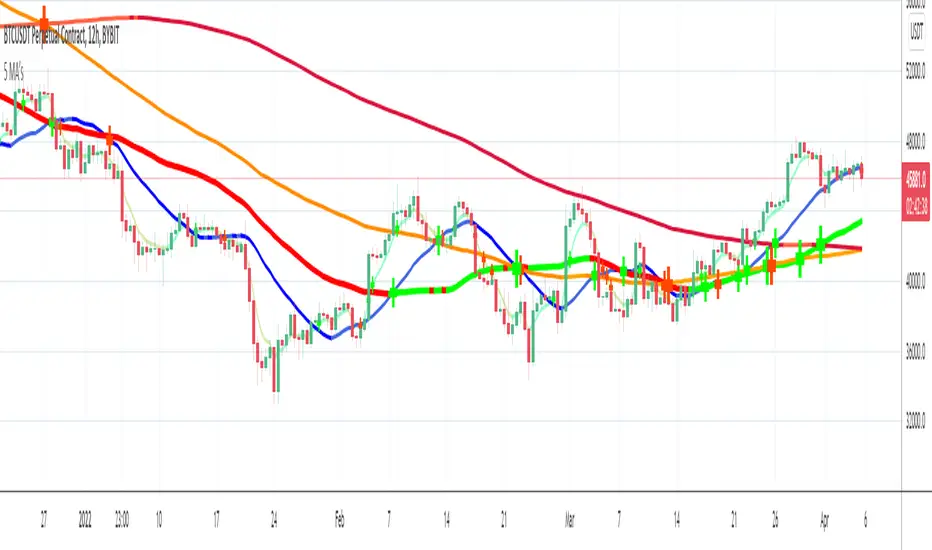
3 EMA (15-50-200) - 6 SMA (7-30-50-128-200-360)3 Moving Average Exponential - 6 Simple Moving Average . Crypto EMA - MA . 7 is a fast support or resistance, 15 confirmation support or resistance. 30 Important support and resistance . 50 institutional support or resistance. 200 institutional general trend, support and resistance , 360 general trend, support and resistance . The use of EMA or MA is according to your liking/trading plan
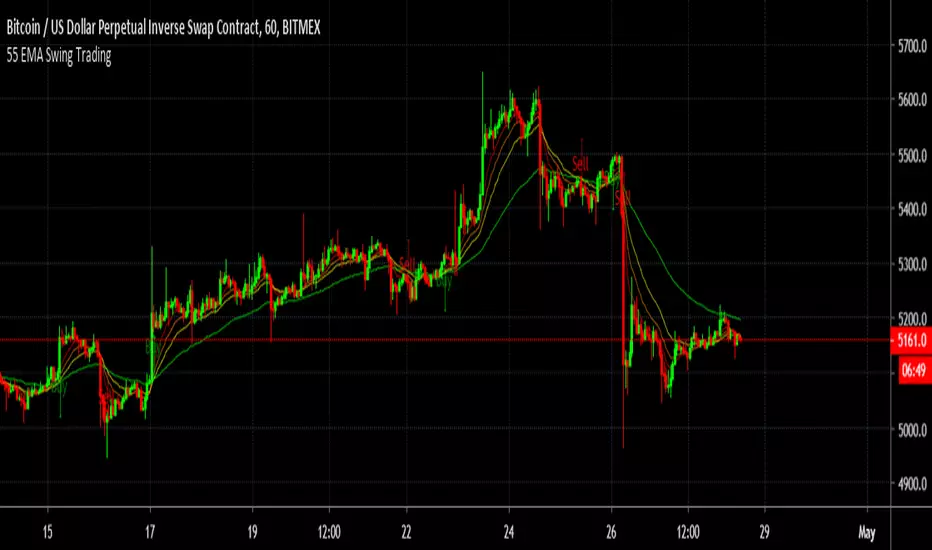
55 EMA Swing TradingA simple Buy and sell strategy using 55 EMA - " 55 EMA Swing Trading"
The source code is publicly available to for further modification.
Simple Alt Coin Strategy - EMA and MACD w/Profit and StopThis script prints BUY and SELL signals based on settings you input. I use it to save time while scrolling through charts deciding what alts I want to look at.
BUY SIGNALS
Positive EMA Crossover
Positive MACD Crossover
Single Candle Gains
SELL SIGNALS
Profit Capture
Stop Loss
I don't trade based just on the BUY or SELL from this strategy, but I have found that these indicators do very well well looking at the large cap alt coins. It backtests well.
Default Settings EMA 5/12/50, MACD 9/12/26, Single Candle Gain 10%, Stop 10%, Profit Capture 45%

Multiple EMA/SMACreate and customize up to 6 EMAs and 6 SMAs. Useful for both long-term and short-term trading. Comes configured with the moving averages I use for trading.

OHLC/GAP/EMA/VWAP all in oneThis script will plot the current open and previous high low and close. The overnight gap between the current open and the previous close is highlighted. Also included is the 10 EMA, 20 EMA and the VWAP. This is good for people who are limited on the amount of indicators they can use.

Higher Timeframe EMAThis script plots a higher timeframe EMA to your chart.
You can specify the timeframe and the length of the EMA in the settings.
This chart demonstrates the 5-minute 50EMA (black) combined with the 1-hour 50EMA (colored) on the 1 minute timeframe.

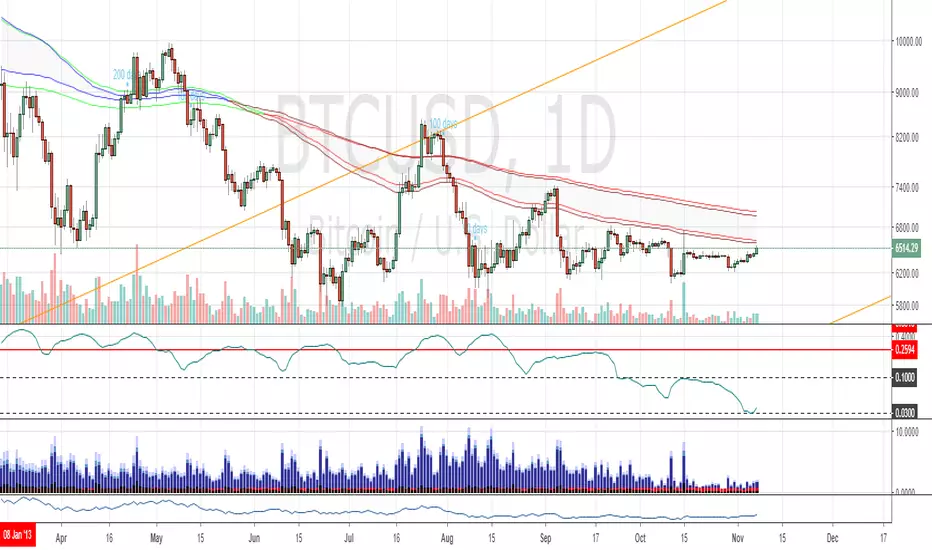
200/100 vs 190/80 EMA [jarederaj]Track the 200/100 EMA cross Vs the 180/90 EMA cross. Also, see the dates when these periods start on the chart.

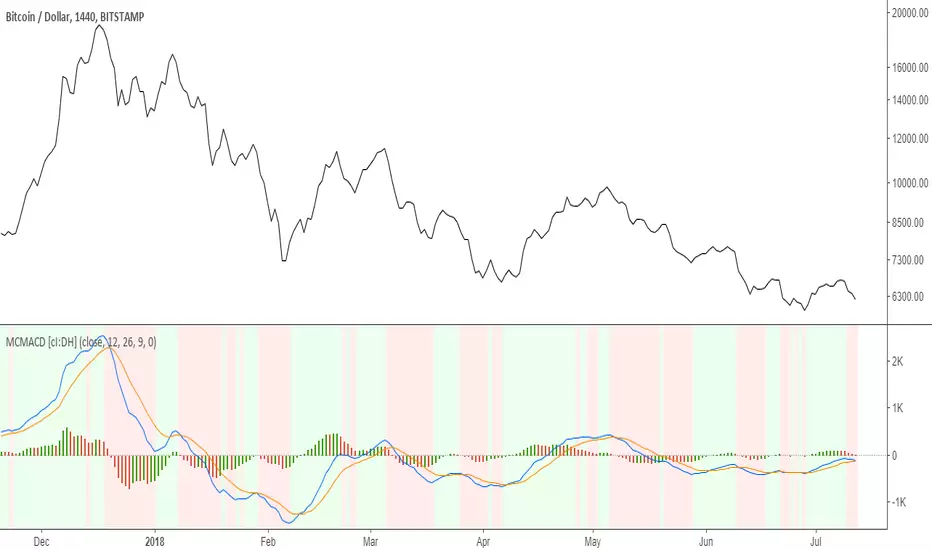
Multi color MACD with Triple EMA smoothing [cI:DH]At default settings, this indicator is identical to the built-in MACD.
Features:
- multi-color histogram
- background color change when MACD tops or bottoms
- additional smoothing using Triple EMA
Recommended settings:
- Triple EMA length 10 seem to be a good trade-off between smoothness and responsiveness
Colored EMAThis is a modified version of the exponential moving average indicator to change color based on trend (red/bearish if price has closed below EMA, green/bullish if price has closed above EMA).

5 in 1 Colored SMA or EMAThis indicator displays 5 EMA’s or SMA’s that change color with the trend without needing to use up 5 charting indicators individually.
5 EMA/SMA with 8digit precision & line widthThis is a comno of 5 different EMA & SMA combined into one indicator with 8 digit precision specially designed to analyse altcoin values in satoshis .
From the setting panel you can change the values of the SMA's , EMA's , choose the line width that you want and from the style tab under settings panel you can change the colors of that you want and then save your chart layout, so that you dont need to change the colors again and again.
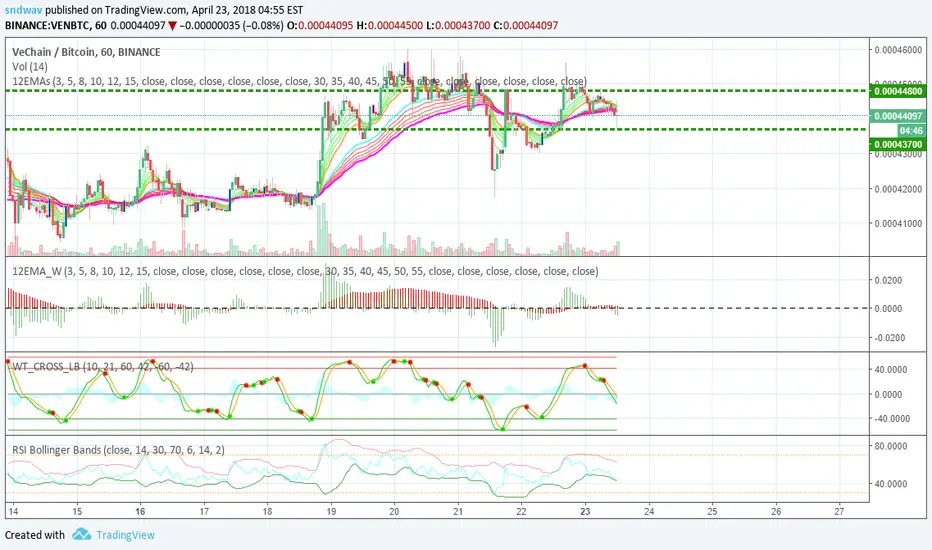
Frosted 12 EMA WIDTHThis is a complementary indicator for the 12 EMAs indicator ()
This width indicator shows the fanning width of each fan (shorter MAs and longer MAs).
To make things easier to see:
You can turn off one of the histograms to view just one of the widths (and add a 2nd instance of this indicator, turning off the other width).
K3 3x EMAsSimple really. 3x EMAs that you can edit, turn on and off etc.
Designed for efficiency/to save space.
Even if you don't use 3 EMAs, it's better to have it and not need it, than to need it and not have it!
Enjoy.


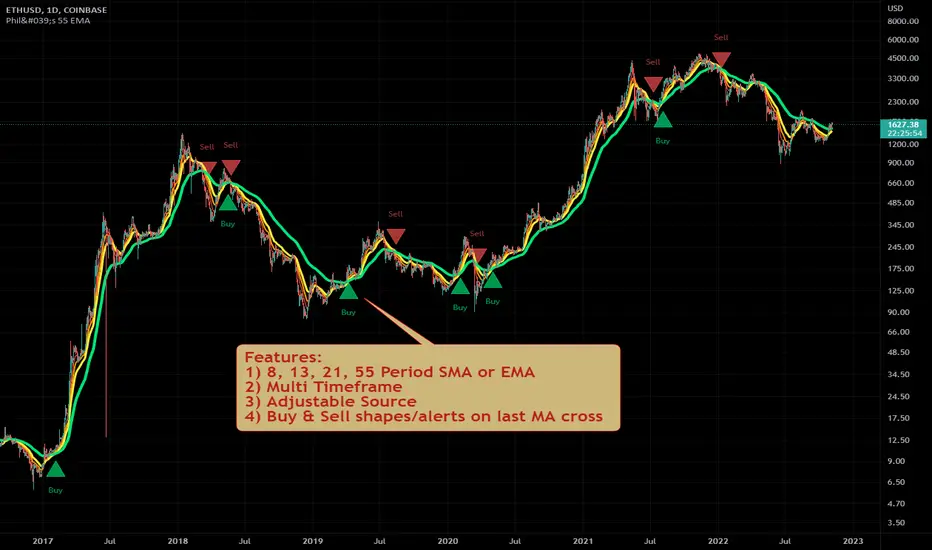
Philakone 55 EMA Swing Trading StrategyThis strategy was inspired by Philkone Crypto's "Lesson 12: Let's Learn Advanced 55 EMA Strategy" video.
steemit.com
Supports Buy and Sell Condition alerts and displays arrows on the chart.
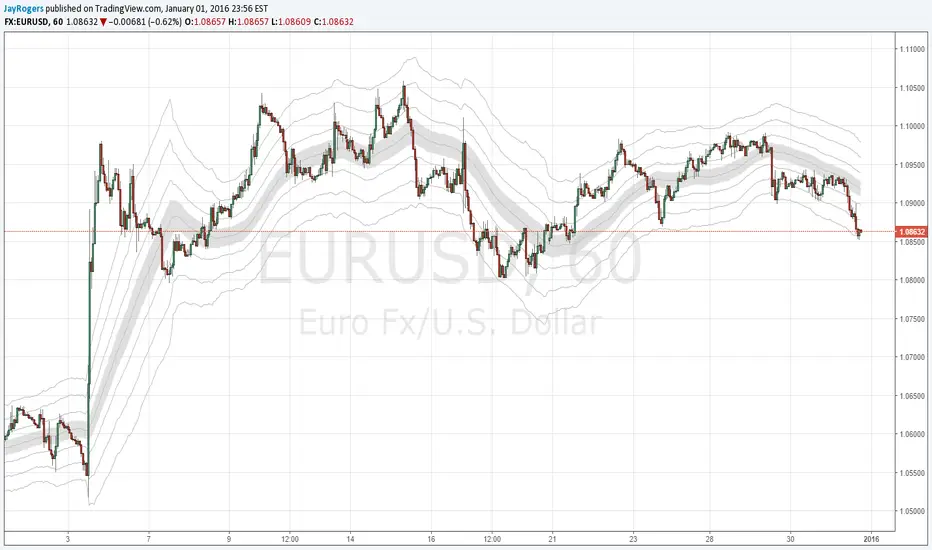
High-Low Difference Channels - SMA/EMAI wrote this up as a potential replacement for my BB based strategies, and so far it's looking pretty nice.
Description / Usage:
Adjust length and multiplier much the same way you would expect with Bollinger Bands.
Multiplier of 1 gives you a base channel consisting of one high, and one low sourced SMA (or EMA)
The outer channels are increments of the base channels width, away from the median hl2 sourced SMA (..or EMA)
TonyUX EMA Scalper - Buy / SellThis is a simple scalping strategy that works for all time frames... I have only tested it on FOREX
It works by checking if the price is currently in an uptrend and if it crosses the 20 EMA.
If it crosses the 20 EMA and its in and uptrend it will post a BUY SIGNAL.
If it crosses the 20 EMA and its in and down it will post a SELL SIGNAL.
The red line is the highest close of the previous 8 bars --- This is resistance
The green line is the lowest close of the previous 8 bars -- This is support

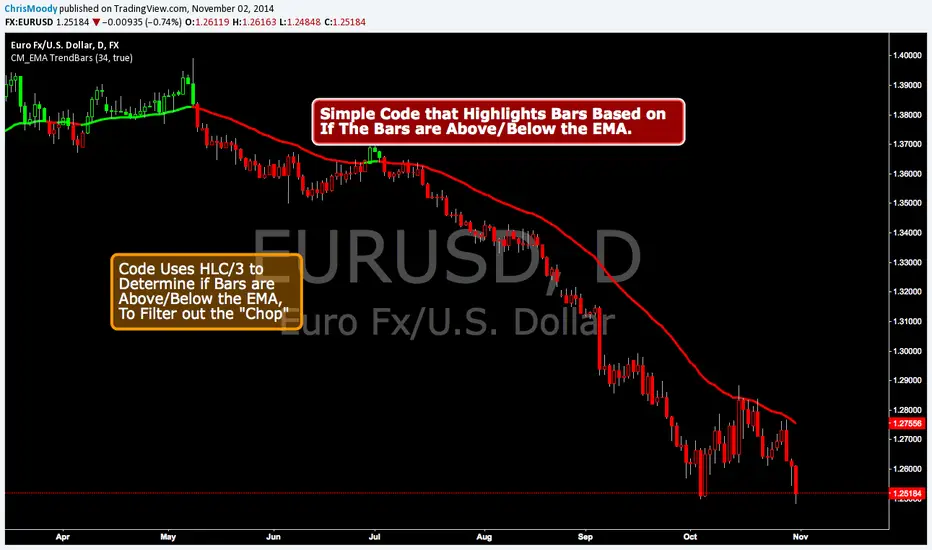
CM EMA Trend BarsThis Code Simply Changes the Bar Colors based on if the Bar is Above or Below the EMA.
Inputs via the Inputs Tab:
Ability to change the EMA Period.
Ability to Turn On/Off the EMA Plotted on the Screen
***Note - I used the HLC/3 To determine if the bar/candle is above or below the EMA. This Filters out the Chop and gets rid of many of the False Breaks above or below the EMA.