Pin Bar CandlesPinbar Identification. One must apply Fibonacchi extension 0,0.5,1,2, 3, 4. 0 being SL 1 Being Entry 0.5 Being 2nd Entry. 4 Being target. Use this to enter trade near crucial levels only.Pine Script®指標由Bastramos提供1161
Dynamic RSIThe standard setting of RSI is 14 periods, with the 30 line being oversold and the 70 line being overbought. However, it is not effective to use only that number as an entry. In the long time frame, it shows the momentum of bullish/bearish pressure and does not reverse immediately. In the short time frame, the reversal appear frequently and it is difficult to make a decision. This script calculates the zone based on the recent RSI fluctuation. You will fix your entry direction whether the center line is above or below the RSI(50). A return to the zone is a sign of entry, which eliminates hesitation. It may be able to be used even in parallel range or against trend. The basic idea is based on the following script; Pine Script®指標由agekara提供44228
Divergence RSI-OBVDivergence detector on RSI of On Balance Volume. Using a modified script from XaviZ(RSI-VWAP) but instead of VWAP as a source in this script source is OBV, for divergence detector is a script from Libertus. In this version, results are filtered using STOCH oversold or overbought filter from matt_b script MFI Divergence v2. An indicator for entry in choppy markets, signals for entry in trending market to follow the trend work well. A good way to spot if there is a weakness in a trend but gives too many false positives for spot reversal, so only good for scalping with tight stops if betting against the trend. Multiple divergences in combination with indicator hitting the overbought or oversold should give good places for entry.Pine Script®指標由kensoka提供11101
GAURs Polynomial Regression ChannelsThanks to The Sweet Lord , here is the Gaur's Polynomial Regression Channel. Its a Polynomial Regression Channel but applied a little differently. Wont go into technical details much. Overview of options is as follows- - - - - - - - - - - - - - - - - - - - - - - - - - - - - - - - - - - - - - - - - - - - - - - - - - - - - - - - - - - - - - - - - - - - - - - - - - - - - - - - - - - - - - - - - - - - - - - - - Channel Options - - - - - - - - - - - - - - - - - - - - - - - - - - - - - - - - - - - - - - - - - - - - - - - - - - - - - - - - - - - - - - - - - - - - - - - - - - - - - - - - - - - - - - - - - - - - - - - - 1. Degree of Polynomial: 1/2/3 Default = 3 Defines the degree of polynomials - 1,2,3. Note here, degree 1 will not be a straight line since its applied differently. Try different degrees for different fits and market conditions. 2. Channel Length: Default 30 (candles) You can go beyond 100 or 200 candle lengths but smaller is the usual preference of Poly-Reg-channel traders. It all depends on market conditions and your style of trading. Do your research. I am usually comfortable with a range of 20-50 (in crypto markets). 3. Basis of Channel height/boundries: ATR/Manual Default: ATR ATR provides a dynamically adjusted entry/exit bounds of the channels. As ATR changes, the channel bounds also changes its height. It can also be fixed manually. Manual heights wont change automatically. 4. Basis of Y-Value: open/close/ sma / ema / wma /hilow Default: close Y- value is the y value of the (x,y) coordinates used while calculating the regression coefficients. Dont worry about it, its nothing serious. 5. Apply channel smoothning using sma?: Yes/No Default: Yes Without smoothning, the channel does not "look" good. 6. Shaded Area Height Percentage: Its the extra margin for the channel. Its in percentage of the total height (defined 3 above) of channels. The shaded area provides an extra allowance for your entries or exits beyond the ATR or manual heights. 7. Plot RSI?: Yes/No Default: Yes Plots RSI (orange line in between the channel - its different from the dotted center line) considering the downbound of channels as 0 (oversold) and upbound of channels as 100 (overbought) 8. Plot 200 sma?: Yes/No Default: Yes It plots a 200 period fast (green) and 225 period slow (red) sma . I usually use two MAs. Its visually very easy to understand. - - - - - - - - - - - - - - - - - - - - - - - - - - - - - - - - - - - - - - - - - - - - - - - - - - - - - - - - - - - - - - - - - - - - - - - - - - - - - - - - - - - - - - - - - - - - - - - - Sample Strategy - - - - - - - - - - - - - - - - - - - - - - - - - - - - - - - - - - - - - - - - - - - - - - - - - - - - - - - - - - - - - - - - - - - - - - - - - - - - - - - - - - - - - - - - - - - - - - - - You can develop your own strategy with the channels. But following is just one of the ways you can trade. Best Application: Ranging markets. But can be happily used in volatile conditions, with a little experience. 1. SMA: -- (this condition is optional really) If green (200) is above red (225) go only long. If red is above green go only short. Defines long term trend of the market. 2. Channel slope: -- (this stuff needs practice/experience) Depending on the channel slope, like if its tending to go up or down, you can choose to take only short or long trades. It defines short term momentum of the market. 3. ATR based heights: Since its ATR based, the channel height are our natural entry and exit points. Long: When price touches lower shaded area, consider possible long entry. Exit on price entering the upper shaded area. Short: Enter on upper bound shaded area, exit on lower. 4. RSI: For additional conformations. Again note, the RSI considers the lower bound of channel as 0 and upper as 100. But since, the channel moves up and down, the RSI will also move not only as RSI but also with the channel. Meaning, say if the RSI is valued at 50, then it will be near the center of the channel but since the center changes as time and price changes, the RSI valued at 50 at different times will not be at the same horizontal level respect to the graph, although it will be at the same level (center) respect to the channel. 5. PRC Channel Percentage label: This label is at the lower side a bit ahead of the current candle. Provides you info on what is the channel percentage. This is especially helpful in crypto markets to gauge your possible percentage profit where profits can be much higher than forex or other instruments. It can also helps you select a suitable market/instrument if the channels are based on ATR. 6. Extra indicators: I usually use stochastic along with this setup for extra conformations. - - - - - - - - - - - - - - - - - - - - - - - - - - - - - - - - - - - - - - - - - - - - - - - - - - - - - - - - - - - - - - - - - - - - - - - - - - - - - - - - - - - - - - - - - - - - - - - - Donate - - - - - - - - - - - - - - - - - - - - - - - - - - - - - - - - - - - - - - - - - - - - - - - - - - - - - - - - - - - - - - - - - - - - - - - - - - - - - - - - - - - - - - - - - - - - - - - - Use freely and donate generously if you find value. Your help will really help. I had earlier provided BTC addresses for donations but it seems to violate TV House rules. Hope they make TV coins redeemable in future. - Pranav Joshi - - - - - - - - - - - - - - - - - - - - - - - - - - - - - - - - - - - - - - - - - - - - - - - - - - - - - - - - - - - - - - - - - - - - - - - - - - - - - - - - - - - - - - - - - - - - - - - - Extra Info - - - - - - - - - - - - - - - - - - - - - - - - - - - - - - - - - - - - - - - - - - - - - - - - - - - - - - - - - - - - - - - - - - - - - - - - - - - - - - - - - - - - - - - - - - - - - - - - // © cpranavjoshi // special thanks to the "Trading View" people for providing this great platform for free // ------------------------ // MATH // ------------------------ // special thanks to an article on the web that provided layman friendly explanation of the maths // unfortunately i wont be able to provide the link to that article owing to TV restrictions, though i sincerely would have liked to credit the author. // Google search this phrase, and you should be able to get it in one of the first results - "polynomialregression Mathematics of Polynomial Regression" // my regression math calculation is a further resolution upon the generalized matrix formula given in the that article. // the generalized matrix looks scary but in fact its much simpler than one may assume // the summation sign things are just float numbers that can be easily found out // so we get a matrix with number of equations equal to the number of unknowns. // e.g. if its a 3rd degree poly, it has 4 unknowns (c0,c1,c2,c3) with 4 equations as in the generalized matrix // it can be resolved by simple algebra // Note: the results have been verified with excel using same input data points. // pine was difficult for me so i coded it in python first to verify // ------------------------ // WHY // ------------------------ // this script was coded because Pranav badly needed Polynomial channels (had used them in mt4 earlier) // and at the time of this coding, i could not find any readily available script in the trading view public library ( tnx public) // the complex math was probably the hurdle // i m not good in maths, but by the Will of the Lord, i could resolve the issue with simple algebra and logic // ------------------------ // PINE // ------------------------ // i am just an average (even poor probably) programmer and pine script is not my language // this is a humble attempt to write my first pine with whatever i could do quickly // experts - feel free to develop if needed. have used some workarounds in drawings/plottings. rectify them if possible // // // - Pranav JoshiPine Script®指標由cpranavjoshi提供22206
LBR 3-10 OscillatorThis is a variation of MACD popularised by Linda Bradford Raschke. Instead of the regular MACD settings, the this indicator uses simple moving averages, not exponential moving averages, and a setting of 3 for the fast MA, 10 for the slow MA and 16 for the signal line. The signal line (red) acts as a trend indicator, with crossings of the zero line indicating trend changes, while the MACD line (blue) acts as a short term momentum indicator. Setups: - First cross: This is basically selling or buying at the first pullback after a trend change. Buy or sell after the signal line has crossed the zero line and the MACD crosses the signal line for the first time after the trend change. Use price action to time the entry after the pullback — you don't need to wait for the MACD to cross the signal line again. - Pullback in a trend: The MACD crosses the signal line in the opposite direction of the trend irregardless of when the trend change occurred. Use price action to time the entry. - Divergence: The MACD line shows a pattern diverging form price (e.g. makes higher lows whereas price makes lower lows). This can be an indication of trend reversal or waning. In the indicator's input panel there is an option for showing standard deviation bands (turned off by default). MACD line crossing the standard deviation bands can indicate oversold and overbought conditions. The indicator comes with the following alerts: - First cross downtrend - First cross uptrend - Pullback in downtrend - Pullback in uptrend - Trend change down - Trend change up Sources: lindaraschke.net www.netpicks.comPine Script®指標由bonfireAlgorithm提供已更新 2222690
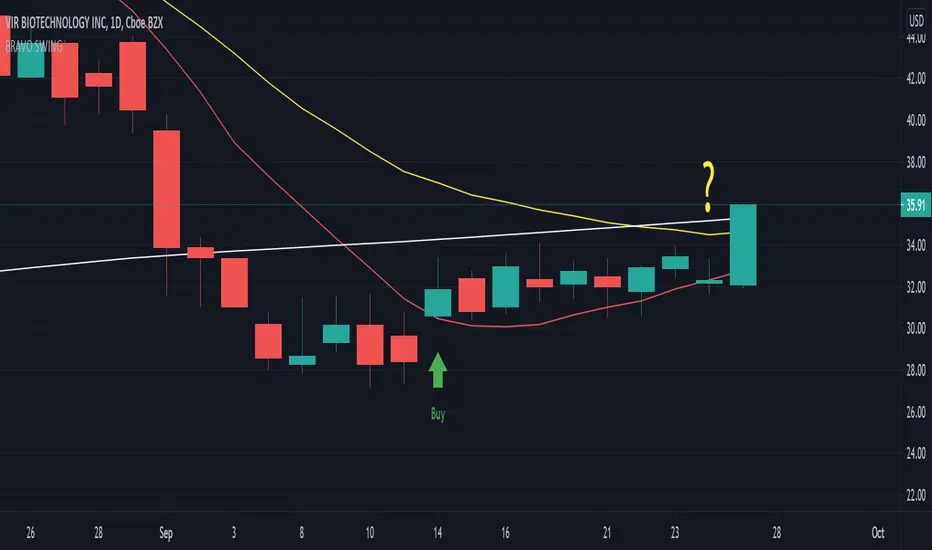
Original Bravo SwingThe Bravo Swing is based on the methods taught by YouTube celebrity J Bravo. It uses the 9 day moving average as a base for selecting optimal entry and exit points. Buy indicator: A full candle closing above the 9 day moving average generally indicates a bullish signal for an entry. If conditions are right, this can be seen as a great opportunity to buy. Sell indicator: If the candles continue to close above the 9 day moving average, the trend appears to remain bullish. However, an exit is to be considered once a candle closes below the 9 day moving average, as this indicates a bearish signal may be approaching. If you you're feeling confident about the uptrend continuing and choose to ignore the exit signal, a candle close below the 20 day exponential moving average should be used as a definite exit point. Options: Color code option to display the 180 day moving average in gray during downtrends and white during an uptrend. The 50 day moving average can be turned on to help better visualize conflicting trends. Pine Script®指標由natsegar提供已更新 370
Percent Calculator (Return On Investment Target Price)First and foremost: I was inspired to publish my first script after reading some of the other member's scripts -a token of my appreciation and support, Thank You. The percent calculator is a very simple and basic indicator to use, it''s function is to simply output the target price from either the close or ones trade-entry based on a desired percent return on investment (R.O.I.). Say you want to profit 15% from your entry: simply plug in your entry value and the number 15 into the appropriate settings and the indicator displays what the target price should be (rounded to two decimal places). The percent calculator also goes one step further by finding the average percent return on investment over a desired interval of time (the default is 20 candles) as well as allows one to adjust the size of the price move the average percent return on investment is being calculated for. Say you want to find the average percent return on investment for a 3 candle swing over a 200 candle interval of time: simply plug the number 200 into the interval setting and the number 3 into the price-move setting and the indicator displays what the average 3 candle swing returns on investment. Practical Application: comparing ones desired return on investment to the average return on investment can help determine how realistic ones goals are... it's unlikely to achieve 100% return on investment if the average is only around 10% (given the parameters one is working within) but on the other hand achieving 5% return on investment is highly likely.Pine Script®指標由UnknownUnicorn6941191提供已更新 1139
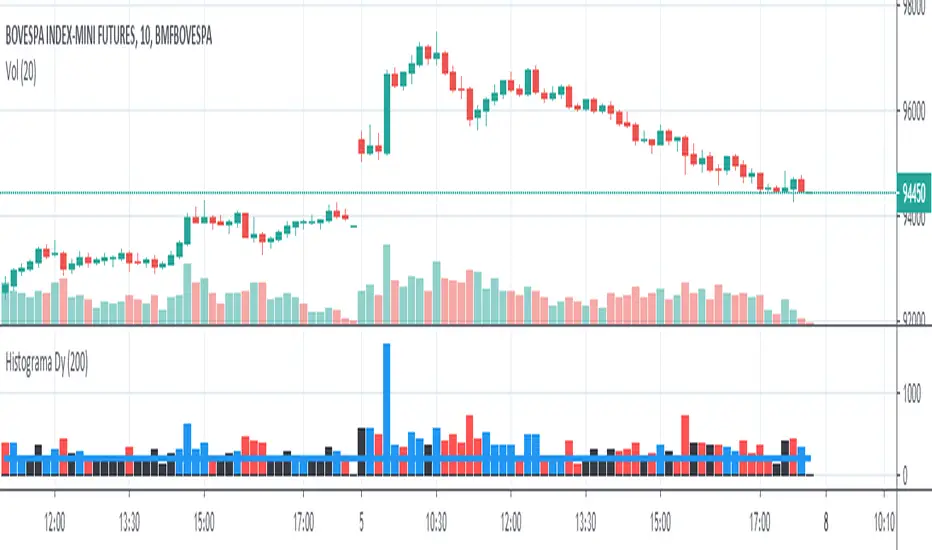
Histogram - Price Action - Dy CalculatorThis script aims to help users of Price Action robot, for Smarttbot (brazilian site that automates Brazilian market (B3)). You can use on any symbol. The script will follow price action principles. It will calculate the absolute value of last candle and compare with actual candle. Colors are: - Red - If the actual candle absolute value is higher than previous one, and the price is lower than last candle. It would be a short entry. - Blue - If the actual candle absolute value is higher than previous one, and the price is higher than last candle. It would be a long entry. - Black - The actual candle absolute value is lower than previous one, so there is no entry. If there is a candle that is higher than previous one, and both high and low values are outside boundaries of previous one, it will calculate which boundary is bigger and will apply the collor accordingly. Pine Script®指標由Maurosmartins提供已更新 126
Average True Range BandsAverage True Range Bands The 30-day Average True Range is useful in Futures and Forex trading for placing stop orders for entry. In the example above, a trader may want to initiate a Short position on a break below the support trendline. A good place to enter this trade would be a price break below the support trendline minus 50 to 100% of the current ATR value. ATR Bands provides a useful visual overlay of the current ATR value above and below the current price to speed up order entry decisions.Pine Script®指標由johnswede提供2294
QQE signalsConverted the QQE oscillator to in-chart long and short signals with built in alerts. This is multi-timeframe and quite robust.Pine Script®指標由colinmck提供171171 14.3 K
Study for Squeeze Momentum Indicator [LazyBear]This study is based on LazyBear Squeeze Momentum Indicator and my strategy developed using it. I added some custom feature and filters. Main improvements are: 1- study is updated to version 4 of pine script; 2- I added alerts for entry rules and exit rules. 3- Alert syntax can be customized for webhooks: I added one example only for long entry. You can customize a lot of features to get a profitable strategy. Here is a link to original study. Please use comment section for any feedback. Pine Script®指標由03.freeman提供55657
DW-RSI EMA with EMA of RSIThis is an RSI Oscillator with an EMA of the RSI for a signal line. The RSI line is Green when above the signal line and Red when below the signal line. This does not use the traditional 30% / 70% over sold / over bought analysis. Therefore the levels are not shown. The analysis is this: When the RSI is above the signal line then price has a bullish bias. When the RSI is below the signal line then price has a bearish bias. I wrote use this for Forex Spot Currencies where I feel overbought and oversold may be less valid than it may be in other markets such as stocks. As with all indicators, do not use as your sole reason to enter the market, but use with other indicators or price action signals to get a confluence of signals to confirm your entry. I use it with an 8, 21 and 50 EMA to confirm entry and exit. I give it more weight for exits than I do for entries.Pine Script®指標由MrPresident提供33230
Waddah Attar Explosion and WaveTrend Oscillator combinedWaddah Attar Explosion by LazyBear and WaveTrend Oscillator by Krypt. All credits goes to LazyBear and Krypt, i have only done some combining with the two indicators, barcolors and BG colors to clarify entrys and exits. Combine with CM_Williams Vix_Fix, Super Guppy R1.0 by JustUncleL and you have a powerful tool. Barcolors to look for Aggressive Buy 1 = Lime Agressive Buy 2 = Aqua Buy = Green Sell 1 = Orange Sell 2 = Red This is my first try, so be nice to me :-) Pine Script®指標由gtfalmi提供77688
market phases - JDThis indicator shows the relation of price against different period ma's. When put in daily Timeframe it gives the 1400 Day (= 200 Weekly) and the 200 ,100 an 50 Daily. The lines show the 200,100 and 50 ma in relation to the 1400 ma. JD. #NotTradingAdvice #DYOR Pine Script®指標由Duyck提供已更新 33400
On Balance Volume +This is the standard On Balance Volume indicator, with the addition of four things: 10-SMA 20-SMA 100-SMA Bollinger Bands I have found intriguing and surprising results with this indicator. I often see OBV bouncing off of the Moving Average lines, much like support and resistance points. More interesting is the fact that it "obeys" the bollinger bands. Often times, if OBV sneaks outside of the Bollinger Band, it will almost always correct and get back in the next day. I would recommend that you find your own method, and PLEASE post in the comments as to how you use this, but I'll tell you How I use this indicator: I usually use this on the daily view. I tend to wait until OBV has moved above the red 20-Day SMA before considering an entry. Below that doesn't show enough positive volume for me to identify enough interest in the security. Once it breaks the red SMA, I'll look at other indicators for confirmation. If price is above the Bollinger Band up above, and my OBV is above Bollinger Band, I will not buy. Also, if MACD is dropping, or if the Stochastic RSI is pegged out in overbought land, I won't buy that either. If, however, I'm seeing good stuff from Stochastic RSI, RSI, MACD, and price BB, then I'll take a long entry at that OBV + 20SMA crossover. If I'm in a long position and I see a few signals like the OBV is above the BB, and price is above BB, and StochRSI or RSI are in/near overbought land, I'll often sell that day, expecting a pullback on price. I really like this one, it's been quite helpful in my trading. This is my first venture into using Volume for trading, and it's been good so far. Leave me a note in the comments to tell me how it goes and how you use this thing!Pine Script®指標由mattzab提供已更新 11232
NG [Wave Period Oscillator]The WPO is a short-term oscillator that measures the buying and selling period of price cycles over a certain time interval. The leading oscillator indicates a rise in buying period when it moves above the zero line and a rise in selling period when it moves below the zero line. Trading Tactics Center line Crossover: a bullish center line crossover occurs when the WPO line moves above the zero level to turn positive. A bearish center line crossover occurs when the WPO line moves below the zero level to turn negative. When bulls are in control, the price rally begins and the average of the bull’s period T increases to drive the WPO line above the center line. A buy signal is subsequently triggered. When the bulls start to loose power, prices move sideways and the average period decreases. In this case, the WPO line may fl utter near the center line and cause false signals, whipsaws. To avoid the whipsaws occurring on the center line, the following trading tactics are proposed: Uptrend Tactic: During an ideal uptrend, the WPO does not reach the lower boundary -2 and usually rebounds from a higher level than -2. This means that the bulls have taken control earlier. Hence, a zero line crossover generates a buy signal. The WPO crosses the upper boundary at +2 then pulls back again below +2 to generate a sell signal. Sideways Tactic: During sideways, the WPO fluctuates between the lower and upper boundaries -2 and 2. This tactic is also used in an uptrend where corrections are strong enough to drive the WPO line below the lower boundary. Downtrend Tactic: During downtrends, the WPO fails to reach the upper boundary and oscillates between the 0 and -2 levels. The bears enter early indicating an obvious weakness in the market. Therefore, crossing the zero level generates a sell signal. Exit at Weakness: During uptrend reversals and downtrends, the WPO oscillates between the center line and the lower boundary -2. The bears are controlling the market and move in wide cycle periods while the bull’s strength is almost absent. An exit signal is triggered once the WPO crosses -2. When prices decline, the WPO may cross its extreme lower boundary at -2.7. Therefore, a swift exit signal is triggered once the WPO crosses -2. Re-Entry: During uptrend, the WPO crosses down the upper boundary level at +2 to generate a sell signal. Yet, it does not reach the zero line and the oscillator moves back toward the upper boundary. This case is considered as strength while a re-entry signal occurs at the +2 level crossover. The sell signal is generated when the WPO line crosses down the upper boundary. Pine Script®指標由NGBaltic提供93
EurUsd Momentum Heiken AshiEURUSD Monthly and Weekly indicator that measures the slope between open and close. ***Works best on Heiken Ashi-as it smooths out the lines. -In essence, it is the same thing as Heiken Ashi but gives a better visual for entry beside "the candle is red so I should sell" -Method For Entry: **Look for a Higher Low to --->buy at indicator >=0 **Look for Lower High to ----->sell at indicator <=0 **Look at Heiken Ashi candle with support and resistance zones **Draw trend-lines such as channels, pennants, etc.. Pine Script®指標由TheBulltrader提供11345
Ichimoku-Hausky_v2.1Made a little update to my trading system. This system is made so that you can easily follow the trend and know when to get out. You still have to know basic market structure to find a good entry. NB!! I see that i placed the entry wrong on the example, you have too wait for the EMA to go below the MA :) I have posted the right one at the bottom. Take profit can be set at last low or you can use trail stop on the EMA, MA, Kijun-sen or Tenkan-sen. Example rules: Buy: IF Market is in a trend or are possibly close to break out of range THEN see if price has closed above cloud IF price has closed above cloud THEN see if EMA has crossed above MA IF EMA has crossed above MA THEN buy or wait for pullback Sell: IF Market is in a trend or are possibly close to break out of range THEN see if price has closed below cloud IF price has closed below cloud THEN see if EMA has crossed below MA IF EMA has crossed below MA THEN buy or wait for pullback Pine Script®指標由Hausky提供22495
[RS]Linear Regression Bands V1experiment with linear regression, the purpose was to catch break outs early, but it creates to much visual noise same as version 0 but with added margin filter and signal to mark entrysPine Script®指標由RicardoSantos提供已更新 55316
Vervoort Heiken-Ashi LongTerm Candlestick Oscillator [LazyBear]HACOLT (Heikin Ashi Candles Oscillator Long Term) is a technical indicator designed by Sylvain Vervoort. It is based on Mr.Vervoort's other indicator, HACO (Heikin-Ashi Candles Oscillator - posted here: ). Optimized for long-term trading, HACOLT shows three levels: -1, 0 and 1. These levels suggest "an open short position", "no open position", and "an open long position", respectively. Passing from a certain level to another is viewed as a trading signal: - Rising from -1 or 0 to 1 suggests a Long Entry and Short exit; - Falling from 1 to 0 or -1 suggests a Long Exit; - Falling from 1 or 0 to -1 indicates a Short Entry. Fits in nicely with any trading setup as a confirmation indicator More info: - tlc.thinkorswim.com - www.motivewave.com List of my other indicators: - GDoc: docs.google.com - Chart: Pine Script®指標由LazyBear提供3737 6.8 K
Scalp Trend Engine v2 (Alerts + TP/SL)Scalp Trend Engine: Methodology & Trading Rules 1. Core Philosophy The Scalp Trend Engine is designed for high-frequency, precision execution on lower timeframes (1m, 3m, 5m). Unlike swing trading systems that rely on confirmed structure (which lags), this engine prioritizes immediate momentum aligned with the dominant trend, filtered by volatility. "Trade the Ripple, Filter the Chop." 2. Technical Components Component Setting Purpose Fast EMA 9 Immediate price momentum direction. Slow EMA 50 Dominant trend baseline. ATR 14 Measures current market "noise" / volatility. Spread Filter 0.25x ATR Ensures trend is strong enough to trade (avoids flat markets). 3. Trade Logic The "Go/No-Go" Gauge (The Filter) Before any trade is considered, the Spread Condition must be met: Distance between EMA 9 and EMA 50 > 0.25 * ATR Why? If the lines are touching or tangled (less than 25% of an ATR candle apart), the market is "chopping." NO TRADE. Long Setup (Buy) Trend: EMA 9 is ABOVE EMA 50. Filter: Spread is valid (Market is expanding). Trigger: Price closes ABOVE the EMA 9 (Pullback recovery). Logic: Price dipped, touched/broke EMA 9, and is now reclaiming it in the direction of the uptrend. Short Setup (Sell) Trend: EMA 9 is BELOW EMA 50. Filter: Spread is valid. Trigger: Price closes BELOW the EMA 9. Logic: Price rallied, failed, and is now breaking back down with the downtrend. 4. Risk Management (The "Engine" Settings) This system uses ATR-based targets to adapt to market speed. Stop Loss (SL): 1.0x ATR from Entry. Theory: If price moves 1 full average candle against you, the immediate momentum is likely gone. Get out. Take Profit (TP): 1.5x ATR from Entry. Theory: Aim for a quick burst of continuation. This offers a 1:1.5 Risk/Reward Ratio. 5. Execution Workflow Check Context: Is the macro trend (1H/4H) matching your scalp direction? (Optional but recommended). Wait for Alert: Let the script ding you. Don't chase. Verify Visuals: Are the EMA lines clearly separated? Is the "Target" dot feasible (not right into a huge resistance level)? Execute: Enter at the close of the signal candle. Set Orders: Place your OCO (One-Cancels-Other) bracket orders at the prices shown by the indicator dots. 6. Comparison to Bill Williams Feature Bill Williams (Chaos) Scalp Trend Engine Trigger Fractal Breakout (5 bars) EMA Crossover (Instant) Best For Swing Trends (4H+) Scalping (1m-5m) Lag High (Confirmation based) Low (Momentum based) Filter Alligator Mouth ATR Spread This system is built for speed and efficiency in fast-moving markets.Pine Script®指標由yuvalbenrobd提供1
Alg0 Hal0 Crypto RVWAP🛠 Indicator Overview The Crypto RVWAP Momentum Dashboard is built to help intraday traders identify the "Fair Value" of an asset while simultaneously quantifying the strength of the current trend using a normalized slope percentage. 1. The Rolling VWAP Line The core line represents the volume-weighted average price over a user-defined number of bars (default: 20). Bullish (Lime): The line is sloping upward ($RVWAP > RVWAP_{prev}$), indicating increasing value. Bearish (Red): The line is sloping downward ($RVWAP < RVWAP_{prev}$), indicating decreasing value. 2. The Momentum Dashboard (Top-Right) The dashboard provides a real-time look at the Slope %, which is the percentage change of the RVWAP over a 5-bar window. Current Slope: The momentum of the active candle. Prev 1, 2, 3: Historic momentum values from the previous three bars. Why it matters: It allows you to see if a trend is accelerating (values getting larger) or exhaust ing (values shrinking) before the price action actually changes direction. 3. Confirmed Cross Labels The script automatically plots UP and DOWN labels when a candle closes on the opposite side of the RVWAP. To keep the chart clean, only the two most recent crossing events are displayed. These signals are confirmed on the bar close to prevent "repainting" or false signals during mid-candle volatility. 📈 How to Trade with this SystemStrategy A: Trend Following (Momentum)Entry: Wait for a "CROSS UP" label. Confirmation: Look at the Dashboard. If Current Slope is higher than Prev 1, momentum is building. Exit: Exit when the RVWAP line turns Red or when the Slope % in the dashboard drops sig nificantly (e.g., from 0.08% to 0.01%). Strategy B: Mean Reversion (The "Rubber Band" Trade ) In crypto, price rarely stays far from the RVWAP for long. If the price is significantly above RVWAP and the Slope % begins to decrease (e.g., 0.15% → 0.10% → 0.05%), the price is likely to "snap back" to the line. Traders use the line as a target for take-profits or as a "Buy the Dip" zone in a strong uptrend. ⚙️ Technical Settings RVWAP Lookback: Adjust this based on your timeframe. On a 5m chart, 20 covers ~1.5 hours. For a "daily" feel, use 288. Slope Lookback: The window used to calculate the % change. 5 is ideal for catching short-term pivots. Dashboard Scaling: The UI is pre-scaled with Large Headers and Normal Body Text for high readabilit y on 4K or mobile screens. ⚠️ Important Confirmed Closes: This indicator is logic-locked to the Bar Close. Do not enter a trade until the 5-minute candle has physically finished and the label appears. Alerts: Users should set TradingView alerts to "Once Per Bar Close" to match the script's internal logic. Market Context: In a completely flat market (Slope near 0.000%), avoid trading the crosses, as these are "No-Trade" zones prone to sideways cho p. Enjoy! Alg0 ۞ Hal0Pine Script®指標由inspyr24提供5
MA - ALMA 34/50/144/233 [BySel]OPTIMIZATION OF THE GAUSSIAN FILTER IN FIBONACCI REGRESSION SPACE I present the methodological construction of an indicator system based on the Arnaud Legoux Moving Average (ALMA) using Fibonacci period parameters (34, 50, 144, 233). This is not merely the selection of random numbers, but rather a synthesis between Digital Signal Processing (DSP) theory and Fractal Market Geometry. We will dissect the mathematical structure of the Gaussian filter and explain why applying it across Fibonacci timeframes creates such an effective market measurement reference framework. Here, we must conduct a deep analysis of two metaphysical hyperparameters: Offset and Sigma ($\sigma$). In the source code under discussion, alma_offset = 0.85 and alma_sigma = 6. These are revolutionary values. In traditional statistics, the peak of the normal distribution lies at the center (offset = 0.5), which produces lag equivalent to an SMA. By shifting the peak of the weighting function to the right (Offset = 0.85), we are performing an intentional “phase shift,” assigning the greatest weight to the most recent data while not entirely eliminating the influence of past data as in the crude approach of relying solely on closing prices. Mathematically, the value 0.85 approaches the Nyquist limit to ensure responsiveness without causing overshoot—that is, without being disrupted by instantaneous random fluctuations. The Sigma parameter = 6 serves to control the bandwidth width of the filter. A large Sigma makes the weighting curve narrower, concentrating energy at the Offset point, transforming ALMA into an extremely sharp low-pass filter that eliminates most high-frequency noise which conventional moving averages fail to suppress. Notably, the use of Fibonacci numbers as the filtering window length ($L$) creates the potential for wave resonance. The 144 period is not only four times the 34 period arithmetically, but within Elliott wave structure it represents the dominance of a higher-degree wave over a lower-degree wave. ALMA 144 and ALMA 233 function as fractal “shorelines,” where price returns to rebalance before continuing the trend. Thanks to ALMA’s low-lag characteristic, these dynamic support lines are far more precise than the traditional SMA 200 or EMA 200, as they accurately reflect the current center of mass of capital flow rather than the arithmetic average of distant historical data. Below is the concise Technical Guideline for traders and quantitative analysts when applying the ALMA Fibonacci system (34/50/144/233) in the stock market. GUIDELINE FOR USING THE ALMA FIBONACCI SYSTEM (34/50/144/233) Core Principle: The system employs a Gaussian filter (ALMA) to minimize lag, combined with Fibonacci numerical periods to identify the market’s energy layers. 1. Component Identification (Vector Roles) ALMA 34 (Blue – Fast Signal): Represents Short-term Momentum. Used to trigger entries and monitor immediate thrust. ALMA 50 (Red – Baseline): Represents Medium-term Flow. This is the first dynamic support zone during pullbacks. ALMA 144 (Teal – Trend Line): Represents Trend Structure. It delineates the boundary between Bull and Bear markets. ALMA 233 (Brownish-red – Boundary Line): Represents Major Support/Resistance. This is the “hard floor” or “hard ceiling” of the long-term trend. 2. Trading Strategy (Setup) A. Laminar Flow State (Strong Trend): Identification: The lines are perfectly ordered: Price > 34 > 50 > 144 > 233 (for an uptrend) and expand evenly like a fan. Action: Only look for LONG (Buy) positions. Entry: When price pulls back to ALMA 34 or at deepest to ALMA 50, followed by a bullish confirmation candle. Do not short in this structure. B. Singular Attraction State (Mean Reversion – Bottom/Top Catching): Identification: Price moves too far away from the ALMA bundle (the distance between Price and ALMA 34 becomes excessive). Action: Take partial profits. Wait for price to be drawn back toward a reasonable equilibrium zone between ALMA 50 and ALMA 144. Reversal attempt: Only consider when price touches ALMA 144 or 233 and that ALMA line still maintains an upward slope. C. Turbulent Flow State (Sideways Market): Identification: The four ALMA lines intertwine, flatten out, and the distance between them is very narrow. Action: STAY OUT (NO TRADE). This is a high-noise zone; the Gaussian filter suppresses false signals but does not create directional edge. 3. Risk Management Rules Stop Loss: Place just below ALMA 144 for short-term trades (Swing trade). Place just below ALMA 233 for position trades. Note: If a candle closes decisively below ALMA 233, the market structure has broken (Structural Break), and the position must be exited. Exit: Early exit: When price closes below ALMA 34 (momentum loss). Standard exit: When ALMA 34 crosses below ALMA 50 (confirmed capital flow reversal). 4. Important Notes (Scientific Note) Lag: This ALMA system has significantly lower lag compared to equivalent SMA/EMA. Therefore, crossover signals here are more reliable and less prone to whipsaw. Fractal Property: It can be applied on all timeframes (H1, H4, D1). However, the highest accuracy is on the D1 (Daily) timeframe for the stock market, as it filters out intraday noise.Pine Script®指標由Bysel提供已更新 7