AJ's Position Size Calculator for Forex and StocksThis position size/ stop loss and take profit calculator is designed to make entering positions more efficient. In the settings enter your account size and currency. Stop loss and profit levels can be calculated from the ATR or manually. To manually choose stop and profit price, choose manual from the SL or TP Value Type, then enter your price in the boxes below. Lot size or shares will be calculated and displayed on the table to the right of the chart. Position size calculation takes into account any currency exchange rates between your account currency and the quoted currency of the selected ticker. For forex lot sizes the exchange rate for the quoted currency relative to account currency is also built in to get an accurate position size. Enter your brokers leverage and your used margin will be displayed as well. The position size calculator is currently only configured for stocks and forex, I will try to add updates, in the future to other tickers like crypto , precious metals and crude oil CFD's. profit target and stop loss calculator should work for all symbols. I can't guarantee that the output of this calculator is correct. Use at your own risk!
在腳本中搜尋"forex"

rt maax EMA cross strategythis just sample of our strategies we published with open source, to learning our investor the way of trading and analysis, this strategy just for study and learning
in this strategy we use expontial moving avarage 20 , 50 , 200 and the we build this strategy when the price move up ema 200 and ema 20,50 cross up the 200 ema in this conditions the strargey will open long postion
and the oppisit it is true for short postion in this sitation the price should be under ema 200 and the ema 20 , 50 should cross under 200 ema then the strategy will open the short postion
we try this strategy on forex ,crypto and futures and it give us very good result ,, also we try this postion on multi time frame we find the stragey give us good result on 1 hour time frame .
in the end our advice for you before you use any stratgy you should have the knowledg of the indecators how it is work and also you should have information about the market you trade and the last news for this market beacuse it effect so much on the price moving .
so we hope this strategy give you brefing of the way we work and build our strategy

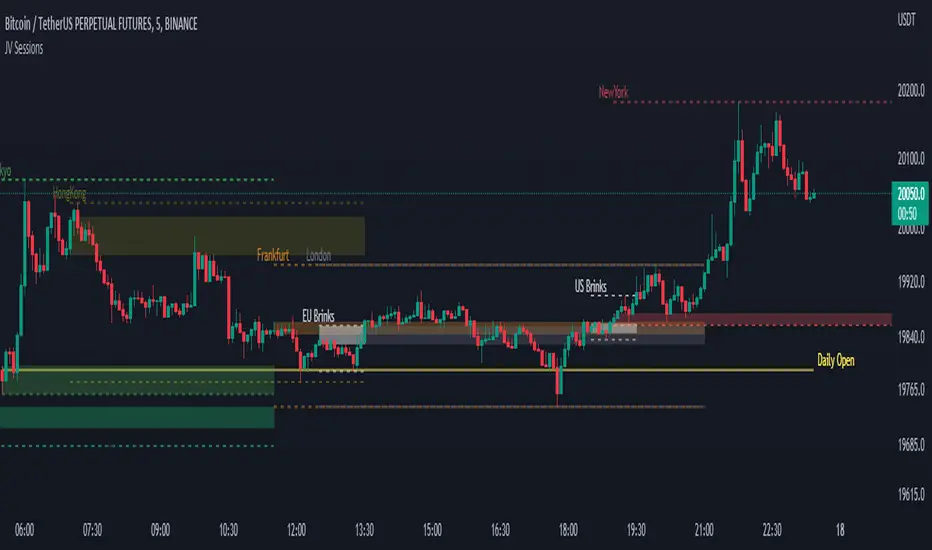
JV SessionsThis indicator serves as the Tradingview equivalent of an MT4 indicator suite.
It differentiates from existing TV indicators in its style and total feature set (most notably PVSRA and PVSRA Override)
It was originally designed for forex markets, and it will work for crypto as well, but it has not been tested on stocks.
List of Forex Market:
Market boxes (NY/JP/ HK /UK/ FR and Brinks Boxes)
Triple RSI strategyThis strategy is commonly used both in forex and stock markets for reversal trading. when the rsi line reaches and crosses simultaneously at 3 rsi setups i.e at 7, 14, and 21, a signal is generated.
This strategy works best in 1-hour timeframe. It provides over 60 to 80 percent accuracy in 1-hour timeframe.
In the stock market, this strategy provides an excellent entry point, if one is seeking small profits.
One can expect to make around 10 to 50 pips in the forex market easily. However, I advise seeking support from price action from the lower timeframe in the forex market.
I hope you like it.
Follow for more strategies and scripts like this.

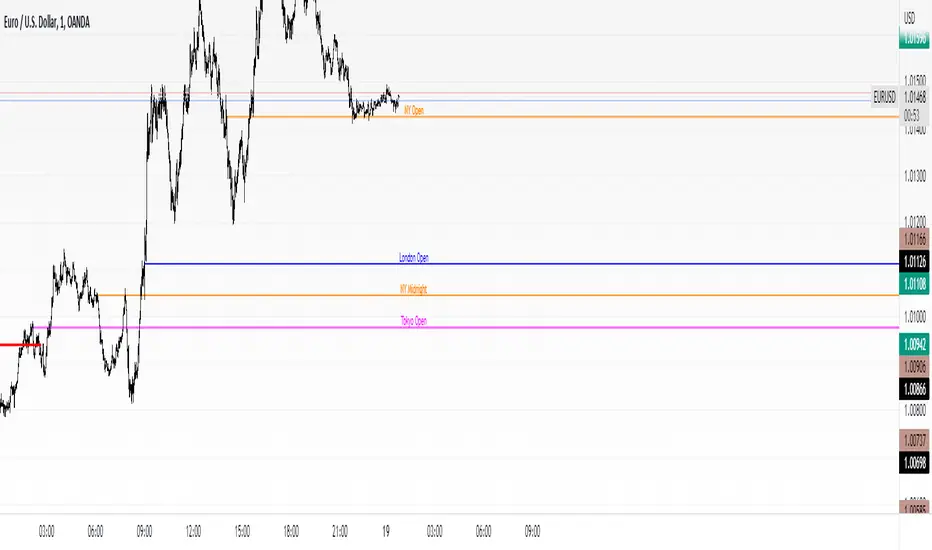
fxOpensPrints lines from the opening price of the three major forex session, plus from the New York midnight opening price.
Has some customizable settings.
Alerts for price crossing the levels.
Somewhat of a work in progress.
Multi Exchange Relative Volume - FOREXHello traders! This is my first script that I will publish here. This script calculates the relative volume based on the average volume at that time of the day across different brokers.

MACD Volume S2 By Gammaprod>> How to use this indicator :
1. Set your teadingview theme to dark theme.
2. My indicator is valid for forex, stock and but more valid for crypto.
3. Use three timeframe for more validation (choose between those, that fit to your trading style) :
- Timeframe 1m, 5m, and 15m for Scalping
- Timeframe 30m, 1h and 4h for Intraday
- Timeframe 4h, 1D and 1W for Swing Trading
4 . Always use THREE INDICATORS FROM GAMMAPROD, those three indicators is back to back each other, by the way, I only made those three indicators only (for now) :
- Trendlines Boll Ichi Crypto by Gammaprod
- Stoch RSI Divs Zone Crypto by Gammaprod
- MACD Volume Crypto by Gammaprod
>> How to setting :
1. Trendlines Boll Ichi Crypto by Gammaprod
A. Support and Resistence
- Well if you familiar with this indicator you can add it, but recommended for Timeframe 30m or more
B. Trendlines Primary or Trendlines Secondary
- Timeframe 1m you DON'T NEED Trendlines Primary or Trendlines Secondary
- Timeframe 5m you DON'T NEED Trendlines Secondary, but you CAN ADD Trendlines Primary if you fell it helpful (for me, it is helpful to find where the candles start or the end trend or a consolidation or where the candles will surpass a resistance or a support).
- Timeframe 15m you DON'T NEED Trendlines Secondary, DEFENITELY add Trendlines Primary it will help to find where the candles stop or a consolidation or where the candles will surpass a resistance or a support).
- Timeframe 30m or more, DEFENITELY NEED BOTH Trendlines Primary and Secondary Trendlines, it will help to find where the candle stop or consolidation or where the candle will surpass a resistance or support).
C. Bolinger, Ichimoku Cloud and Lagging Span
- Please DON'T CHANGE IT at all, it's really helpful to know when and where to make an entry decesion or a trend or a consolidation, if you don't understand how to read it, you better to learn it first (on "how to read" section and "How to OPEN position" the section below)
2. Stoch RSI Divs Zone Crypto by Gammaprod (DON'T CHANGE IT)
3. MACD Volume Crypto by Gammaprod (DON'T CHANGE IT)
>> How to read :
1. Sell or Buy Priority :
A. Buy Priority
- Color background on macd and stoch rsi is pink or purple sell is the priority, (if you're not sure to buy, just wait until the best moment to sell)
B. Buy Priority
- Color background on macd and stoch rsi Teal or light green buy is the priority, (if you're not sure to sell, just wait until the best moment to buy)
C. Indecision / Golden Moment
- Color background on stoch rsi yellow is indecision / golden moment of reversal pattern (wait until it formed background only on Stoch RSI), please becareful at this moment.
2. Trend / Consolidation :
A. BULLISH trend
- When Stoch RSI and MACD have teal or light green background that's means BULLISH trend, better to confirm by the candle is above green cloud and lagging span (red line) is also above the candle.
B. BEARISH trend
- When Stoch RSI and MACD have the Pink or purple background that's means BEARISH trend, better to confirm by the candle is above purple cloud and lagging span (red line) is also below the candle.
C. CONSOLIDATION
- When Stoch RSI have the mix background that's means CONSOLIDATION, better to confirm by the candle is in or near to green / purple cloud and lagging span (red line) is also on the candle.
3. Special Mark
A. Ideal Bullish :
- Near line 20 and green / teal background = When Stoch RSI have the char R / H on lime color label, that's means divergence or hidden divergence for buy position, if you not see this label that's means just a standard confirmation for buy
B. Not an Ideal Bullish :
- Near line 80 and green / teal background = if this happens make sure you know what happen, it could be a false signal or bullish continual pattern
C. Ideal Bearish :
- Near line 80 and pink / purple background = When Stoch RSI have the char R / H on lime color label, that's means divergence or hidden divergence for buy position, if you not see this label that's means just a standard confirmation for sell position.
D. Not an Ideal Bearish:
- Near line 20 and pink / purple background = if this happens make sure you know what happen, it could be a false signal or bearish continual pattern
E. The Beginning of Reversal (from BEARISH to BULLISH) :
- When Stoch RSI line shaping GREEN position is near 20.
- MACD lines still PINK, position lines is UNDER the HISTOGRAM, but the HISTOGRAM start to SHAPE FALL PINK (light pink) and the BACKGROUND still PINK / PURPLE.
- Position CANDLES NEAR BLUE line, NEAR PURPLE CLOUD, and lagging span (red line) STILL ON the area candle. (it used to be confirmed with the golden moment).
F. The Beginning of Reversal (from BULLISH to BEARISH) :
- When Stoch RSI line shaping PINK position is near 80.
- MACD lines still GREEN, position lines is ABOVE the HISTOGRAM, but the HISTOGRAM start to SHAPE FALL GREEN (light green) and the BACKGROUND still TEAL / GREEN.
- Position CANDLES NEAR WHITE line, NEAR TEAL CLOUD, and lagging span (red line) STILL ON the area candle. (it used to be confirmed with the golden moment).
G. False Signals, or It could be a Golden Moment (better to see it on TF 15 or bigger):
- Near line 20 or 80 and yellow background = When Stoch RSI have the char R / H on color label, that's means divergence or hidden divergence for buy / sell position, if you not see this label that's means just a standard confirmation for buy / sell depends on where the Stoch RSI line if near 20 that's means buy, near 80 means sell
>> How to OPEN position:
A. Bullish
1. Trendlines Boll Ichi Crypto by Gammaprod
- The candles above the green cloud.
- Lagging span (red line) above the candles.
- then open buy near yellow line (the first option) / blue line (the second option) (always confirm the position with two other indicators below).
2. Stoch RSI Divs Zone Crypto by Gammaprod
- Teal or Green background.
- The lines is shaping green.
- Better if on the bottom (at a range 20).
3. MACD Volume Crypto by Gammaprod
- Teal or Green background.
- The lines is shaped or shaping green.
- Better if at the green histogram.
B. Bearish
1. Trendlines Boll Ichi Crypto by Gammaprod
- The candles below the purple cloud.
- Lagging span (red line) below the candles.
- then open buy near yellow line (the first option) / white line (the second option) (always confirm the position with two other indicators below).
2. Stoch RSI Divs Zone Crypto by Gammaprod
- Pink or purple background.
- The lines are shaping pink.
- Better if the line on the top (at a range 80).
3. MACD Volume Crypto by Gammaprod
- Pink or purple background.
- The lines are shaped or shaping green.
- Better if at the pink histogram.
C. Consolidation
1. Trendlines Boll Ichi Crypto by Gammaprod
- The candles on the cloud (green or purple).
- Lagging span (red line) on the candles.
- then open buy near the white or blue line (always confirm the position with two other indicators below).
2. Stoch RSI Divs Zone Crypto by Gammaprod
- Mix background specially on a timeframe 15m or more.
- The line move fast up and down.
- Better if on the bottom or the top of the lines (at a range 20 or 80).
3. MACD Volume Crypto by Gammaprod
- Changing the background.
- The line is near the middle line.
- Have small Histogram.
>> The secret ingridient is comparing the timeframe :
The example scalping (Timeframe 1m, 5m and 15m)
- TF 1m is for making an open position.
- TF 5m is for making a judgement of the trend market.
- TF 15m is to confirm that judgement from TF 5m, be careful if it not similar then it used to be a consolidation or the beginning of the reversal.
There's a lot a way to open the position than above information that i gave it to you, but consider there are a limit char on this column, I hope it will help your trading and make a more profit on it.

Stoch RSI, Div, Zone S3 by Gammaprod>> How to use this indicator :
1. Set your teadingview theme to dark theme.
2. My indicator is valid for forex, stock and but more valid for crypto.
3. Use three timeframe for more validation (choose between those, that fit to your trading style) :
- Timeframe 1m, 5m, and 15m for Scalping
- Timeframe 30m, 1h and 4h for Intraday
- Timeframe 4h, 1D and 1W for Swing Trading
4 . Always use THREE INDICATORS FROM GAMMAPROD, those three indicators is back to back each other, by the way, I only made those three indicators only (for now) :
- Trendlines Boll Ichi Crypto by Gammaprod
- Stoch RSI Divs Zone Crypto by Gammaprod
- MACD Volume Crypto by Gammaprod
>> How to setting :
1. Trendlines Boll Ichi Crypto by Gammaprod
A. Support and Resistence
- Well if you familiar with this indicator you can add it, but recommended for Timeframe 30m or more
B. Trendlines Primary or Trendlines Secondary
- Timeframe 1m you DON'T NEED Trendlines Primary or Trendlines Secondary
- Timeframe 5m you DON'T NEED Trendlines Secondary, but you CAN ADD Trendlines Primary if you fell it helpful (for me, it is helpful to find where the candles start or the end trend or a consolidation or where the candles will surpass a resistance or a support).
- Timeframe 15m you DON'T NEED Trendlines Secondary, DEFENITELY add Trendlines Primary it will help to find where the candles stop or a consolidation or where the candles will surpass a resistance or a support).
- Timeframe 30m or more, DEFENITELY NEED BOTH Trendlines Primary and Secondary Trendlines, it will help to find where the candle stop or consolidation or where the candle will surpass a resistance or support).
C. Bolinger, Ichimoku Cloud and Lagging Span
- Please DON'T CHANGE IT at all, it's really helpful to know when and where to make an entry decesion or a trend or a consolidation, if you don't understand how to read it, you better to learn it first (on "how to read" section and "How to OPEN position" the section below)
2. Stoch RSI Divs Zone Crypto by Gammaprod (DON'T CHANGE IT)
3. MACD Volume Crypto by Gammaprod (DON'T CHANGE IT)
>> How to read :
1. Sell or Buy Priority :
A. Buy Priority
- Color background on macd and stoch rsi is pink or purple sell is the priority, (if you're not sure to buy, just wait until the best moment to sell)
B. Buy Priority
- Color background on macd and stoch rsi Teal or light green buy is the priority, (if you're not sure to sell, just wait until the best moment to buy)
C. Indecision / Golden Moment
- Color background on stoch rsi yellow is indecision / golden moment of reversal pattern (wait until it formed background only on Stoch RSI), please becareful at this moment.
2. Trend / Consolidation :
A. BULLISH trend
- When Stoch RSI and MACD have teal or light green background that's means BULLISH trend, better to confirm by the candle is above green cloud and lagging span (red line) is also above the candle.
B. BEARISH trend
- When Stoch RSI and MACD have the Pink or purple background that's means BEARISH trend, better to confirm by the candle is above purple cloud and lagging span (red line) is also below the candle.
C. CONSOLIDATION
- When Stoch RSI have the mix background that's means CONSOLIDATION, better to confirm by the candle is in or near to green / purple cloud and lagging span (red line) is also on the candle.
3. Special Mark
A. Ideal Bullish :
- Near line 20 and green / teal background = When Stoch RSI have the char R / H on lime color label, that's means divergence or hidden divergence for buy position, if you not see this label that's means just a standard confirmation for buy
B. Not an Ideal Bullish :
- Near line 80 and green / teal background = if this happens make sure you know what happen, it could be a false signal or bullish continual pattern
C. Ideal Bearish :
- Near line 80 and pink / purple background = When Stoch RSI have the char R / H on lime color label, that's means divergence or hidden divergence for buy position, if you not see this label that's means just a standard confirmation for sell position.
D. Not an Ideal Bearish:
- Near line 20 and pink / purple background = if this happens make sure you know what happen, it could be a false signal or bearish continual pattern
E. The Beginning of Reversal (from BEARISH to BULLISH) :
- When Stoch RSI line shaping GREEN position is near 20.
- MACD lines still PINK, position lines is UNDER the HISTOGRAM, but the HISTOGRAM start to SHAPE FALL PINK (light pink) and the BACKGROUND still PINK / PURPLE.
- Position CANDLES NEAR BLUE line, NEAR PURPLE CLOUD, and lagging span (red line) STILL ON the area candle. (it used to be confirmed with the golden moment).
F. The Beginning of Reversal (from BULLISH to BEARISH) :
- When Stoch RSI line shaping PINK position is near 80.
- MACD lines still GREEN, position lines is ABOVE the HISTOGRAM, but the HISTOGRAM start to SHAPE FALL GREEN (light green) and the BACKGROUND still TEAL / GREEN.
- Position CANDLES NEAR WHITE line, NEAR TEAL CLOUD, and lagging span (red line) STILL ON the area candle. (it used to be confirmed with the golden moment).
G. False Signals, or It could be a Golden Moment (better to see it on TF 15 or bigger):
- Near line 20 or 80 and yellow background = When Stoch RSI have the char R / H on color label, that's means divergence or hidden divergence for buy / sell position, if you not see this label that's means just a standard confirmation for buy / sell depends on where the Stoch RSI line if near 20 that's means buy, near 80 means sell
>> How to OPEN position:
A. Bullish
1. Trendlines Boll Ichi Crypto by Gammaprod
- The candles above the green cloud.
- Lagging span (red line) above the candles.
- then open buy near yellow line (the first option) / blue line (the second option) (always confirm the position with two other indicators below).
2. Stoch RSI Divs Zone Crypto by Gammaprod
- Teal or Green background.
- The lines is shaping green.
- Better if on the bottom (at a range 20).
3. MACD Volume Crypto by Gammaprod
- Teal or Green background.
- The lines is shaped or shaping green.
- Better if at the green histogram.
B. Bearish
1. Trendlines Boll Ichi Crypto by Gammaprod
- The candles below the purple cloud.
- Lagging span (red line) below the candles.
- then open buy near yellow line (the first option) / white line (the second option) (always confirm the position with two other indicators below).
2. Stoch RSI Divs Zone Crypto by Gammaprod
- Pink or purple background.
- The lines are shaping pink.
- Better if the line on the top (at a range 80).
3. MACD Volume Crypto by Gammaprod
- Pink or purple background.
- The lines are shaped or shaping green.
- Better if at the pink histogram.
C. Consolidation
1. Trendlines Boll Ichi Crypto by Gammaprod
- The candles on the cloud (green or purple).
- Lagging span (red line) on the candles.
- then open buy near the white or blue line (always confirm the position with two other indicators below).
2. Stoch RSI Divs Zone Crypto by Gammaprod
- Mix background specially on a timeframe 15m or more.
- The line move fast up and down.
- Better if on the bottom or the top of the lines (at a range 20 or 80).
3. MACD Volume Crypto by Gammaprod
- Changing the background.
- The line is near the middle line.
- Have small Histogram.
>> The secret ingridient is comparing the timeframe :
The example scalping (Timeframe 1m, 5m and 15m)
- TF 1m is for making an open position.
- TF 5m is for making a judgement of the trend market.
- TF 15m is to confirm that judgement from TF 5m, be careful if it not similar then it used to be a consolidation or the beginning of the reversal.
There's a lot a way to open the position than above information that i gave it to you, but consider there are a limit char on this column, I hope it will help your trading and make a more profit on it.

Stochastic Moving AverageHi all,
This Strategy script combines the power of EMAs along with the Stochastic Oscillator in a trend following / continuation manner, along with some cool functionalities.
I designed this script especially for trading altcoins, but it works just as good on Bitcoin itself and on some Forex pairs.
______ SIGNALS ______
The script has 4 mandatory conditions to unlock a trading signal. Find these conditions for a long trade below (works the exact other way round for shorts)
- Fast EMA must be higher than Slow EMA
- Stochastic K% line must be in oversold territory
- Stochastic K% line must cross over Stochastic D% line
- Price as to close between slow EMA and fast EMA
Once all the conditions are true, a trade will start at the opening of the next
______ SETTINGS ______
- Trade Setup:
Here you can choose to trade only longs or shorts and change your Risk:Reward.
You can also decide to adjust your volume per position according to your risk tolerance. With “% of Equity” your stop loss will always be equal to a fixed percentage of your initial capital (will “compound” overtime) and with “$ Amount” your stop loss will always be 'x' amount of the base currency (ex: USD, will not compound)
Stop Loss:
The ATR is used to create a stop loss that matches current volatility. The multiplier corresponds to how many times the ATR stop losses and take profits will be away from closing price.
- Stochastic:
Here you can find the usual K% & D% length and overbought (OB) and oversold (OS) levels.
The “Stochastic OB/OS lookback” increase the tolerance towards OB/OS territories. It allows to look 'x' bars back for a value of the Stochastic K line to be overbought or oversold when detecting an entry signal.
The “All must be OB/OS” refers to the previous “Stochastic OB/OS lookback” parameter. If this option is ticked, instead of needing only 1 OB/OS value within the lookback period to get a valid signal, now, all bars looked back must be OB/OS.
The color gradient drawn between the fast and slow EMAs is a representation of the Stochastic K% line position. With default setting colors, when fast EMA > slow EMA, gradient will become solid blue when Stochastic is oversold and when slow EMA > fast EMA, gradient will become solid blue when Stochastic is overbought
- EMAs:
Just pick your favorite ones
- Reference Market:
An additional filter to be certain to stay aligned with the current a market index trend (in our case: Bitcoin). If selected reference market (and timeframe) is trading above selected EMA, this strategy will only take long trades (vice-versa for shorts) Because, let’s face it… even if this filter isn’t bulletproof, you know for sure that when Bitcoin tanks, there won’t be many Alts going north simultaneously. Once again, this is a trend following strategy.
A few tips for increased performance: fast EMA and D% Line can be real fast… 😉
As always, my scripts evolve greatly with your ideas and suggestions, keep them coming! I will gladly incorporate more functionalities as I go.
All my script are tradable when published but remain work in progress, looking for further improvements.
Hope you like it!

Trend Trading with Currency Strength MeterThis is a trend trading strategy designed mainly for forex made of two big components:
First we have the currency meter, which is made of taking TSI of different INDEXes such as EUR, USD, GBP, JPY, NZD, AUD , CHF and CAD.
Once we establish which one is the weakest and most powerful, we pair them together and we go on that chart.
Lastly we check with the EMA 200 to confirm our direction.
We can see in this example for the USDJPY chart, that USD is the strongest, JPY is the weakest and ema confirm our bullish trend.
For timeframe in general I recommend big timeframes, 1-4h+ , and as a mentality a swing trading mentality, we can stay in trade for days/weeks.
For exit in general I recommend to exit when either one of the pairs losses/gain power or when the EMA is crossing with current candle
If you have any questions, let me know !

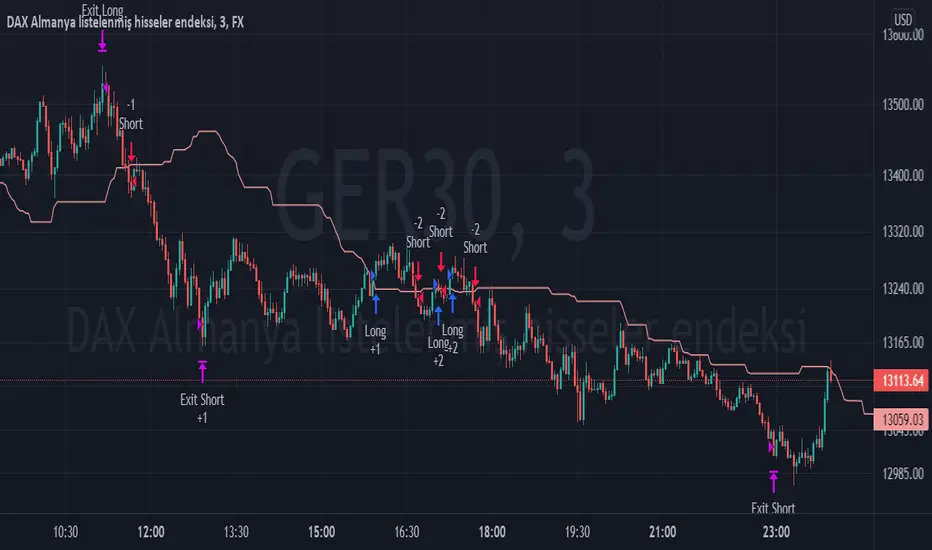
TPS - FX TradeI based my strategy on the Lagging Span 2 line in the Ichimoku Cloud. I actually designed the strategy for the DAX Germany index 3 Minutes period, but you can use it on any instrument you want. I would like to point out some points that you should pay attention to when optimizing the strategy for the instrument you want to use.
Position Take Profit and Stop Loss levels are tick calculations. These values will differ for each instrument. If you are trading in Forex, the values you will write here should be starting from the numbers after the comma in the instrument value. For example, if you want to take profit at "200" points in DAX, you must write "20000" in the Long or Short Take Profit Score field, this applies to the Stop Loss Points, but if you want to take profit or stop loss at 200 points in UKOIL, you must write "200" in the entry part.
Simple FX Market Hours█ OVERVIEW
A simple market session indicator that show you what market is in session according to the timezone you configured. It will draw a table with 4 cells matching 4 market Sydney, Tokyo, London and New York. Whenever market is in session the matching text will change colour.
█ WHAT MAKE THIS DIFFERENT
All other indicator on the market are either bar colouring, background colouring, or some sort of box drawing on the chart which is very messy and cluttered your chart. This indicator is as simple as it gets. The label are positions by default at the top right corner (you can change this in the config). It doesn’t draw anything on your chart so you can get right into your price action without anything blocking you.
Also, these type of indicator on the market are not auto converting the market session time to your your configured timezone, you will have to manually entered in the market session hours in your local time. This indicator does! Or perhaps I didn’t look hard enough. Either way I think there aren’t any indicator that are this simple.
█ HOW IT WORKS
I’m using table function (available to pinescript version 4 and above) to position the market labels and change colour of them according to if the market is in session or not.
For timezone, I have predefined all the market hours in all of the timezone from GMT-12 to GMT+12. When you select your timezone it will convert it to the symbol’s exchange timezone. Feel free to update the timezone if I had it incorrectly.
This script doesn’t take into account the DST because DST doesn’t starts or ends on a fixed date.
I also put in a check for symbol type using: syminfo.type == "forex”. So that it will only display if you are on forex pairs. You don’t need to hide it while you are looking at crypto or other assets. For convenience purposes.
█ NOTES
If you like the script be sure to press the like button it will help shows other people that this is useful. Thank you very much!
Fear Of Missing Out grid of forex tradingAbstract
This script finds potential safe grids placing limit orders without fear of missing out.
This script computes grids according to power of 1.0025 .
You can reference those price levels for your trading.
Introduction
Grid trading is a popular trading method.
Traders plan several price levels as grids and repeat buying at lower grids and selling at higher grids.
Grids can be round number like multiple of 100 pips.
Grids can also be support and resistance according to price history.
Some traders may think they need to adjust grids to trade.
However, there are several problems in choosing grids.
One problem is rate of change is related and therefore exponential. 20 to 30 is different from 30 to 40.
Another interesting point is there are some special impressing reversal price levels.
Several months ago, I had a question why usdjpy bounced near 108.3 .
After using a calculator, I found that 108.3 = 100 * 1.083 ≒ 100 * pow(1.0025,31) .
1.0025 , as known as 0.25% of change, is a potential stop out zone.
Therefore, we can compute grids and one grid is a little more than 1.0025 times than an another one.
After we finished computing grids, we can consider buy and sell near those grids.
Note that different traders may obtain different grid values.
For example, from 1.0 to 2.0 , it can be splited as 270 grids or 277 grids because pow(1.0025,277)<2 .
Those grids cannot always imply potential reversal points but they can be useful for traders looking for 0.25% profit targets with reducing fearing of buying or selling too early.
Computing grids
This script split from 1.0 to 10.0 into three segments.
One is 1.0 to 2.0 .
The second segment is from 2.0 to 5.0 .
The third segment is from 5.0 to 10.0 .
This script does the same thing for 0.1 to 1.0 , 10.0 to 100.0 , and so on.
For 1.0 to 2.0 and 5.0 to 10.0 , this script split a segment as 270 grids.
For 2.0 to 5.0 , this script split a segment as 360 grids.
The last step is display the next grids to the daily low and daily high.
Maybe also display the grids behind grids shown.
Parameters
x1,x2,x3,x4 : display the next x1,x2,x3,x4 grids to daily high and daily low. 1 means the next grid to daily high and daily low. 2 means the next grid to 1.
x_seg : default 2.0 . This script split from 1.0 to 10.0 into three segments. One is 1.0 to x_seg. The second segment is from x_seg to 10.0/x_seg . The third segment is from 10.0/x_seg to 10.0 .
x_grid1 : how many grids in the first segment
x_grid2 : how many grids in the second segment
x_lowprice : add this number for bigger grid distance. Generally, you don't need this number when trading forex but you may need it in stock trading. For stocks with price between 50 to 100, I recommend you use x_lowprice=100.
Conclusion and suggestions
This script can find potential grids for trading.
If price touches grids usually, we can consider buy and sell after price touches grids.
If price reverses before touching grids usually, we may consider buy and sell before price touches grids.
Those grids can remind us don't buy too much unless the price touches the next grid.
For instruments with less volatility, maybe we need more grids.
For traders with more money, they may also consider more grids for more dedicated range trading to collect more profit.
Reference
Sorry, I forgot them.

BollingerBands Strat + pending order alerts via TradingConnectorSoftware part of algotrading is simpler than you think. TradingView is a great place to do this actually. To present it, I'm publishing each of the default strategies you can find in Pinescript editor's "built-in" list with slight modification - I'm only adding 2 lines of code, which will trigger alerts, ready to be forwarded to your broker via TradingConnector and instantly executed there. Alerts added in this script: 14, 17, 20 and 23.
SCRIPT INCLUDES PENDING ORDERS AND ALERTS! Alert will be sent to MetaTrader when order is triggered, but not yet filled. That means if market conditions change and order does not get filled, it needs to be cancelled as well, and there are alerts for that in the script as well.
How it works:
1. TradingView alert fires.
2. TradingConnector catches it and forwards to MetaTrader4/5 you got from your broker.
3. Trade gets executed inside MetaTrader within 1 second of fired alert.
When configuring alert, make sure to select "alert() function calls only" in CreateAlert popup. One alert per ticker is required.
Adding stop-loss, take-profit, trailing-stop, break-even or executing pending orders is also possible. These topics have been covered in other example posts.
This routing works for Forex, indices, stocks, crypto - anything your broker offers via their MetaTrader4 or 5.
Disclaimer: This concept is presented for educational purposes only. Profitable results of trading this strategy are not guaranteed even if the backtest suggests so. By no means this post can be considered a trading advice. You trade at your own risk.
If you are thinking to execute this particular strategy, make sure to find the instrument, settings and timeframe which you like most. You can do this by your own research only.

Scalping Trading System bot Crypto and StocksThis is a trend trading strategy scalping bot that can work with any type of market. However I concluded my tests so far with Crypto, Stocks and Forex, and with optimizations always could be found some profitable settings.
Indicators
SImple Moving Average
Exponential Moving Average
Keltner Channels
MACD Histogram
Stochastics
Rules for entry
long= Close of the candle bigger than both moving averages and close of the candle is between the top and bot levels from Keltner. At the same time the macd histogram is negative and stochastic is below 50.
short= Close of the candle smaller than both moving averages and close of the candle is between the top and bot levels from Keltner. At the same time the macd histogram is positive and stochastic is above 50.
Rules for exit
We exit when we meet an opposite reverse order.
This strategy has no risk management inside, so use it with caution !

Advanced Forex SessionsEssential for ALL Forex Day Traders!
Don't waste your time trading Forex Sessions with little to no volume or volatility!
The Advanced Forex Sessions tool will search through all 4 sessions, tally up the total volume and ticks moved, and show you which session has the most movement.
It will show you the two best sessions on chart and optionally color the background too.
Configure the position & size of the Infographic table as well as custom Forex Session times and colors.

[KL] Double Bollinger Bands Strategy (for Crypto/FOREX)This strategy uses a setup consisting of two Bollinger Bands based on the 20 period 20-SMA +/-
(a) upper/lower bands of two standard deviations apart, and
(b) upper/lower bands of one standard deviation apart.
We consider price at +/- one standard deviation apart from 20-SMA as the "Neutral Zone".
If price closes above Neutral Zone after a period of consolidation, then it's an opportunity for entry. Strategy will long, anticipating for breakout.
The illustration below shows price closing above the Neutral Zone after a period of consolidation.
a.c-dn.net
Position is exited when prices closes at Neutral Zone (being lower than prior bars)

Moving Stop-Loss mechanism + alerts to MT4/MT5"How to code moving stop-loss mechanism", is one of the most often repeating questions in private messages I receive, so just to focus on this mechanism, I made a spin-off from my previous script: TradingView-Alerts-to-MT4-MT5-dynamic-variables-NON-REPAINTING .
The logic here moves the stop-loss each time a trade is running and a new pivot high/low is detected. When such event occurs (UpdateLongStopLoss or UpdateShortStopLoss), stoploss_long or stoploss_short mutable variable is modified. And it needs to be coded inside strategy.exit() line as "stop=stoploss_long" or "stop=stoploss_short". Entries are pretty straightforward - on Stoch crosses.
Last lines of the script show how to wrap information about such updates and send send alerts to MetaTrader via TradingConnector for execution in Forex/indices/commodities/crypto markets via MetaTrader. Please note that "tradeid=" variable must be passed with each alert, to let MetaTrader know which trade to modify. SLMOD, TPMOD are recently added commands, along with BE (as in "move stop-loss to breakeven" - but that's another topic).
Please disregard strategy backtest results, as this script is for coding education purposes only. However, it seems with the stop-loss mechanism enabled, the results are even better, than in original version of the script :)

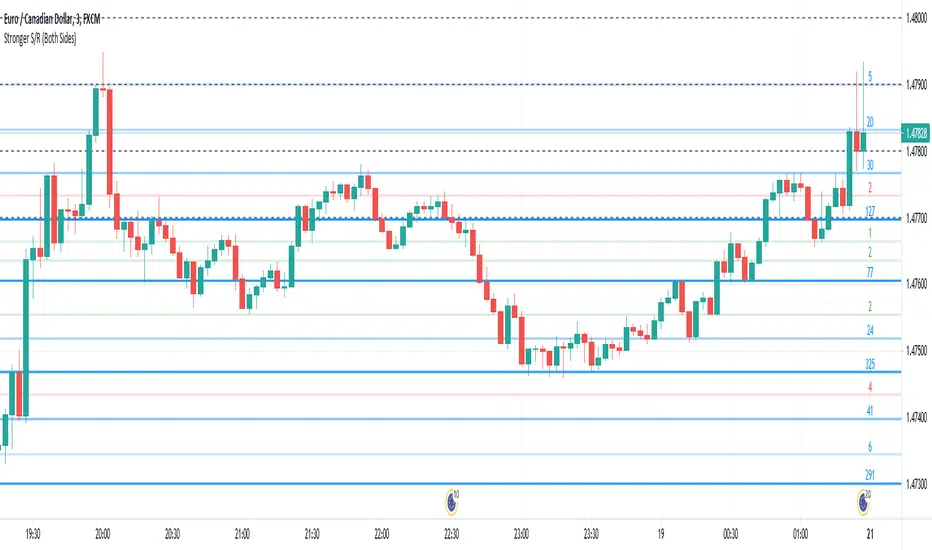
Stronger Classical Support/Resistance + Round LevelsI wrote some Support/Resistance scripts before this. In this new script, I implemented the logic of the code from the scratch, so it's very different from my previous S/R indicators and I think it's more advanced, accurate and efficient.
As the result it could do the followings for now:
- Draw more strong classical resistance/support levels by checking previous direction changes of the chart as far as Pine technically allows
- Colorize the levels based on the counted points of retracement/pullback (The darker the color is, the stronger the level is.)
- Show the number of reactions to each level
- Change the color of each level based on its main role as support, resistance or both
- Draw close round levels to current price for Forex pairs
I suggest all users of my previous S/R indicators to try this one.
Feel free to send me any issue or opinion!
Bollinger bubble | Forex editionBollinger bubble is an edition for forex market. Work better en JPY pairs.
We buy when a candle open & close outside the lower bollingers band and we target the last highest point on the last 10 candles.
And we sell when a candle open & close outside the higher bollingers band we the target the last lowest point on the last 10 candles.

Past and Upcoming Forex and NYSE Start/End Bar HighlighterThis script highlights the start and end of past sessions and also for upcoming sessions of the current day. Additionally, the start/end bars of the current day can be marked with a text label.
Time zone parameters are available for all time parameters, so that local exchange times can be configured, without the need for manual time zone or daylight saving time (DST) adjustments. Tradingview’s internal time calculations take care of the conversion.
For ease of use, the script comes preconfigured with the start/end times of the Forex and NYSE trading sessions. If you need more highlighted bars, just add the script multiple times and adapt the configuration as needed.

TradingView Alerts to MT4 MT5 - Forex, indices, commoditiesHowdy Algo-Traders! This example script has been created for educational purposes - to present how to use and automatically execute TradingView Alerts on real markets.
I'm posting this script today for a reason. TradingView has just released a new feature of the PineScript language - ALERT() function. Why is it important? It is finally possible to set alerts inside PineScript strategy-type script, without the need to convert the script into study-type. You may say triggering alerts straight from strategies was possible in PineScript before (since June 2020), but it had its limitations. Starting today you can attach alert to any custom event you might want to include in your PineScript code.
With the new feature, it is easier not only to execute strategies, but to maintain codebase - having to update 2 versions of the code with each single modification was... ahem... inconvenient. Moreover, the need to convert strategy into study also meant it was required to rip the code from all strategy...() calls, which carried a lot of useful information, like entry price, position size, and more, definitely influencing results calculated by strategy backtest. So the strategy without these features very likely produced different results than with them. While it was possible to convert these features into study with some advanced "coding gymnastics", it was also quite difficult to test whether those gymnastics didn't introduce serious, bankrupting bugs.
//////
How does this new feature work? It is really simple. On your custom events in the code like "GoLong" or "GoShort", create a string variable containing all the values you need inside your alert and this string variable will be your alert's message. Then, invoke brand new alert() function and that's it (see lines 67 onwards in the script). Set it up in CreateAlert popup and enjoy. Alerts will trigger on candle close as freq= parameter specifies. Detailed specification of the new alert() function can be found in TradingView's PineScript Reference (www.tradingview.com), but there's nothing more than message= and freq= parameters. Nothing else is needed, it is very simple. Yet powerful :)
//////
Alert syntax in this script is prepared to work with TradingConnector. Strategy here is not too complex, but also not the most basic one: it includes full exits, partial exits, stop-losses and it also utilizes dynamic variables calculated by the code (such as stop-loss price). This is only an example use case, because you could handle variety of other functionalities as well: conditional entries, pending entries, pyramiding, hedging, moving stop-loss to break-even, delivering alerts to multiple brokers and more.
//////
This script is a spin-off from my previous work, posted over a year ago here: Some comments on strategy parameters have been discussed there, but let me copy-paste most important points:
* Commission is taken into consideration.
* Slippage is intentionally left at 0. Due to shorter than 1 second delivery time of TradingConnector, slippage is practically non-existing.
* This strategy is NON-REPAINTING and uses NO TRAILING-STOP or any other feature known to be causing problems.
* The strategy was backtested on EURUSD 6h timeframe, will perform differently on other markets and timeframes.
Despite the fact this strategy seems to be still profitable, it is not guaranteed it will continue to perform well in the future. Remember the no.1 rule of backtesting - no matter how profitable and good looking a script is, it only tells about the past. There is zero guarantee the same strategy will get similar results in the future.
Full specs of TradingView alerts and how to set them up can be found here: www.tradingview.com

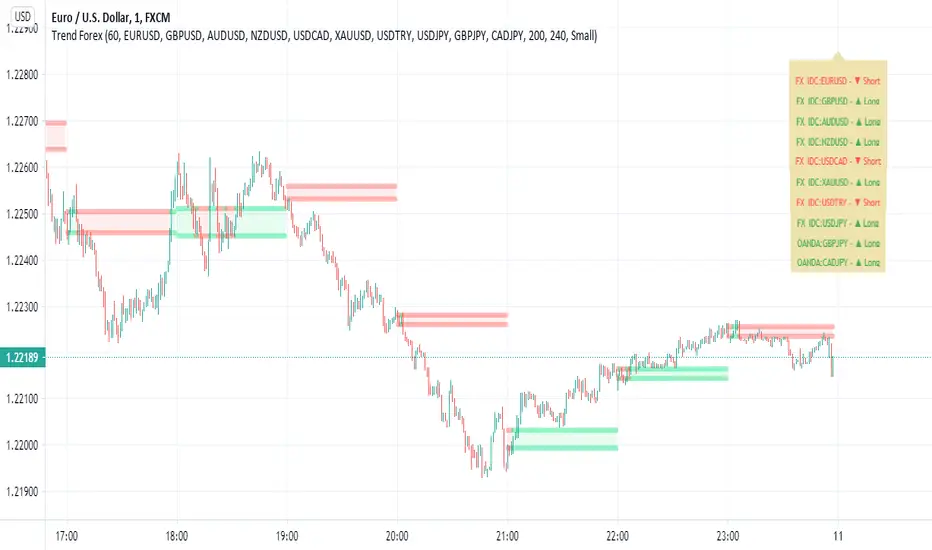
Trend Forexby request of a friend I just made this fast
using screen script taken from
this is a helper for those who play forex
it set on 1 hour non repainting candles MTF
we use it on 1-5 min chart.
you can play with the MTF to be 30 min or lower /higher etc
control of xcreen is by F for height (set to 240 min) you can change to other
its just for fast screening of things you like to see faster/ i suggest to attach to it other indicator if you plan to use it to make decision better
30 min mtf candles on 1 min chart