Banded Chikou Breakout — Quantifying Ichimoku MomentumTitle: Banded Chikou Breakout — Quantifying Ichimoku Momentum
Overview:
Banded Chikou Breakout (BCB) is a unique, algorithmic script designed to augment the capabilities of traders seeking substantial breakout opportunities. Constructed on the robust principles of the Ichimoku trading strategy, BCB is designed to quantify and filter the Chikou Span's significant breakouts above or below the price action. This script does not aim to replace the Ichimoku system; instead, it enhances it, providing an optimized tool for momentum trading.
Rationale:
Ichimoku traders often scrutinize the Chikou Span's position relative to price action to identify market trends. However, determining whether the Chikou Span is above or below due to a genuine trend or mere market noise can be challenging in choppy markets. BCB resolves this predicament by offering a unique way to interpret the Chikou Span's movement. It does so by quantifying the Chikou Span's momentum and utilizing Bollinger Bands to determine its significance. By effectively differentiating substantial movements from the insignificant, BCB can help traders better navigate the market and increase their potential for profitable trades.
How it Works:
BCB combines three key elements: a Momentum Script (simulating Chikou Span), a Bollinger Band Script, and a Timeframe Switcher, all working together to provide a refined trading perspective.
Momentum Script: Calculates the price difference between the current price and the price 'n' periods ago, transforming the Chikou Span into a quantifiable momentum value that signifies the strength and speed of a market move.
Bollinger Band Script: Computes a Simple Moving Average (SMA) around the momentum, plotting two 'bands' at a specified standard deviation from this SMA. This functionality allows traders to discern when the Chikou Span's momentum is abnormally high or low, signifying a potential significant breakout.
Timeframe Switcher: This feature lets traders apply the BCB script to a different timeframe from the one they are currently viewing. This capability can help traders identify higher timeframe breakouts and trade them with precision on the lower timeframe.
How to Use:
BCB is designed to complement the Ichimoku strategy for effective breakout identification.
Add the BCB script to your trading chart. It plots the momentum (yellow line) and Bollinger Bands (green lines) with the area between the bands shaded blue.
Utilize the Ichimoku strategy to identify larger and smaller timeframe trends.
Optional: Leverage the timeframe switcher to synchronize your trades with higher timeframe trends while operating on lower timeframes.
If the BCB momentum line crosses the upper Bollinger Band while the Ichimoku indicates a bullish trend, it signifies a potential significant upward breakout. Similarly, a cross below the lower band during a bearish trend could denote a significant downward breakout.
Remember, without the context provided by the Ichimoku system's trend analysis, BCB can yield false breakouts. It is, therefore, crucial to use these tools in tandem. I like to check for an Ichimoku trend on the 4H and 1H charts, and then use BCB on charts <60 minutes to capture trends with precision.
在腳本中搜尋"ichimoku"

Ichimoku Z-Score Stochastic Oscillator with Kumo Depth Analysis---
Ichimoku Z-Score Stochastic Oscillator with Kumo Depth Analysis
---
Script Overview
Welcome to the Advanced Ichimoku Z-Score Stochastic Oscillator with Kumo Depth Analysis. This unique strategy is designed to provide a comprehensive, multi-timeframe trading view by leveraging the Ichimoku Cloud, Z-Score, Stochastic Oscillator, and an innovative implied volatility measure – the Kumo Depth. By integrating these powerful tools into one script, traders can make more informed decisions by considering trend strength, volatility, and volume in one holistic view.
Rationale & Strategy
The script was created with the rationale that trading decisions should not only be based on price action and volume, but also on market trend strength and implied volatility. The script integrates these various elements:
The Ichimoku Cloud, a versatile indicator that provides support and resistance levels, trend direction, and momentum all at once.
The Z-Score, a statistical measurement of a value's relationship to the mean (average) of a group of values.
The Stochastic Oscillator, a momentum indicator that uses support and resistance levels to determine probable trend reversals.
The Kumo Depth Analysis, an innovative measure of implied volatility and market trend strength derived from the thickness of the Ichimoku Cloud.
How It Works
This script works by providing visual buy and sell signals based on the confluence of the aforementioned tools.
Ichimoku Cloud and Z-Score: The script first calculates the Ichimoku Cloud lines for both a higher and lower timeframe and measures how much current prices deviate from the cloud using Z-Score.
Stochastic Oscillator: This Z-Score is then inputted into a Stochastic Oscillator, thus giving the oscillator a more normalized range.
Kumo Depth Analysis: Simultaneously, the thickness of the Ichimoku Cloud (Kumo) is calculated as an implied volatility indicator. This depth is normalized and used as a filter to ensure we are trading in a market with substantial trend strength.
Signals: Buy and sell signals are triggered based on the crossover and crossunder of the Stochastic Oscillator lines. Signals are then filtered based on their location relative to the Ichimoku Cloud (price should be above the cloud for buy signals and below for sell signals) and the normalized Kumo Depth.
How to Use
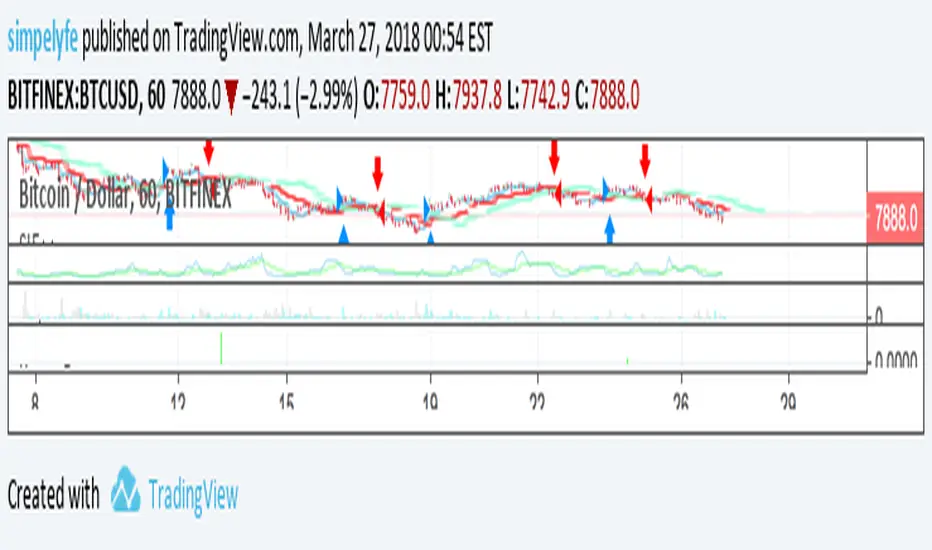
Signal Types: The script provides both strong and weak signals. Strong signals are accompanied by high volume, while weak signals are not. Strong buy signals are indicated with a green triangle at the top, strong sell signals with a red triangle at the bottom. Weak signals are shown as blue and yellow circles, respectively.
Trend Strength: The trend strength is shown by the normalized Kumo Depth. The greater the Kumo Depth, the stronger the trend.
Timeframes: You can customize the timeframes used for the calculations in the input settings.
Adjustments: Users can adjust parameters such as the Ichimoku settings, Stochastic Oscillator settings, timeframes, and Kumo Depth settings to suit their trading style and the characteristics of the asset they are trading.
This script is a complete trading strategy tool providing multi-timeframe, trend-following, and volume-based signals. It's best suited for traders who understand the concepts of trend trading, stochastic oscillators, and volatility measures and want to incorporate them all into one powerful, comprehensive trading strategy.


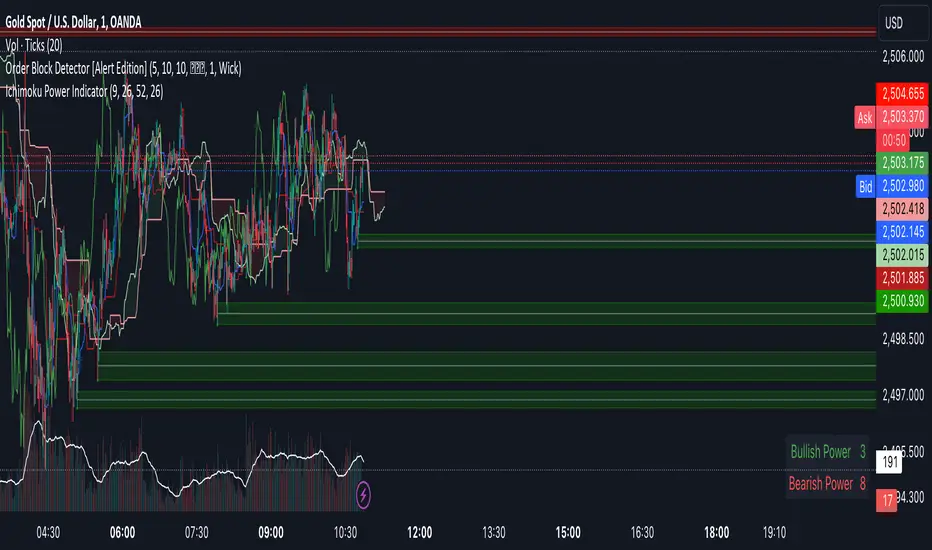
Ichimoku Power Indicator# Ichimoku Power Indicator
## Overview
The Ichimoku Power Indicator is an advanced tool that combines the traditional Ichimoku Cloud system with a unique power ranking mechanism. This indicator provides traders with a comprehensive view of market trends and potential reversal points, all while quantifying the strength of bullish and bearish signals.
## Key Features
1. **Full Ichimoku Cloud Visualization:** Displays all components of the Ichimoku Cloud system, including Conversion Line (Tenkan-sen), Base Line (Kijun-sen), Leading Span A and B (Kumo), and Lagging Span (Chikou Span).
2. **Power Ranking System:** Calculates and displays a bullish and bearish power score based on 11 different Ichimoku-derived conditions.
3. **Real-time Updates:** Power scores are updated in real-time as market conditions change.
4. **Easy-to-Read Display:** A clear, color-coded table shows the current bullish and bearish power scores.
5. **Customizable Parameters:** Allows adjustment of key Ichimoku settings to suit different trading styles and timeframes.
## How It Works
The indicator evaluates 11 different conditions derived from Ichimoku Cloud components:
1. Cloud color
2. Price position relative to the cloud
3. Tenkan-sen vs Kijun-sen
4. Price vs Tenkan-sen
5. Price vs Kijun-sen
6. Tenkan-sen vs Cloud
7. Kijun-sen vs Cloud
8. Chikou Span vs Cloud
9. Chikou Span vs Tenkan-sen
10. Chikou Span vs Kijun-sen
11. Chikou Span vs Price
Each bullish condition adds a point to the bullish power score, while each bearish condition adds a point to the bearish power score. The maximum score for each is 11.
## Interpretation
- Higher bullish scores suggest stronger upward trends or potential bullish reversals.
- Higher bearish scores indicate stronger downward trends or potential bearish reversals.
- When scores are close, it may indicate a period of consolidation or uncertainty.
## Use Cases
- Trend Confirmation: Use in conjunction with price action to confirm the strength of current trends.
- Reversal Detection: Watch for changes in power scores as early indicators of potential trend reversals.
- Entry and Exit Signals: High power scores can be used to identify optimal entry or exit points.
- Market Analysis: Gain a quick overview of market conditions across multiple assets or timeframes.
## Note
This indicator is designed to complement your existing trading strategy. Always use it in conjunction with other forms of analysis and proper risk management techniques.
Experiment with different timeframes and settings to find the configuration that best suits your trading style and the assets you trade.
Happy trading!
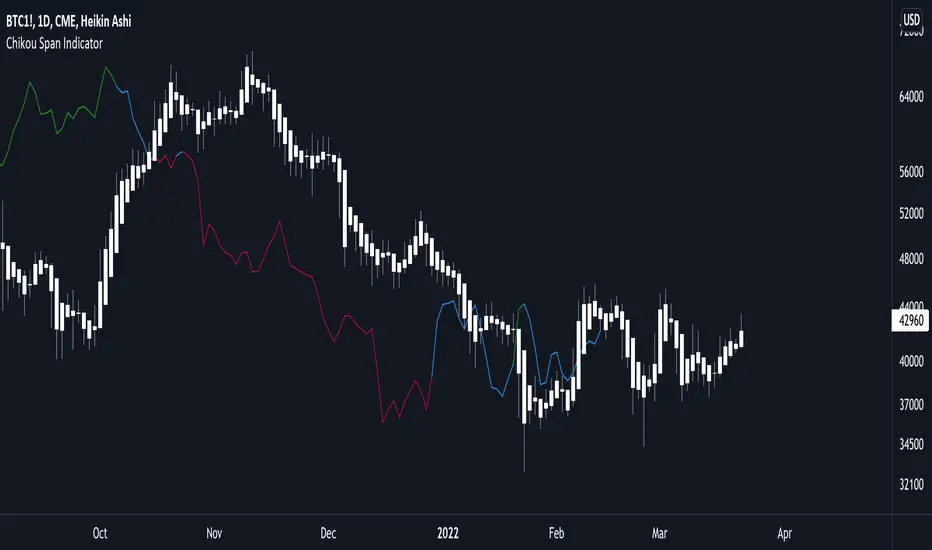
Ichimoku Chikou Lagging Span Bullish Bearish NeutralIchimoku Chikou Lagging Span Bullish Bearish Neutral
Ichimoku Buy & Sell SignalsIchimoku cloud with color coded circles to signal the cross of Tenkan and Kijun.
Ichimoku Cloud setup OualidIchimoku Cloud setup Oualid
plus sûr dans les trades
Mieux addapté non agressif


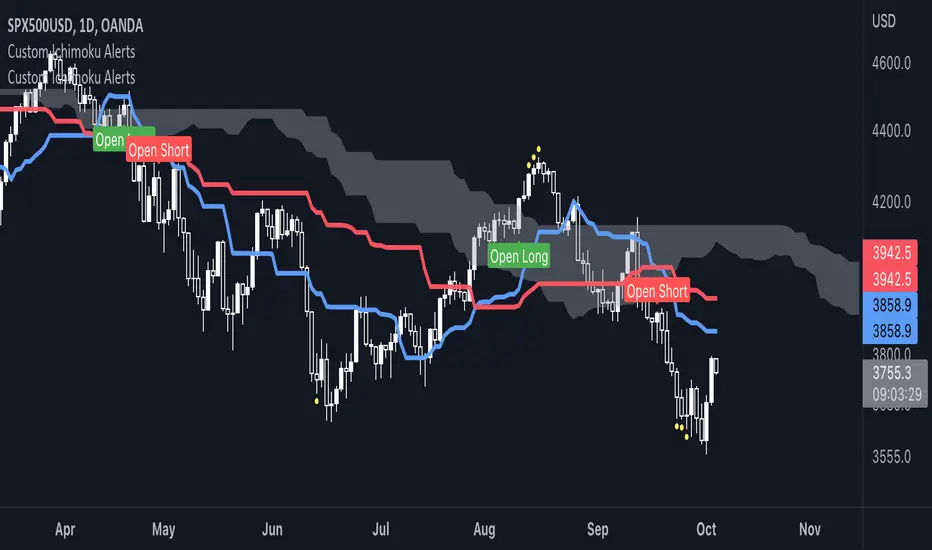
Ichimoku Cloud MasterIchimoku Cloud Master aims to provide the ichimoku trader with easy alert functionality to not miss out on valuable trade setups. The key purpose of this script is to better visualise crucial moments in Ichimoku trading. These alerts should not be used for botting in my opinion as they always need a human to confirm the ichimoku market structure. For example, is the Kijun-Sen flat and too far away from price? A good ichimoku trader will not enter at such a point in time.
Explanation of script:
Chikou(lagging span): pink line, this is price plotted 26 bars ago. People ignore the power of this it is crucial to see how chikou behaves towards past price action as seen in the chart below where we got an entry at red arrow because chikou bounced from past fractal bottom.
Kijun-Sen(base line): Black line or color coded line. This is the equilibrium of last 26 candles. To me this is the most important line in the system as it attracts price.
Kijun = (Highest high of 26 periods + Lowest low of 26 periods) ÷ 2
Tenkan-Sen(conversion line): Blue line. This is the equilibrium of last 9 candles. In a strong uptrend price stays above this line.
Tenkan = (Highest high of 9 periods + Lowest low of 9 periods) ÷ 2
Senkou A (Leading span A)= Pink cloud line, this is the average of the 2 components projected 26 bars in the future.
Senkou A = (Tenkan + Kijun) ÷ 2
Senkou B (Leading span B) = Green cloud line, this is the 52 day equilibrium projected 26 bars in the future.
Senkou B = (Highest high of prior 52 periods + Lowest low of prior 52 periods) ÷ 2
Notice how the distance between Chikou and the cloud is also 52 bars. This is all part of Hosoda's numbers which I am not going to explain here.
Fractals: These are the black triangles you find at key turning point. If you want to know how they work reseach williams fractals. I've used fractals with a period of 9 as it is an ichimoku number. These fractals are useful when working with ichimoku wave theory. Again I will not explain that here but in further education
Fractal Support: Ability to extend lines from the fractals which can be used as an entry/exit mechanism in your trading. For example wait for tenkan to cross kijun and then enter on fractal breakout.
Signals:
Crossing of Chikou (lagging span) with past Kijun-Sen: this will color code the Bars / Kijun-Sen (you can turn this off in options)
The script also has a signal for this, this will be the green and purple diamonds. Where green is bullish and purple is bearish.
wy is this important?
When current price plotted 26 candles back (chikou) crosses over the past equilibrium (kijun-sen) this usualy means price has moved past resistance levels where sellers come in. This indicates a switch in market structure and price is bullish from this point, this is the same in the other direction.
Kumo Twist: when the kumo cloud (future) has a crossover from for example green to red (bull to bear). The script plots these using the colored cross symbols as seen in the picture above. A chikou cross + a Kumo twist at same bar of next to eachother below the cloud can be a great entry sign: this would be an entry after cross in the chart above.
Kijun Bounce: when in an uptrend the price retraces back to Kijun-Sen and starts to go back up. These are marked by the yellow circles as seen in chart below:
low below Kijun-Sen and close above it
Strong Trend: when Tenkan is above Kijun, price above cloud, future cloud green, chikou above close, chikou above Kijun we establish a strong bullish trend. For bearish the exact opposite. The script has a function to send an alert at the start of such trends and to plot them with small colored circles above the bars.
Customisation:
I've added options to disable specific aspects of the indicator for those traders who do not want to use all aspects of the indicator. In the customisation tab I've given each part a clear title so you can use your own colors/shapes.
The perfect entry?
Further info:
Look into my education pane, I will be adding education in the future. The chance of me making a more advanced version of the script including line forecasting etc is rather high so watch out for that.
For those who want to master this system I recommend reading the book:
How to make money with the ichimoku system by Balkrishna M. Sadekar
Or the originals books by Hosoda the inventor of Ichimoku if you can get your hands on them and can read Japanese.
Almost all info about the ichimoku system you find on the internet will lose you money because they reduce the system to simple signals that do not generate money.
I will be providing educational material on tradingview using this indicator.

Ichimoku Horizon MTFIchimoku Horizon MTF — Multi-TimeFrame Ichimoku with auto-map
Overview
Ichimoku Horizon MTF plots classic Ichimoku on your current chart timeframe and projects up to three higher timeframes (TF1 / TF2 / TF3) onto the same chart. The goal is to keep one clean chart while still seeing higher-timeframe Ichimoku context (for example Daily / Weekly / Monthly).
On the screen, you typically see:
– the full Ichimoku set for your chart timeframe (Tenkan, Kijun, Kumo, Chikou),
– the same structure projected from TF1–TF3, each with its own colour family,
– an optional Kumo Midline (extra line, not part of original Ichimoku, used as a visual helper),
– and an optional TF banner showing which higher timeframes are currently mapped.
And optionally: A Kumo Midline (midpoint between SSA and SSB)
Kumo Midline (non-original Ichimoku addition)
The Kumo Midline is a personal addition.
It is not part of the original Ichimoku.
It is provided for informational and visual purposes only, as a helper to read the centre of the cloud.
It is calculated as the simple average of the two cloud boundaries:
Midline= SSA + SSB / 2
You can turn it ON/OFF globally, and also separately for each timeframe (Chart / TF1 / TF2 / TF3). The same logic (including the optional Midline) is applied to TF1 / TF2 / TF3 and projected onto your main chart.
Auto-map & timeframe presets
You control how TF1 / TF2 / TF3 are selected using two mechanisms:
Auto-map TF from chart (ON/OFF)
When ON, the script automatically chooses a profile based on your chart timeframe
(Scalp / Intraday / Swing / Long Term / Investment / Macro).
TF1 / TF2 / TF3 are always higher than the chart timeframe, with a consistent progression.
Preset Time Frame (when Auto-map = OFF)
When OFF, you choose a fixed preset, for example:
Scalp S — 1m / 5m / 15m
Intraday L — 1H / 4H / 1D
Swing — 1D / 1W / 1M
Investment — 1M / 3M / 6M
Macro — 3M / 6M / 12M
If you choose Custom, you manually set TF1 / TF2 / TF3 using the three “Timeframe selection” inputs in the TF1 / TF2 / TF3 sections.
This allows you to switch quickly between scalp / intraday / swing / macro profiles without editing any code.
TF banner (legend) & display options
The indicator includes an optional TF banner (a small panel) that acts as a timeframe legend:
Shows the active profile name (Scalp, Intraday M, Intraday XL, Swing, Long Term, Macro, Custom). Displays the three mapped timeframes (TF1 / TF2 / TF3) in short form (5m, 1H, 4H, 1D, 1W, 1M, etc.). Shows “TK / KJ” with small coloured squares for Tenkan and Kijun for each TF, matching the line colours on the chart.
You can control:
Show / hide the banner.
Position: Top / Bottom, Left / Center / Right.
Text colour, background, text size.
Each block (Chart, TF1, TF2, TF3) also has its own toggles for:
Tenkan
Kijun
Chikō
SSA
SSB
Kumo fill
Kumo Midline
This lets you keep only what you really need (for example: just HTF Kijun + HTF Kumo).
Colour design
Special care has been taken with the colour design:
Each timeframe uses its own colour family
(for example: warm colours for the chart timeframe, green for TF1, blue for TF2, neutral/grey for TF3), so the chart stays readable even when all TFs are displayed at once.Kumo fills are semi-transparent to provide context without hiding price action. Defaults are tuned for light charts, and every colour can be customised if you prefer another palette.
Built-in alerts
The script includes a small set of ready-to-use alerts, controlled by:
A global “Enable alerts” switch
A built-in cooldown to avoid alert spam
Available conditions (on the chart timeframe):
TK > KJ (UP) – Tenkan crosses above Kijun (filtered by a bullish HTF bias).
TK < KJ (DOWN) – Tenkan crosses below Kijun (filtered by a bearish HTF bias).
Kumo Breakout (UP) – Close breaks above the cloud (with bullish HTF filter).
Kumo Breakout (DOWN) – Close breaks below the cloud (with bearish HTF filter).
All TF Bullish – Chart + TF1 + TF2 + TF3 all have Tenkan > Kijun (full bullish alignment).
All TF Bearish – Chart + TF1 + TF2 + TF3 all have Tenkan < Kijun (full bearish alignment).
HTF Confirms (BULL) – Bullish TK cross on the chart timeframe, with HTF support and price above the cloud.
HTF Confirms (BEAR) – Bearish TK cross on the chart timeframe, with HTF confirmation and price below the cloud.
To use them:
Add an alert on the indicator,
Choose one of these conditions,
Use “Once per bar close” for cleaner signals.
No-repaint logic
Higher-timeframe data is fetched using request.security() with:
barmerge.gaps_off
barmerge.lookahead_off
This means:
No artificial lookahead,
No repainting,
Apart from the normal forward shift of the Ichimoku cloud, which is how standard Ichimoku works by design.
If the chart get “stuck on the left”
stuck on the left side, or misaligned. If you see the TF banner or right-side labels not updating correctly: Clear the TradingView app cache (or restart the app / browser)
Reload the chart. This usually forces TradingView to redraw all tables and labels correctly and fixes the display issue.
Disclaimer
This script is provided for educational and informational purposes only.
It does not constitute financial or investment advice and should not be used as a standalone signal provider.
Always do your own analysis and use proper risk management before taking any trade.
Thanks for using Ichimoku Horizon MTF.

Ichimoku all signalsIchimoku Cloud All Signals!
This indicator shows all Ichimoku Cloud signals for (entering/exiting/confirming/or even staying) in a position.
you can choose a signal related to your strategy and use it.
you can choose which signals to be shown on the chart by changing the settings.
here are some examples of signals that you can get from this indicator:
Crossover/under conversion line & base line
Crossover/under lead line1 & lead line2
Crossover/under conversion line & lead line1
Crossover/under base line & lead line1
Crossover/under conversion line & lead line2
Crossover/under base line & lead line2
Crossover/under close & base line
Cloud Breakouts in both directions!
and 74 signals more !!!!

Ichimoku Compass(Ichimoku Cloud)Ichimoku Cloud Indicator for visualizing support/resistance levels. Candles turn from green to white when negative trend is detected.

ICHIMOKU Trading betaIchimoku Kinko Hyo is a trend-following trading system with 5 indicators. All the five indicators have a different purpose and successful Ichimoku trading required in-depth analysis of all indicators. The script interpreted each indicator and develop a score to indicate the overall strength.
I have taken the idea from the book “Trading with Ichimoku Clouds by MANESH PATEL”. The scoring system is mine to get an idea about how all the indicators are performing together.
If most of the indicators are confirming then the score will be high.
I am very new to Pinescript, so waiting for your comments and review.
You can view all comments by turning the comments on.

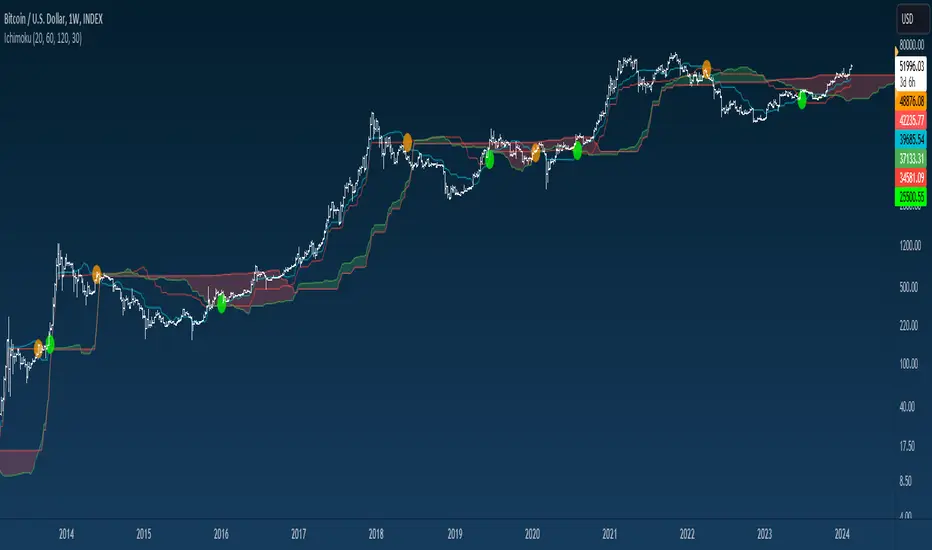
Ichimoku(s)ENGLISH
What is this indicator?
This is a doble Ichimoku cloud: one for the current time frame and another for a bigger time frame.
The user of the indicator can define that bigger time frame with a multiplier. By default it multiplies x6 the current TF (for example, if you watch at the 1 hour time frame the second kumo belongs to 6 hour TF).
Additionaly, an orange line replicates the senko span A without displacement. It is extra layer of visual information that can be hidded from settings.
Other ichimoku lines are hidden by default, but can be activated from "Style" tab at the settings.
How it should be used?
If gives Ichimoku traders perspective from bigger time frames. Can be used to avoid movements against major tendencies without the need to change charts.
CATALÀ*
Què és aquest indicador?
És un doble núvol d'Ichimoku: un pel time frame actual i un altre per un time frame superior.
L'usuari de l'indicador pot definir aquest time frame superior mitjançant un multiplicador. Per defecte multiplica x6 el TF actual (per exemple, si uses l'indicador al time frame d'1 hora, el segon kumo correspondrà al TF de 6 hores).
Adicionalment hi ha una línia taronja que replica el senko span A sense desplaçament. És una capa extra d'informació visual que pot ser amagada des de la configuració.
La resta de línies d'Ichimoku estan ocultes per defecte, però poden activar-se des de la pestanya "Style" de la configuració.
Com s'ha de fer servir?
Dóna als tradejadors d'Ichimoku perspective dels time frames superiors. Pot ser usat per evitar moviments contra tendències majors sense necessitat de canviar de gràfic.
*Catalan is a language speaked since 8th century in most eastern territories of the current Spain (Catalunya, Illes Balears, País Valencià), south of França and some zones of Italy. Catalan is spoken by some 9,000,000 people in Spain and some 125,000 in France, as well as by some 30,000 in Andorra and some 40,000 in Alghero.
Ichimoku Cloud+quality lineIchimoku Cloud+quality line
this is ichimoku indicator, only quality line added.
Ichimoku w/Heikin-Ashi Ichimoku w/Heikin-Ashi displays the Heikin-Ashi and leading lagging span of Ichimoku Kinko Hyo.
If you change to Heikin-Ashi as it is, the basis of the calculation of Ichimoku will also use the Heikin-Ashi, so after displaying the Heikin-Ashi independently, then the calculation uses the original candlestick.
Initially, two candlesticks are displayed so that you can switch between candlesticks and Heikin-Ashi. If you uncheck the standard candlesticks check box to hide them, only Heikin-Ashi will be displayed.
In addition, the lagging span is displayed as the leading lagging span in order to align the viewpoint to one current place.
一目均衡表の遅行スパンを先行させ、平均足を表示させる指標です。
標準のまま平均足に変更すると均衡表の計算のベースも平均足を使ってしまうため、平均足を独立して表示させた上で計算は元のローソク足を使用しています。
ローソク足と平均足を切り替えられるように、最初は2つのローソク足が表示されますが、標準のローソク足のチェックボックスを外して非表示とすれば平均足のみの表示となります。
また視点を現在の1箇所に揃えるために遅行スパンを先行遅行スパンとして表示しています。

Ichimoku Buy/Sell Signals of manual MTF Tenkan crossing KijunIchimoku Buy/Sell Signals based on fast, small time frame Tenkans crossing longer timeframes Kijuns - Manual MTF Analysis
This code marks the potential change of direction based on the input of one timeframe's Ichimoku Tenkan (conversion) line crossing over a higher, longer timeframe's Ichimoku Kijun (base) line.
Feel free to change the inputs if need be and to hide the yellow box. Use Ichimoku rules of Tenkan, Kijun, Lagging Span, and Cloud for Take profit/Stop Losses. It is best to wait 3-5 minutes after the signal to enter to confirm the trend and to confirm if the Lagging Span has broken key levels. I refer to the book Trading with Ichimoku - A Practical Guide to Low-Risk Ichimoku Strategies by Karen Peloille as the Ichimoku rulebook. Good luck.
For day trading/scalping/intraday - 1min/3min/5min
Tenkan Line Timeframe = 1min
Kijun Line Timeframe = 5min
For swing trading - multiple days/weeks - 4HR/Daily/Weekly Charts
Tenkan Line Timeframe = day
Kijun Line Timeframe = week

Ichimoku Cloud w. Signals and AlertsIchimoku Cloud w. Signals and Alerts highlights when the Ichimoku signals a Bullish or Bearish move as well as the crosses of the Conversion Line and the Base Line both up and down.
The Bullish signals and Bearish signals fire when the following criteria is met:
Bullish Setup:
1. Price close over Lead Lines (26 periods ahead)
2. Green Cloud (26 Periods ahead)
4. Conversion Line above Base Line
Bearish Setup:
1. Price close under Lead Lines (26 periods ahead)
2. Red Cloud (26 Periods ahead)
4. Conversion Line below Base Line
The initial signal will fire when that criteria hits, once that criteria hits, background will fill either green or red behind the bars where the criteria still applies and will have no background color if above criteria doesn't apply.
Once the background fill disappears you should begin looking to set a stop or exit as the Ichimoku maybe reversing.
Be sure to still use Lagging Span and the price position to the cloud on where it actually is before entering/exiting positions even if a signal is fired.
I have also included the ability to add alerts to both the Conversion Line/Base Line crosses as well as the initial signals for the Bullish and Bearish Ichimoku signals. The alerts are configured to easily be added for a webhook to push to a Discord channel as well.
Works on all timeframes to signal general direction of move.
