ST -Dashboard Volume MTF , [Sese04]User Guide: ST - Dashboard Volume MTF
Introduction
This script displays a multi-timeframe (MTF) volume dashboard, tracking buy and sell volumes and the moving averages of volume. It is designed for traders using ICT (Inner Circle Trader) and SMC (Smart Money Concepts) to quickly visualize market dynamics across multiple timeframes.
Settings and Features
📌 User Inputs
Customizable settings allow traders to adjust the dashboard display and volume moving averages.
Volume Display per Timeframe
show_vol_1m: Show volume for 1-minute chart.
show_vol_5m: Show volume for 5-minute chart.
show_vol_15m: Show volume for 15-minute chart.
show_vol_1h: Show volume for 1-hour chart.
show_vol_4h: Show volume for 4-hour chart.
show_vol_1d: Show volume for 1-day chart.
Volume Moving Average Settings
ma_length_short: Length of the short-term moving average (default 5 periods).
ma_length_long: Length of the long-term moving average (default 14 periods).
Dashboard Customization
dashboard_position: Dashboard position (Bottom Right, Bottom Left, Top Right, Top Left).
text_color: Text color for the dashboard.
text_size: Text size (small, normal, large).
How the Script Works
🔹 1. Calculating Buy and Sell Volume
The calculate_buy_sell function separates buy and sell volume based on the candle's open and close price:
If the closing price is higher than the opening price → Buy volume 📈.
If the closing price is lower or equal to the opening price → Sell volume 📉.
🔹 2. Retrieving Volume Data Across Multiple Timeframes
The function get_volumes collects buy and sell volume data for different timeframes using request.security().
The available timeframes are: 1m, 5m, 15m, 1h, 4h, and 1d.
🔹 3. Calculating Volume Moving Averages
The script uses ta.sma() to compute moving averages for volume trends:
ma_vol_short: Short-term moving average (e.g., 5 periods).
ma_vol_long: Long-term moving average (e.g., 14 periods).
🔹 4. Creating and Displaying the Dashboard
A table (table.new()) is generated at the last bar (barstate.islast) to display the volume data:
A title “📊 Volume Dashboard (Buy vs Sell)” in purple.
Column headers:
TIMEFRAME (e.g., 1M, 5M, 15M, 1H, 4H, 1D).
BUY VOLUME (dark blue).
SELL VOLUME (dark red).
Buy and Sell Volume values are displayed in their respective cells for easy reading.
How to Use This Script on TradingView?
Adding the Script
Open TradingView.
Go to Pine Editor and paste the script.
Click "Add to Chart".
Configuring the Settings
Open the indicator settings.
Enable/disable the desired timeframes.
Adjust the moving average lengths if necessary.
Interpreting the Data
Increasing buy volume across timeframes may indicate bullish momentum.
Rising sell volume suggests a bearish reversal.
Crossovers of volume moving averages can help detect market shifts.
Conclusion
This script is a powerful tool for analyzing volume dynamics across multiple timeframes. It provides a quick overview of the balance between buyers and sellers, essential for ICT scalping and liquidity-based trading.
🚀 Pro Tip: Combine this dashboard with other SMC indicators (engulfing candles, pivot points) to refine your trading decisions.
在腳本中搜尋"liquidity"

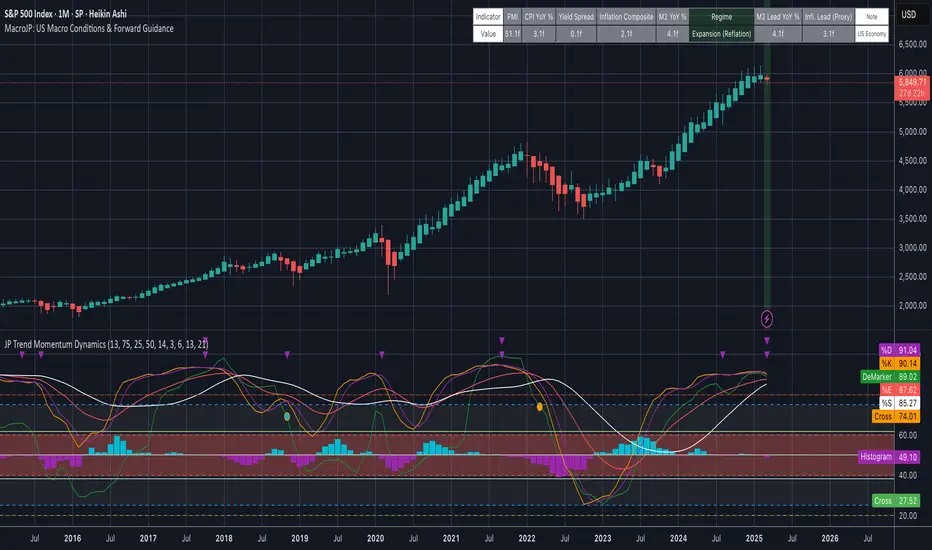
MacroJP: US Macro Conditions & Forward GuidanceMacroJP is a comprehensive, free-to-use TradingView indicator designed to provide a clear snapshot of the US macroeconomic environment. It consolidates key economic metrics into a single, interactive dashboard, allowing traders and investors to quickly assess current conditions and adjust their portfolio biases accordingly.
How It Works:
• Data Aggregation:
The indicator pulls monthly data from reputable free economic sources—specifically, ISM Manufacturing PMI, US CPI YoY, US M2 Money Supply, and US Treasury yields (10-year and 2-year). This robust dataset forms the backbone of the analysis.
• Composite Calculations:
By calculating a Composite Inflation Indicator (the average of CPI YoY and the yield spread) and evaluating the year-over-year change in M2, MacroJP gauges both the inflationary pressures and liquidity trends in the economy. These composite metrics offer a nuanced view that goes beyond single-indicator analysis.
Regime Classification:
The core strength of MacroJP lies in its quadrant classification system. It categorises the macro environment into four distinct regimes based on the direction of economic growth (derived from PMI) and inflation (from the Composite Inflation Indicator):
• Expansion (Reflation): Indicative of a recovering economy with rising production and moderate inflation—ideal for a bullish equity bias.
• Stagflation Risk: A scenario of weak growth coupled with high inflation, where a defensive posture is recommended.
• Slowdown (Deflationary): Characterised by contracting economic activity and falling prices, suggesting a move towards cash or high-quality bonds.
• Disinflationary Boom: Reflects strong growth with stable or falling inflation—an optimal environment for equities with some bond diversification.
Forward Guidance:
To enhance its predictive capability, MacroJP incorporates leading indicators by shifting key data points. For instance, it uses a forward-shifted M2 YoY value and a one-month shifted CPI proxy to offer insights into near-term trends. This approach helps in anticipating changes, providing a sort of “forward guidance” that can inform strategic asset allocation.
User Education:
The indicator features an intuitive table with on-hover tooltips that explain each metric, its relevance, and recommended investment biases. This educational layer is designed to empower users to not only monitor the economic pulse but also to understand the ‘why’ behind each reading, making it a valuable tool for both novice and experienced investors.
MacroJP brings clarity to complex macroeconomic dynamics, allowing users to make more informed decisions in volatile markets. Its seamless integration of free public data and detailed on-chart annotations makes it an indispensable tool for anyone looking to understand the broader economic context impacting their investments.
— Jaroslav
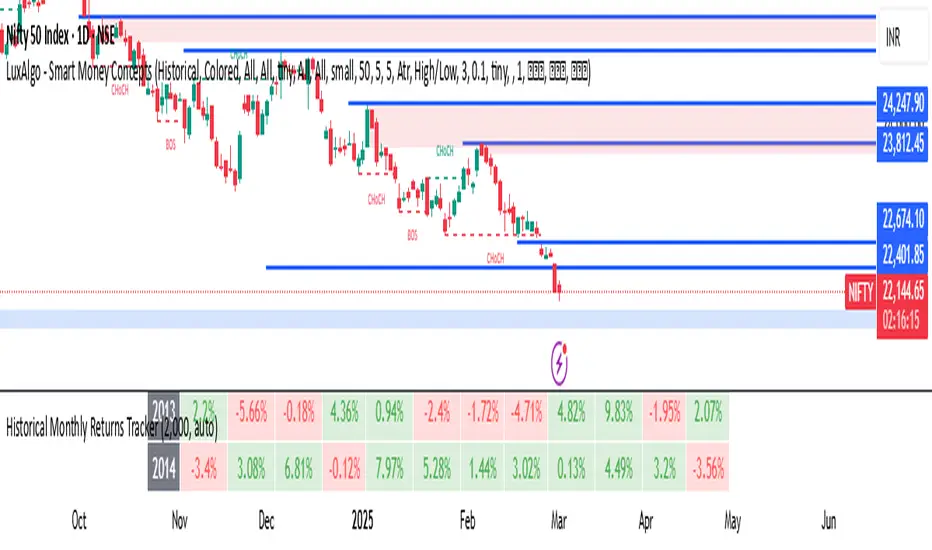
Historical Monthly Returns TrackerThe Historical Monthly Returns Tracker is a powerful Pine Script v5 indicator designed to provide a detailed performance analysis of an asset’s monthly returns over time. It calculates and displays the percentage change for each month, aggregated into a structured table. The indicator helps traders and investors identify seasonal trends, recurring patterns, and historical profitability for a selected asset.
Key Features
✅ Historical Performance Analysis – Tracks monthly percentage changes for any asset.
✅ Customizable Start Year – Users can define the beginning year for data analysis.
✅ Comprehensive Data Table – Displays a structured table with yearly returns per month.
✅ Aggregated Statistics – Shows average return, total sum, number of positive months, and win rate (WR) for each month.
✅ Clear Color Coding – Highlights positive returns in green, negative in red, and neutral in gray.
✅ Works on Daily & Monthly Timeframes – Ensures accurate calculations based on higher timeframes.
How It Works
Data Collection:
The script fetches monthly closing prices.
It calculates month-over-month percentage change.
The values are stored in a matrix for further processing.
Table Generation:
Displays a structured table where each row represents a year, and each column represents a month (Jan–Dec).
Monthly returns are color-coded for easy interpretation.
Aggregated Statistics:
AVG: The average return per month across all available years.
SUM: The total cumulative return for each month.
+ive: The number of times a month had positive performance vs. total occurrences.
WR (Win Rate): The percentage of times a month had a positive return.
Use Cases
📈 Seasonality Analysis: Identify which months historically perform better or worse.
📊 Risk Management: Plan trading strategies based on historical trends.
🔍 Backtesting Aid: Support algorithmic and discretionary traders with real data insights.
🔄 Asset Comparison: Compare different stocks, forex pairs, or cryptocurrencies for their seasonal behavior.
How to Use
Apply the Indicator to a chart in TradingView.
Ensure your timeframe is Daily or Monthly (lower timeframes are not supported).
The table will automatically populate based on available historical data.
Analyze the patterns, trends, and win rates to optimize trading decisions.
Limitations
⚠️ Requires a sufficient amount of historical data to provide accurate analysis.
⚠️ Works best on high-liquidity assets (stocks, indices, forex, crypto).
⚠️ Not a predictive tool but rather a historical performance tracker.
Final Thoughts
The Historical Monthly Returns Tracker is an excellent tool for traders seeking to leverage seasonal trends in their strategies. Whether you're a stock, forex, or crypto trader, this indicator provides clear, data-driven insights to help refine entry and exit points based on historical patterns.
🚀 Use this tool to make smarter, more informed trading decisions!
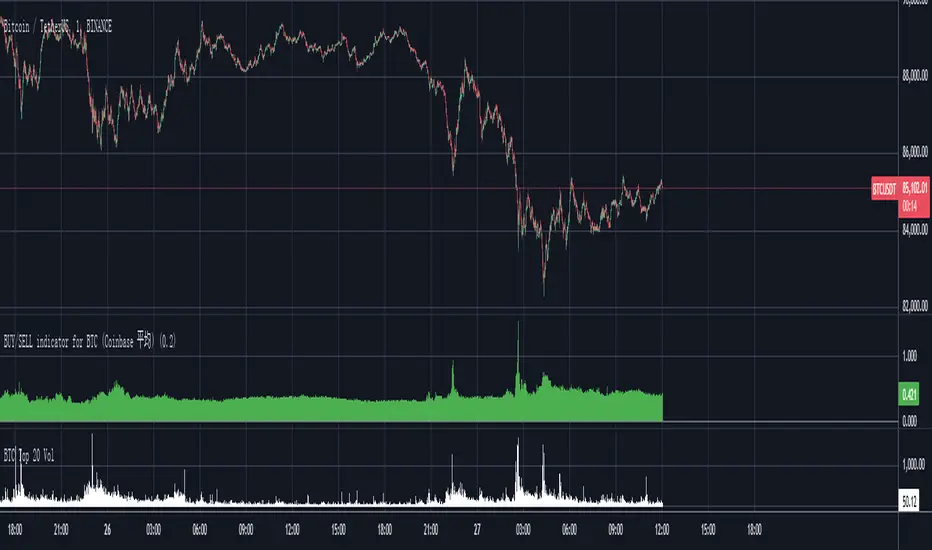
Bitcoin Total VolumeThis Pine Script indicator, titled "Bitcoin Top 16 Volume," is designed to provide traders with an aggregate view of Bitcoin (BTC) spot trading volume across leading cryptocurrency exchanges. Unlike traditional volume indicators that focus on a single exchange, this tool compiles data from a selection of the top exchanges as ranked by CoinMarketCap, offering a broader perspective on overall market activity.
The indicator works by fetching real-time volume data for specific BTC trading pairs on various exchanges. It currently incorporates data from prominent platforms such as Binance (BTCUSDT), Coinbase (BTCUSD), OKX (BTCUSDT), Bybit (BTCUSDT), Kraken (BTCUSD), Bitfinex (BTCUSD), Bitstamp (BTCUSD), Gemini (BTCUSD), Upbit (BTCKRW), Bithumb (BTCKRW), KuCoin (BTCUSDT), Gate.io (BTCUSDT), MEXC (BTCUSDT), Crypto.com (BTCUSD), Poloniex (BTCUSDT), and BitMart (BTCUSDT). It's important to note that while the indicator aims to represent the "Top 16" exchanges, the actual number included may vary due to data availability within TradingView and the dynamic nature of exchange rankings.
The script then calculates the total volume by summing up the volume data retrieved from each of these exchanges. This aggregated volume is visually represented as a histogram directly on your TradingView chart, displayed in white by default. By observing the height of the histogram bars, traders can quickly assess the total trading volume for Bitcoin spot markets over different time periods, corresponding to the chart's timeframe.
This indicator is valuable for traders seeking to understand the overall market depth and liquidity of Bitcoin. Increased total volume can often signal heightened market interest and potential trend strength or reversals. Conversely, low volume might suggest consolidation or reduced market participation. Traders can use this indicator to confirm trends, identify potential breakouts, and gauge the general level of activity in the Bitcoin spot market across major exchanges. Keep in mind that the list of exchanges included may need periodic updates to accurately reflect the top exchanges as rankings on CoinMarketCap evolve.
Nirmal Fair Value GapsICT Fair Value Gaps
Trade Wisely
How a Fair Value Gap Works
Formation:
A Fair Value Gap occurs when a strong price movement (usually from institutional orders) creates an imbalance between buyers and sellers.
This is typically seen in a three-candle pattern, where the middle candle has a large body, and the two surrounding candles have wicks but little overlap with the middle candle’s range.
Identification:
The FVG is marked between the high of the first candle and the low of the third candle (for bullish gaps).
For bearish gaps, it’s the low of the first candle and the high of the third candle.
Market Behavior Around FVG:
Price often retraces into the gap before resuming its original direction.
This happens because the market seeks to "fill" the imbalance where few trades occurred.
Traders use FVGs as potential entry zones for trend continuation trades.
Trading Fair Value Gaps
In an Uptrend:
Look for bullish fair value gaps as potential support zones for buy entries.
Price may dip into the gap and then continue upward.
In a Downtrend:
Look for bearish fair value gaps as potential resistance zones for sell entries.
Price may retrace into the gap and then drop further.
Confluence Factors:
FVGs work best when combined with other strategies like order blocks, liquidity zones, or key Fibonacci levels.

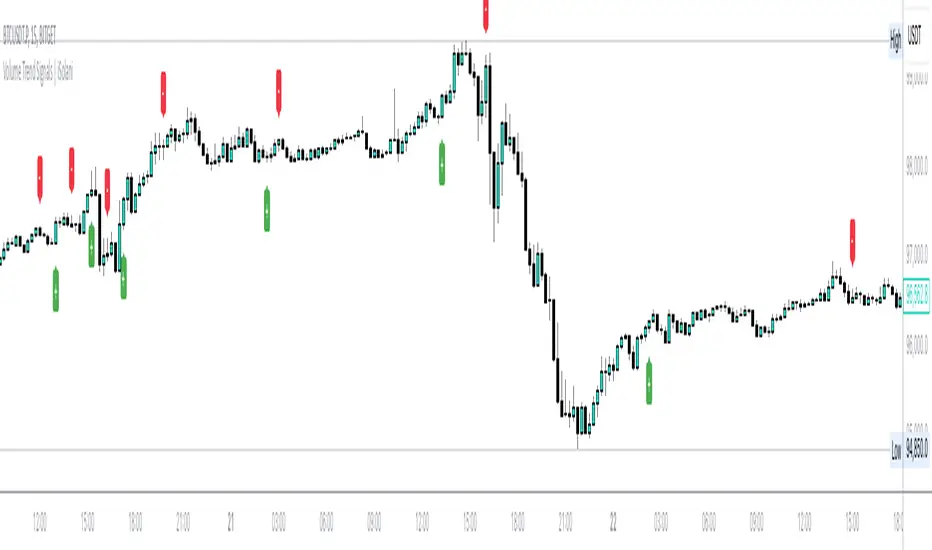
Volume Trend Signals | iSolani
Volume Trend Signals | iSolani: Syncing Price Momentum with Volume Confirmation
In the dance between price action and volume, discerning true trend commitment requires seeing how institutional players vote with their capital. The Volume Trend Signals | iSolani illuminates this interplay by generating precise crossover signals when volume-accelerated price movements gain sustained traction. Unlike conventional volume oscillators, it employs a two-layered confirmation system —blending volatility-adjusted thresholds with adaptive smoothing—to spotlight high-probability entries aligned with smart-money activity.
Core Methodology
The indicator executes a five-phase process to filter meaningful trends:
Logarithmic Price Scaling: Measures percentage-based price changes via HLC3 typical price, reducing large-value bias in volatile markets.
Volatility Dynamic Filter: Uses a 30-bar standard deviation of price changes, scaled by user sensitivity (default 2x), to set momentum thresholds.
Volume Governance: Caps raw volume at 3x its 40-bar SMA, neutralizing outlier spikes while preserving institutional footprints.
Directional Flow Accumulation: Sums volume as positive/negative based on whether price movement breaches volatility-derived boundaries.
Signal Refinement: Smooths the Volume Flow Indicator (VFI) with a 3-bar SMA, then triggers alerts via crosses over a 20-bar EMA signal line.
Breaking New Ground
This tool introduces three evolutionary improvements over traditional volume indicators:
EMA Convergence Signals: Unlike basic zero-cross systems, it requires VFI to overtake its own EMA, confirming sustained momentum shifts.
Context-Aware Volume: The 3x volume cap adapts to current market activity, preventing false signals during news-driven liquidity spikes.
Minimalist Visual Alerts: Uses and symbols below/above candles, reducing chart clutter while emphasizing pivotal moments.
Engine Under the Hood
The script’s logic flows through four computational stages:
Data Conditioning: Computes HLC3 and its log-based rate of change for normalized price analysis.
Threshold Calibration: Derives dynamic entry/exit levels from 30-period volatility multiplied by user sensitivity.
Volume Processing: Filters and signs volume based on price meeting threshold criteria.
Signal Generation: Triggers buy/sell labels when the 3-bar SMA of cumulative flow crosses the 20-bar EMA.
Standard Configuration
Optimized defaults balance responsiveness and reliability:
VFI Length: 40-bar accumulation window
Sensitivity: 2.0 (double the volatility-derived threshold)
Signal Smoothing: 20-bar EMA
Volume Cap: 3x average (hidden parameter)
Smoothing: Enabled (3-bar SMA on VFI)
By fusing adaptive volume filtering with EMA-confirmed momentum, the Volume Trend Signals | iSolani cuts through market noise to reveal institutional-grade trend inflection points. Its unique crossover logic—prioritizing confirmation over speed—makes it particularly effective in swing trading and trend-following strategies across equities, commodities, and forex markets.
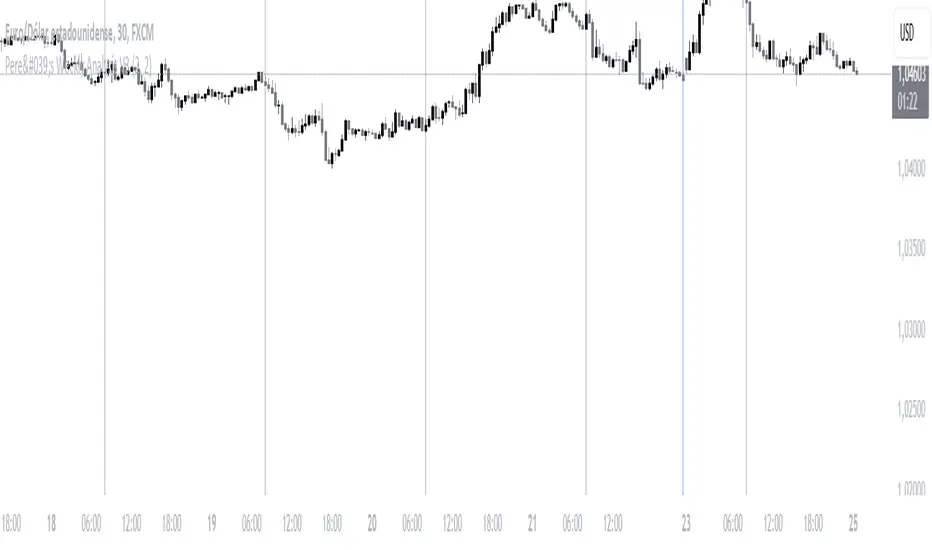
Pere's Weekly Analysis V3This indicator is very simple; it is basically composed of a series of thin vertical lines and thicker ones:
- The thin lines symbolize the opening of the London session, which marks the beginning of a new day in the forex market.
- The thick lines, due to their prominence, represent the end of a week with the closing of the Asian session.
The combination of these two lines allows for a deeper understanding of what happens each day, enabling market analysis in lower timeframes, such as a 5-minute or 10-minute chart, without losing sight of the daily opening and closing references.
This indicator can be used to identify previous days' highs and lows, mark them as potential liquidity zones, and look for price reactions to these areas during the current day. Traders can combine this indicator with their personal strategies, simplifying chart analysis.
It is essential to have a solid understanding of market behavior and always trade with optimal risk management.
ESPAÑOL:
Este indicador es muy sencillo, básicamente está compuesto por una serie de líneas verticales delgadas y otras más gruesas:
- Las delgadas simbolizan la apertura de la sesión de Londres, es decir el inicio de un día nuevo en el mercado del forex.
- Las gruesas por su saldo simbolizan el final de una semana con el cierre de la sesión asiática.
Las combinación de estas 2 líneas nos permite tener una comprensión más profunda de lo que ocurre en cada día, pudiendo analizar el mercado en temporalidades más bajas, como por ejemplo, una temporalidad de 5 minutos o de 10 minutos, Pero sin perder las referencias del inicio y final de cada día.
Este indicador se puede utilizar para identificar máximos y mínimos de los días anteriores, marcarlos como potenciales zonas de liquidez, y buscar reacciones a dichas zonas durante el día actual. Los trader puede combinar este indicar con sus estrategias personales simplificando la lectura de los gráficos.
Es importante tener una buena comprensión del comportamiento de los mercado y siempre operar con una óptima gestión del riesgo.
Delta VolDelta Volume BTC - Multi Pair
Description The Delta Volume BTC - Multi Pair indicator visualizes the balance between buying and selling volume across multiple Bitcoin exchanges. By analyzing price action within each bar, it provides insight into underlying market pressure that traditional volume indicators miss. This indicator allows traders to:
Compare volume flow across Coinbase, Binance, and Binance Perpetual markets
Identify divergences between exchanges that may signal market shifts
Detect accumulation or distribution patterns through volume imbalances
View exchanges individually or in aggregate for comprehensive analysis
Calculation Methods The indicator offers three volume delta calculation methods:
VWAP Based (default):
price_range = high - low
buy_percent = (close - low) / price_range
sell_percent = (high - close) / price_range
delta = volume * (buy_percent - sell_percent)
This method distributes volume based on where price closed within the bar's range, providing a nuanced view of buying/selling pressure.
Tick Based :
delta = volume * sign(hlc3 - previous_hlc3)
This approach assigns volume based on the direction of typical price movement between bars, capturing momentum between periods.
Simple :
delta = close > open ? volume : close < open ? -volume : 0
A straightforward method that assigns positive volume to up bars and negative volume to down bars.
When Aggregate Mode is enabled, the indicator sums the volume deltas from all selected exchanges:
aggregate_delta = coinbase_delta + binance_delta + binance_perp_delta
Features
Multi-Exchange Support : Track volume delta across Coinbase, Binance, and Binance Perpetual futures
Advanced Calculation Methods : Choose between VWAP-based, tick-based, or simple volume delta algorithms
Flexible Display Options : Visualize as histogram, columns, area, or line charts
Customizable Colors : Distinct color schemes for each exchange and direction
Smoothing Options : Apply EMA, SMA, or WMA to reduce noise
Aggregate Mode : Combine all exchanges to see total market flow
How to Use
Individual Exchange Analysis : Uncheck "Aggregate Mode" to see each exchange separately, revealing where smart money may be positioning
Divergence Detection : Watch for one exchange showing buying while others show selling
Volume Trend Confirmation : Strong price moves should be accompanied by strong delta in the same direction
Liquidity Analysis : Compare spot vs futures volume delta to identify market sentiment shifts
The Delta Volume BTC - Multi Pair indicator helps identify the "hidden" buying and selling pressure that may not be apparent from price action alone, giving you an edge in understanding market dynamics across the Bitcoin ecosystem.

Market DNA: Structure, Volume, Range, and SessionsMarket DNA: Structure, Volume, Range, and Sessions**
The Market DNA indicator combines market structure, volume analysis, trading ranges, and global trading sessions into a single, comprehensive tool for traders. It helps identify key price levels, volume patterns, consolidation phases, and active market periods, enabling informed trading decisions.
Market Structure Detects swing highs and lows using `ta.pivothigh` and `ta.pivotlow`, plotting them as red/green triangles to highlight support/resistance and trend reversals.
- Fractal Volume Zones (FVG): Highlights areas of significant buying/selling pressure by comparing current volume to an average over a lookback period; high-volume zones are marked with a semi-transparent blue background.
- Trading Range: Defines a price channel using the Average True Range (ATR) and a multiplier, creating upper/lower bands to identify consolidation, breakouts, and potential trade levels.
- Market Sessions: Highlights major global trading sessions (Asia, Europe, US) with colored backgrounds (purple, teal, yellow) to indicate liquidity and volatility shifts.
How It Works
- Swing points help analyze trends and reversals.
- FVG confirms price movements with high volume for stronger signals.
- Trading range bands assist in identifying breakout opportunities and setting stops/take-profits.
- Session highlights allow traders to adapt strategies based on regional activity.
Customization
- Adjust `swing_length` for sensitivity in detecting turning points.
- Modify `volume_lookback` to control volume averaging.
- Tune `range_multiplier` for wider/narrower trading bands.
- Enable/disable session highlighting via `session_highlight`.
Use Cases
- Identify trends and key levels using swing points and FVG.
- Spot breakout opportunities with trading range bands.
- Adapt strategies to regional trading sessions for optimal timing.
This all-in-one indicator provides a clear, customizable view of the market, empowering traders to make data-driven decisions across asset classes and timeframes.

Pre-London High-Low Breakout IndicatorOverview
The Pre-London High-Low Breakout Indicator helps traders identify breakout opportunities at the London session open. It marks the high and low one hour before London opens (5 PM - 6 PM AEST) and incorporates a 200 SMA filter to confirm trade direction. The indicator also provides real-time breakout markers for precise entries.
How the Indicator Works
1. Pre-London High & Low Identification (5 PM - 6 PM AEST)
The indicator tracks the highest and lowest price levels within this period.
These levels act as key breakout zones once London opens.
The high and low remain visible until 12 AM AEST for reference.
2. 200 SMA as a Trend Filter
A 200 SMA (yellow, thick line) is plotted to filter breakout trades.
Only long (buy) trades are valid if price is above the 200 SMA.
Only short (sell) trades are valid if price is below the 200 SMA.
3. Real-Time Breakout Confirmation
Buy Signal (Green Diamond):
Price breaks above the pre-London high.
Price is above the 200 SMA.
Sell Signal (Red Diamond):
Price breaks below the pre-London low.
Price is below the 200 SMA.
No signal appears if the breakout is against the SMA trend, reducing false trades.
How to Use the Indicator Properly
Step 1: Identify the Pre-London Range (5 PM - 6 PM AEST)
Observe price movements and note the session high & low.
Do not take trades within this period—wait for a clear breakout.
Step 2: Wait for a Breakout After 6 PM AEST
A breakout must occur beyond the session high or low.
The breakout should be clear and decisive, not hovering around the range.
Step 3: Confirm with the 200 SMA
If price is above the 200 SMA, only buy signals are valid.
If price is below the 200 SMA, only sell signals are valid.
If a breakout occurs against the SMA, ignore it.
Step 4: Enter the Trade and Manage Risk
Enter the trade after the breakout candle closes.
Set stop-loss just inside the pre-London range to minimize risk.
Take profit using a 1:2 or 1:3 risk-reward ratio, or trail the stop.
Why This Strategy Works
Pre-London Liquidity Grab: Institutional traders set positions before the London open, making this range significant.
Trend Confirmation with SMA: Reduces false breakouts by filtering trades in the direction of the trend.
Real-Time Breakout Detection: Green and red diamond markers highlight valid breakouts that meet all conditions.
Final Notes
If price breaks out but quickly reverses, it may be a false breakout—avoid impulsive trades.
The indicator works best when combined with other confluences such as volume analysis or key support/resistance levels.
Alerts can be added to notify traders when a valid breakout occurs.
This setup is ideal for traders looking for a structured, rule-based approach to trading London session breakouts with a strong trend confirmation mechanism.

VWAP [cryptalent]VWAP Indicator with Adjustable Source
Overview
This TradingView indicator calculates Daily, Weekly, and Monthly VWAP (Volume Weighted Average Price) with the flexibility to select different price sources (Open, High, Low, Close, HLC3, etc.). It also displays previous period VWAP levels, helping traders analyze past liquidity zones.
Key Features:
✅ Adjustable Source – Users can choose the price used for VWAP calculations (e.g., Close, High, Low, Open).
✅ Multi-Timeframe VWAP – Tracks Daily, Weekly, and Monthly VWAP to provide a broader market view.
✅ Historical VWAP Levels – Displays previous VWAP values for comparison and reference.
✅ Step Line Style – Ensures clear distinction between different periods and prevents overlapping.
✅ Visible in the Price Scale – The latest and historical VWAP values are displayed in the right-hand price scale for easy reference.
Customization:
You can easily modify the input settings to match your trading style.
Adjust the VWAP source price to test different perspectives (e.g., Open vs. High vs. Close).

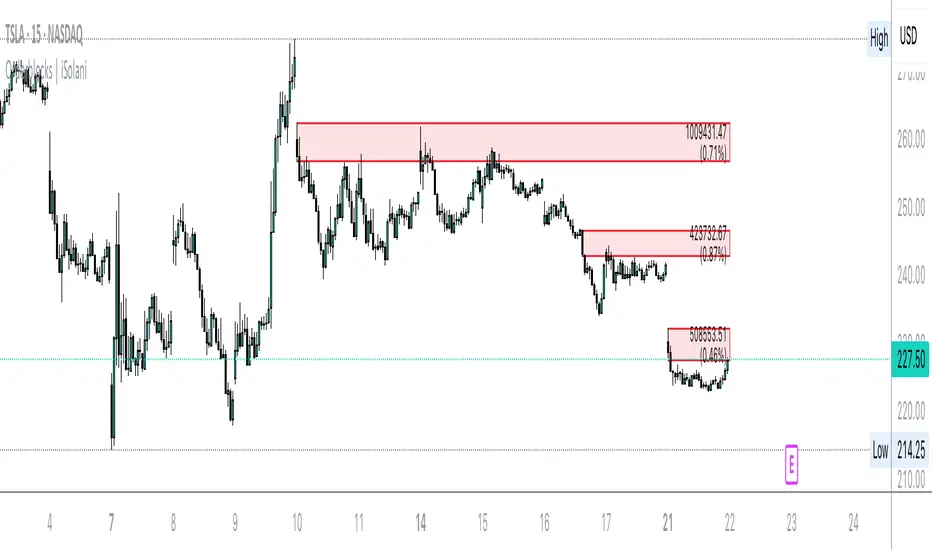
Orderblocks | iSolani
Revealing Institutional Footprints: The iSolani Volume-Powered Order Block System
Where Smart Money Leaves Its Mark – Automated Zone Detection for Discretionary Traders
Core Methodology
Pressure-Weighted Volume Analysis
Calculates directional commitment using candle position:
Buying Pressure = Total Volume × (Closing Price – Low) / (High – Low)
Selling Pressure = Total Volume × (High – Closing Price) / (High – Low)
Normalizes values against 31-period EMAs to filter retail noise
Adaptive Block Triggering
Identifies significant zones when:
Absolute Buy/Sell Difference > 4× SMA of Historical Differences (default)
Price closes bullishly (green block) or bearishly (red block)
Self-Maintaining Visualization
Blocks auto-extend rightward until price breaches critical level
Invalidated zones removed in real-time via array management
Technical Innovation
Dynamic Threshold Adjustment
Multiplier parameter (default 4) automatically scales with market volatility
Institutional-Grade Metrics
Blocks display:
Volume disparity in absolute terms
Percentage deviation from 33-period average
Directional bias through color-coding
Efficient Memory Handling
O(n) complexity cleanup routine prevents chart lag
System Workflow
Calculates real-time buy/sell pressure ratios
Compares to historical average (31-period default)
Generates semi-transparent zones (85% opacity) at spike locations
Monitors price interaction with block boundaries
Automatically retracts invalid zones
Standard Configuration
Sensitivity : 4× multiplier (ideal for 15m-4h charts)
Visuals : Red/green blocks with white text labels
Duration : 50-bar default extension
Volume Baseline : 33-period EMA filter
Boundary Check : Close beyond block high/low triggers deletion
This system transforms raw market data into a institutional roadmap – not by predicting turns, but by revealing where concentrated volume makes turns statistically probable. The color-coded blocks serve as persistent yet adaptive markers of where professional liquidity resides.
Weekend RangeWeekend Range Indicator – Customizable High/Low Zones
🔹 Overview
The Weekend Range Indicator marks the last 20 weekends on your chart, highlighting their highs and lows with fully customizable colors, transparency, and time settings. This tool helps traders identify key support and resistance levels from weekend price action.
🛠️ Features
✅ Custom Weekend Start & End – Choose the weekend days and time (UTC)
✅ Automatically Tracks the Last 20 Weekends (configurable up to 50)
✅ Custom Box Colors & Transparency – Adjust the fill and border colors easily
✅ Works on All Timeframes – Best viewed on 1H, 4H, or higher
✅ Efficient & Optimized Code – No lag, smooth performance
🎯 How to Use
1️⃣ Add the indicator to your chart.
2️⃣ Adjust the weekend start & end time in the settings.
3️⃣ Customize the box colors and transparency to match your style.
4️⃣ Watch how price reacts around the weekend high/low zones for trade opportunities.
💡 Trading Strategies
🔹 Breakout Trading – Look for price breaking above or below the weekend range.
🔹 Reversal Zones – Watch for rejections at weekend highs/lows.
🔹 Liquidity & Stop Hunts – Large players often target these levels.
📈 Recommended Markets
✔ Works best on Forex, Crypto, Indices, and Commodities
✔ Ideal for swing traders and intraday traders
🚀 Enjoy using the indicator! Let me know if you’d like any new features added! 🎯🔥

Crystal Order BlockThe Crystal Order Block Indicator is a powerful tool designed to help traders identify key institutional order blocks with high precision. This indicator is ideal for traders following Smart Money Concepts (SMC) and Institutional Trading Strategies, providing clear insights into potential high-probability trade setups.
🔹 Key Features:
✔ Automatic Order Block Detection: Identifies valid bullish & bearish order blocks.
✔ Unmitigated Order Blocks Highlighted: Focuses on fresh order blocks for improved trade opportunities.
✔ Trend-Focused Trading: Works best when combined with market structure analysis.
✔ Multi-Timeframe Support: Suitable for scalping, swing trading, and intraday trading.
✔ Risk Management Enhancement: Helps traders refine entries and exits based on institutional price movements.
📈 How to Use the Crystal Order Block Indicator:
🔹 Identifying Order Blocks:
➡ The indicator automatically detects order blocks formed by institutional trading activity.
➡ Unmitigated order blocks are highlighted, indicating areas where price may react.
🔹 High-Probability Trade Setups:
➡ Buy Setup: Look for a bullish order block in an uptrend, confirming strength.
➡ Sell Setup: Identify a bearish order block in a downtrend for potential short trades.
🔹 Order Block Mitigation:
➡ The updated version filters out mitigated order blocks, allowing traders to focus on fresh trading opportunities.
📊 Best Practices & Timeframes:
🔸 Works on all timeframes, but higher accuracy is observed on M30 and above.
🔸 Best suited for Smart Money Trading, Institutional Trading, and Price Action Strategies.
🔸 Should be used with liquidity concepts and market structure analysis for enhanced precision.
⚠ Important Note:
This indicator is a technical tool designed to assist traders in market analysis. It does not guarantee success and should be used alongside proper risk management and trading discipline.

FVG Reversal Sentinel🔵 FVG Reversal Sentinel – Multi-Timeframe Fair Value Gap Indicator
The FVG Reversal Sentinel is a powerful TradingView indicator designed to help traders identify and track Fair Value Gaps (FVGs) across multiple timeframes, all within a single chart.
This tool allows you to select up to five separate timeframes, ensuring you never miss key market shifts, whether you are scalping, day trading, or swing trading. You can use this indicator in any asset (Cryptos, Futures, Indices, Forex Pairs, etc.).
🔵 - Key Features -
Multi-Timeframe FVG Tracking – Select and display up to five different timeframes on one chart, providing a comprehensive view of market structure.
Customizable Colors – Adjust bullish and bearish FVG colors to match your chart theme for a seamless trading experience.
Enhanced Market Context – Quickly identify key liquidity zones and refine your entries and exits with precision.
Hide the lower timeframes FVGs to get a clear view in a custom timeframe.
Show or hide mitigated FVGs to declutter the chart.
FVGs boxes are going to be displayed only when the candle bar closes
FVGs are going to be mitigated only when the body of the candle closes above or below the FVG area.
No repainting
Whether you're looking to fine-tune your entries or gain a broader market perspective, the FVG Reversal Sentinel indicator ensures you have the tools to stay ahead of price action and capitalize on market inefficiencies.
🔵 - Customization-
You can change the indicator settings as you see fit to achieve the best results for your use case.
TIMEFRAMES
This indicator provides the ability to select up to 5 timeframes. These timeframes are based on the trader's timeframes including any custom timeframes.
Select the desired timeframe from the options list.
Add the label text you would like to show for the selected timeframe.
Check or uncheck the box to display or hide the timeframe from your chart.
FVG SETTINGS
Length of boxes: allows you to select the length of the box that is going to be displayed for the FVGs.
Delete boxes after fill?: allows you to show or hide mitigated FVGs on your chart.
Hide FVGs lower than enabled timeframes?: allows you to show or hide lower timeframe FVGs on your chart. Example - You are in a 15 minutes timeframe chart, if you choose to hide lower timeframe FVGs you will not be able to see 5 minutes FVG defined in your Timeframes Settings, only 15 minutes or higher timeframe FVGs will be displayed on your chart.
BOX VISUALS
Bullish FVG box color: the color and opacity of the box for the bullish FVGs.
Bearish FVG box color: the color and opacity of the box for the bearish FVGs.
LABELS VISUALS
Bullish FVG labels color: the color for bullish labels.
Bearish FVG labels color: the color for bearish labels.
Labels size: the size of the text displayed in the labels.
Labels position: the position of the label inside the FVGs boxes (right, left or center).
BORDER VISUALS
Border width: the width of the border (the thickness).
Bullish FVG border color: the color and the opacity of the bullish box border.
Bearish FVG border color: the color and the opacity of the bearish box border.
🔵 - How to use the indicator -
Just add the indicator in your chart and click in the settings option to customize it.
Make sure you select the desired timeframes and set the colors and opacity for the FVGs boxes.
This indicator can be used in many trading strategies, such as:
SILVER BULLET
iFVG
iFVG RETEST
These strategies are based on the use of FVGs, this tool can help you analyze the market and make the right decision.
🔵 - How was the indicator designed? -
I have spent a lot of time testing other open source indicators from the community. All of these indicators do a great job, but they have a problem, they not only mitigate FVGs when a candle closes above or below the FVG, they also mitigate FVGs when the candle closes exactly to the tick (not above or below the FVG). This is a problem for many strategies that rely on FVGs mitigation.
What makes this indicator different is that it focuses on just mitigating imbalances at the right time for these strategies.
I have taken ideas and some pieces of code from many community indicator developers, such as:
@twingall
@tflab
@marktools
@nacho-fx
@pmk07
... and many other people, to whom I thank for their valuable work and have allowed me to create this tool by making modifications to their source code.
🔵 - Disclaimer -
This tool is intended solely for informational and educational purposes and should not be regarded as financial, investment, or trading advice. It's not designed to predict market movements or offer specific recommendations. Users should be aware that past performance is not indicative of future results and should not rely on any indicator for financial decisions.

WalidTrader2025This is a Pine Script (version 5) code for a custom technical analysis indicator called "Market Structure Fibonacci Indicator" designed for use in TradingView. The indicator appears to combine market structure analysis with Fibonacci levels to help traders identify key price levels and market conditions.
Key features of the indicator include:
Fibonacci-based "breaker zones" that help identify potential support and resistance areas
A dynamic equilibrium price level that determines bullish/bearish market conditions
Buy-side and sell-side liquidity levels tracking
A status table displaying the current market trend (Bullish/Bearish) and market condition (Premium/Discount/Neutral)
Customizable visual elements including colors, line widths, and transparency levels
The indicator overlays on the price chart and uses the period's open, high, and low prices to calculate various Fibonacci projections at the 0.375 and 0.625 levels. It then creates zones ("breaker zones") that could indicate potential areas where price might react.

ICT Balanced Price Range - Double FVG with VolumeThis is an FVG indicator combined with volume to identify moments when a sudden volume spike creates a price gap.
Additionally, I've added the ICT Balanced Price Range, which occurs when two opposing FVGs form a connected gap. This gap has a high probability of reversal and is one of the key signs of liquidity sweeps.
Unlike other FVG indicators that filter FVGs based on ATR, average price, or range, I believe such methods lead to overfitting and may not work across multiple pairs with a single setting. Instead, I only filter FVGs when there are consecutive overlapping FVGs.
The indicator includes full functionality:
Candle color customization
FVG line color customization
FVG fill color customization
BPR color customization
Adjustable average volume and volume threshold
Highlighting candles with abnormal volume
Enjoy and make sure to backtest thoroughly before using!

Buy on VolumeThis script has several weaknesses:
1. **Overly Simplistic Logic** – The buy signal is based on just two conditions (DEMA crossing above a Lorentzian Line and a volume spike), which may not be robust enough for real trading conditions.
2. **Lack of Sell Signals** – The script only focuses on buy signals without any exit strategy, making it incomplete for practical trading.
3. **Volume Confirmation May Be Unreliable** – The threshold for volume confirmation (50% above average) is arbitrary and may produce frequent false positives or fail in low-liquidity conditions.
4. **No Risk Management** – There is no stop-loss, take-profit, or risk-adjustment mechanism, making it unsuitable for serious trading.
5. **Potential for Late Entries** – The reliance on moving averages (DEMA) can introduce lag, causing buy signals to appear late after a price move has already occurred.
6. **Limited Adaptability** – The fixed parameter settings (e.g., DEMA period of 6, Lorentzian length of 21) may not work across different market conditions or assets.
7. **No Consideration for Market Trends** – The script does not account for broader market trends, which could lead to poor entries in bearish conditions.
8. **Visual Clutter** – The plotted signals and indicators might create unnecessary chart noise, making it difficult to analyze price action effectively.
9. **Alert Spam Potential** – Without additional filtering conditions, the script may trigger frequent buy alerts, leading to signal fatigue.

Peak Reaction Zones [BigBeluga]Peak Reaction Zones is an advanced Smart Money Concept (SMC) indicator that identifies the most recent swing high and swing low zones, helping traders determine premium and discount areas for optimal trade positioning.
🔵 Key Features:
Swing High & Low Zones:
Automatically detects the latest swing high and swing low levels.
Helps traders identify key reaction points where price is likely to respond.
Premium & Discount Concept:
The high zone represents a premium area, where price is overextended and may reverse.
The low zone represents a discount area, where price is undervalued and may bounce.
The midline dynamically marks the equilibrium of the range.
Adjustable Zone Width:
Users can fine-tune the width of the zones to match their trading style.
Wider zones capture broader reaction ranges, while narrower zones focus on precise levels.
Zone Retest Signals:
Blue markers appear when price retests the lower reaction zone, signaling potential support.
Orange markers appear when price retests the upper reaction zone, indicating possible resistance.
Price Labels for Key Levels:
Displays the price value of the swing high, swing low, and midline for quick reference.
Helps traders recognize major reaction points at a glance.
🔵 Usage:
Smart Money Trading: Utilize the premium and discount concept to align trades with institutional order flow.
Zone Reactions: Watch for price tests of reaction zones and use the retest signals to confirm potential reversals.
Midline Confirmation: If price holds above or below the midline, it can indicate directional bias.
Scalping & Swing Trading: Short-term traders can look for zone rejections, while swing traders can use the levels for trend continuation setups.
Peak Reaction Zones is a must-have tool for traders looking to trade with Smart Money Concepts, allowing for precise entries and exits based on key liquidity areas and market structure.

Midnight Range Standard DeviationsCredit to Lex Fx for the basic framework of this script
This indicator is designed to assist traders in identifying potential trading opportunities based on the Intraday Concurrency Technique (ICT) concepts, specifically the midnight range deviations and their relationship to Fibonacci levels. It builds upon the work of Lex-FX, whom we gratefully acknowledge for the original concept and inspiration for this indicator.
Core Concept: ICT Midnight Range
The core of this indicator revolves around the concept of the midnight range. According to ICT, the high and low formed in a specific time window (typically the first 30 minutes after midnight, New York Time) can serve as a key reference point for intraday price action. The indicator identifies this range and projects potential support and resistance levels based on deviations from this range, combined with Fibonacci ratios.
How ICT Uses Midnight Range Deviations
ICT methodology often involves looking for price to move away from the initial midnight range, then return to it, or deviate beyond it, as key areas for potential entries.
Range Identification: The indicator automatically identifies the high and low of the midnight range (00:00 - 00:30 NY Time).
Deviation Levels: The indicator calculates and displays deviation levels based on multiples of the initial midnight range. These levels are often used to identify potential areas of support and resistance, as well as potential targets for price movement. These levels can be set in the additional fib levels section, which can be configured in increments of .5 deviations all the way up to 12 deviations.
Fibonacci Confluence: ICT often emphasizes the confluence of multiple factors. This indicator adds Fibonacci levels to the midnight range deviations. This allows traders to identify areas where Fibonacci retracements or extensions align with the deviation levels, potentially creating stronger areas of support or resistance.
Looking for Sweeps: ICT often uses these levels to look for times that the high and low are swept as potential areas of liquidity, indicating the start of potential continuations.
Time-Based Analysis: The time at which price interacts with these levels can also be significant in ICT. The indicator provides options to extend the range lines to specific times (e.g., 3 hours, 6 hours, 10 hours, 12 hours, or a custom defined time) after midnight, allowing traders to focus on specific periods of the trading day.
Indicator Settings Explained:
Time Zone (TZ): Defines the time zone used for calculating the midnight range. The default is "America/New_York".
Range High Color, Range Low Color, Range Mid Color: Customize the colors of the high, low, and mid-range lines.
Range Fill Color: Sets the fill color for the area between the range high and low.
Line Style: Choose the style of the range lines (solid, dashed, dotted).
Range Line Thickness: Adjust the thickness of the range lines for better visibility.
Show Fibonacci Levels: Enable or disable the display of Fibonacci deviation levels.
Fib Up Color, Fib Down Color: Customize the colors of the Fibonacci levels above (up) and below (down) the midnight range.
Show Trendline: Enables a trendline that plots the close price, colored according to whether the price is above the high, below the low, or within the midnight range.
Show Range Lines, Show Range Labels: Toggles the visibility of the range lines and their associated labels.
Label Size: Adjust the size of the labels for better readability.
Hide Prices: Option to display only the deviation values on labels, hiding price values.
Place Fibonacci Labels on Left Side: Option to switch label position from right side to left side.
Extend Range To (Hours from Midnight): This section gives you a wide variety of options on how far you want to extend the range to, you can do 3,6,10,12, and 23 hours. Alternatively, you can select the "Use Custom Length" and set a specific time in hours.
Additional Fib Levels: This section allows the trader to set additional deviation points in increments of .5 deviations from .5 all the way up to 12 deviations
TradingView Community Guidelines Compliance:
This indicator description adheres to the TradingView community guidelines by:
Being educational: It explains the ICT methodology and how the indicator can be used in trading.
Being transparent: It clearly describes all the indicator's settings and their purpose.
Providing credit: It acknowledges Lex-FX as the original author of the concept.
Avoiding misleading claims: It does not guarantee profits or imply that the indicator is a "holy grail."
Disclaimer: Usage of this indicator and the information provided is at your own risk. The author is not responsible for any losses incurred as a result of using this indicator.
Important Considerations:
This indicator is intended for educational purposes and to assist in applying the ICT methodology.
It should not be used as a standalone trading system.
Always combine this indicator with other forms of technical analysis and risk management techniques.
Backtest thoroughly on your chosen market and timeframe before using in live trading.
Trading involves risk. Only trade with capital you can afford to lose.

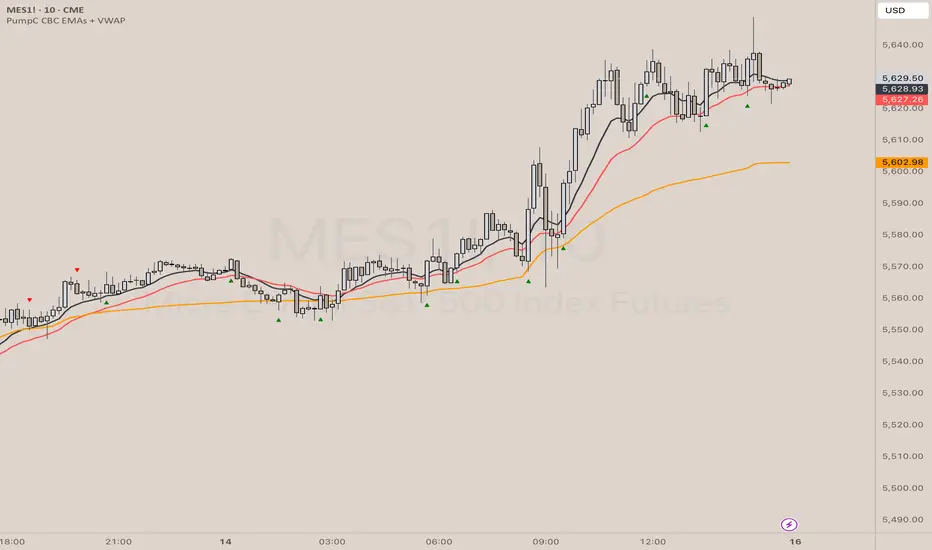
PumpC CBC EMAs + VWAPPumpC CBC EMAs + VWAP Indicator for Tradingview
Introduction
This is an indicator for the Candle By Candle (CBC) Flip strategy , based on the CBC Flip concept taught by MapleStax and inspired by the original CBC Flip indicator by AsiaRoo . The CBC Flip strategy is a simple yet effective approach to gauge if bulls or bears are in control for any given candle.
The logic behind the CBC Flip is as follows:
Bullish Flip : If the most recent candle’s close is above the previous candle’s high, bulls have taken control.
Bearish Flip : If the most recent candle’s close is below the previous candle’s low, bears are now in control.
No Flip : If neither condition is met, the previously dominant side (bulls or bears) remains in control until one of these conditions is satisfied, flipping the market sentiment—hence the name CBC Flip .
The PumpC CBC EMAs + VWAP Indicator enhances this simple strategy by adding trend confirmation filters using EMAs and VWAP , along with time-restricted signal generation and fully customizable alerts.
What Does This Indicator Do?
The PumpC CBC EMAs + VWAP Indicator helps traders identify CBC Flips to spot potential trend continuations or reversals. It combines candlestick logic , trend filters , and time-based restrictions to provide high-probability trade signals.
CBC Flip Detection
Bullish Flip : Current close is above the previous candle’s high.
Bearish Flip : Current close is below the previous candle’s low.
Strict Flips : Require a liquidity sweep for higher accuracy.
All Flips : Looser conditions that generate more frequent signals.
EMA and VWAP Trend Confirmation (Optional)
This filter ensures that long signals only trigger when the Slow EMA is above the VWAP , confirming an upward trend. For short signals, the Slow EMA must be below the VWAP.
Time-Based Filtering
The indicator allows you to set a specific trading window (e.g., 9:00 AM to 3:00 PM), helping you avoid low-volume or high-risk periods.
Visual Labels and Alerts
Labels : Arrows (▲ for long and ▼ for short) mark CBC Flip points on the chart.
Alerts : Fully customizable notifications for each signal type, based on your chosen filters.
Key Features
CBC Flip Detection : Identify potential reversals and trend continuations.
Strict vs. All Flips : Choose between higher-accuracy strict flips or more frequent all flips.
EMA-to-VWAP Filter : Optional trend confirmation filter to reduce false signals.
Customizable EMAs and VWAP : Configure lengths and colors for visual clarity.
Time-Restricted Signals : Focus on your preferred trading session.
Custom Alerts : Notifications for long and short signals based on filter settings.
Credits and Inspiration
The CBC Flip strategy was created by MapleStax .
This indicator is inspired by the original CBC Flip indicator by AsiaRoo .
Additional enhancements include EMA-to-VWAP filtering , custom alerts , and time-restricted signal generation for a more comprehensive trading experience.
Risks and Disclaimer
This indicator is for educational purposes only and does not constitute financial advice.
Trading involves significant risk, and past performance does not guarantee future results. Always test this indicator in a simulated environment before live trading.
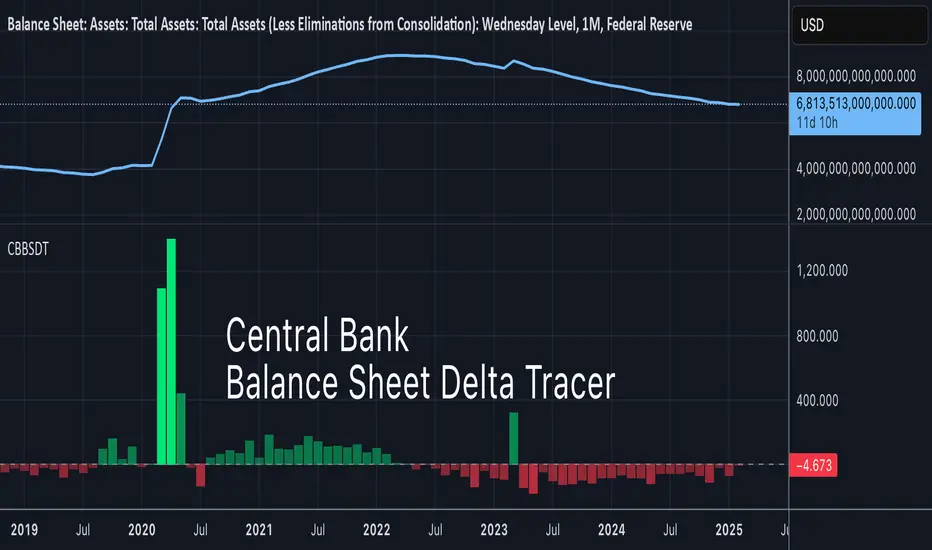
Central Bank BS Delta TracerCentral Bank BS Delta Tracer is a new way of looking at liquidity on TradingView.
CBBSDT (for short) shows bars for popular central bank balance sheets. The default is the US, but other countries can be viewed or compared as well.
You can combine multiple central bank balances, and all are calculated in USD using currency pairs so that the units match up. Combining can also show differentials, such as if the ECB did more QT than the US in a given time frame.
Warning: Time frames lower than a month may be inaccurate. Many central banks do not report their BS on a frequent basis, so do know ahead of time that data is usually outdated by a variable amount depending on the data source. Check with the particular sources of central bank BS before making assumptions about deltas using this indicator.
Debt is the dark energy of the economy. Therefore we must know how much of it is pumping or draining.
Trading ChecklistTrading Checklist Indicator - Your Trading Plan Companion
A clean and efficient visual checklist to maintain trading discipline and consistency. This indicator helps traders follow their trading plan systematically by providing an easy-to-use checklist of key confirmation points.
Features:
- Visual checklist with clear green/red status indicators
- Clean, non-intrusive interface
- Real-time status updates
- Easy toggle controls for each item
Key Checkpoints:
1. HTF Structure Analysis
2. Order Flow Confirmation
3. SD/OB/FVG (HTF POI) Identification
4. Liquidity Grab Verification
5. Reversal Alignment Check
Final Confirmations:
- Trade Validity Check
- POI & Stop Loss Safety
- Set and Forget Status
How to Use:
1. Add the indicator to your chart
2. Use the Settings panel to toggle each condition
3. Green dots indicate confirmed conditions
4. Red dots show pending confirmations
5. Verify all conditions before executing trades
Note: This indicator helps maintain trading discipline but should be used alongside proper technical and fundamental analysis.
Tags: #TradingChecklist #RiskManagement #TradingPlan #Trading #Technical #Strategy #Discipline
