MultiType Shifting Predictive Moving Averages (MA) CrossoverJust 2 Moving Averages with adjustable settings and shifting capability, plus signals and predicting continuations.
At the time of publish these different types of MAs are supported:
- SMA (Simple)
- EMA (Exponential)
- DEMA (Double Exponential)
- TEMA (Triple Exponential)
- RMA (Adjusted Exponential)
- WMA (Weighted)
- VWMA (Volume Weighted)
- SWMA (Symmetrically Weighted)
- HMA (Hull)
I'm looking forward to any idea about filtering the signals. Thanks.
在腳本中搜尋"ma cross"

SW System - EMAs - Pivots v2//=========================================================
// Indicator Name: SW System - Traditional Pivots and MA cross alerts - Plus Psychological Sup/Res
// Type: Main panel
// Version: 2
// Description: MA cross alerts - Plus Psychological Sup/Res
// Traditional Pivots in any time frame
// Author: Sergio Waldoke (Argentina)
// First Release: June 23rd, 2019
// Last Release: June 27 th, 2020
//
// This source code is subject to the terms of the Mozilla Public License 2.0 at mozilla.org
// © galileogalilei1 (Sergio Waldoke)
//==========================================================
Set of tendence and Support/Resistance with Pivots and psychological S/R in main prices. Four moving averages are provide which may be chosen between EMA or simple Moving Average.
Some alerts in crosses are provide.
Enjoy!

TradeChartist Tantalizer Pro™TradeChartist Tantalizer Pro is an extensive set of trading Indicators, Signal generators and Utilities all packed into 1 script. The script's visually appealing design and its functionality offers a pleasing experience for the users, thereby complementing their analysis and helps understand asset's price action better.
What does ™TradeChartist Tantalizer Pro do?
1. MA Tantalizer plots Moving Averages Tantalizer (Fishnet or Tantalized) based on user selection from a dropdown of 10 MAs (SMA, EMA, Zero-Lag EMA, SMMA, WMA, DEMA, TEMA, VIDYA (Variable Index DYnamic Average), T3 MA (developed by Tim Tillson featured in his article "Better Moving Averages" in 1998), Modified T3 MA). If length input is 10, Tantalizer plots 20 MA plots ranging from 10 MA to 200 MA. The Tantalized MAs help the traders to visually spot price trends and along with other indicators within the script, helps make an informed trade decision. 20 MA plots can be individually plotted or hidden from the indicator settings.
2. Plots two MAs based on user input length and timeframe which helps detect MA crosses as shown below.
3. Generates Intensity framework based Signals with recommended Stop Loss (trails with Equilibrium Line) along with Intensity Bands plot. (disables MA Tantalizer)
4. Plots Intensity candles to help spot trend and trend changes.
5. Generates TradeChartist's Rubicon framework based signals with recommended Stop Loss (trails and reverses trade when closes below or above, based on trade direction) along with Rubicon Environment plot.
6. Offers RSI color candles, Automatic Levels Generator in the toolkit to help traders visually spot RSI changes and Support/Resistance levels on chart. RSI Color Candles is a very helpful tool especially in spotting price trends on Heikin Ashi charts.
The sheer number of interesting things that can be done with this script from plotting visually engaging MA Tantalizer, detecting MA crosses not just on chart Timeframe, but also crosses between MAs of different timeframes, switching between Rubicon and Intensity environments, switching between RSI and Intensity color candles to plotting Support/Resistance levels using Automatic Levels Generator, makes this script quite versatile and a real Tantalizer.
This is not a free to use indicator. Get in touch with me (PM me directly if you would like trial access to the indicator before deciding to take lifetime access to this script)
Premium Scripts - Trial access and Information
Trial access offered on all Premium scripts.
PM me directly to request trial access to the scripts or for more information.

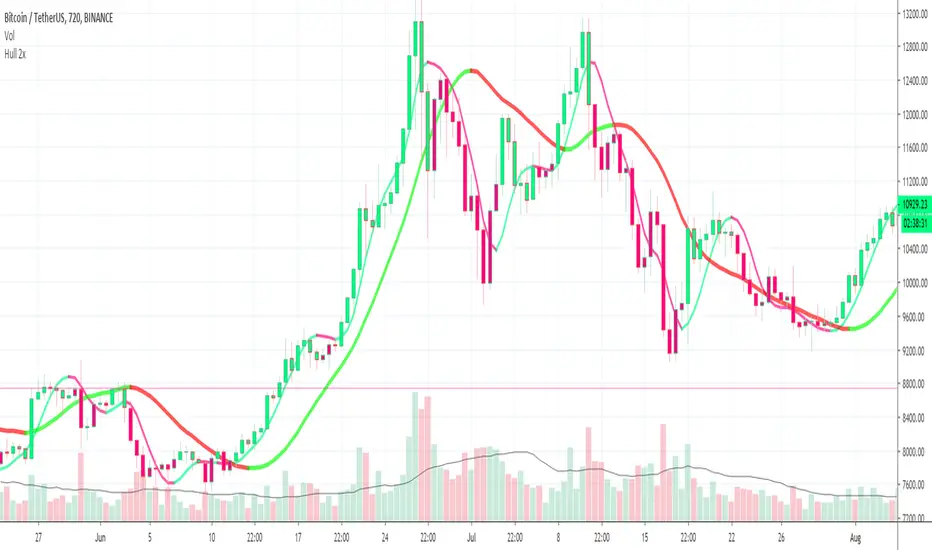
Hull 2xPlots 2 Hull MA's, 1 Fast and 1 Slow
Can Paint Bars according to Hull MA Cross
Buy / Sell Alerts for MA Crossing
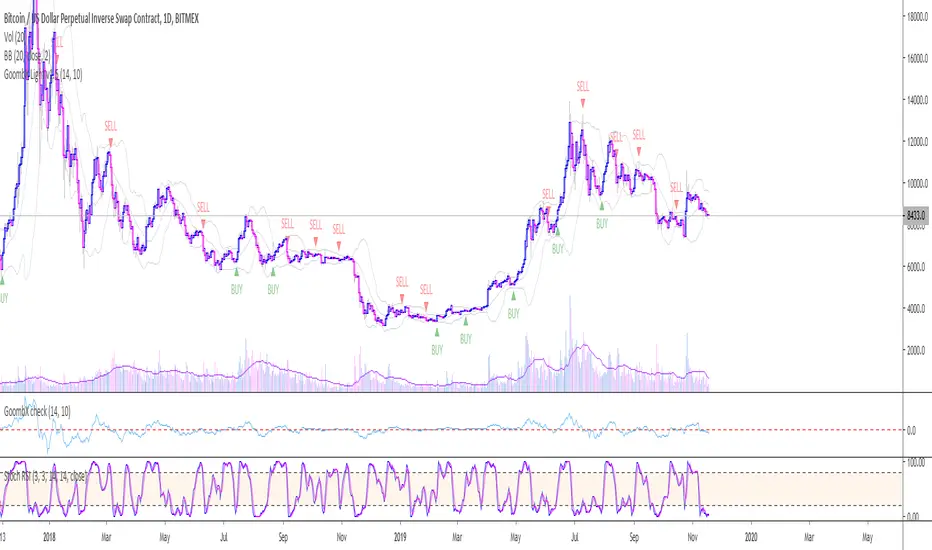
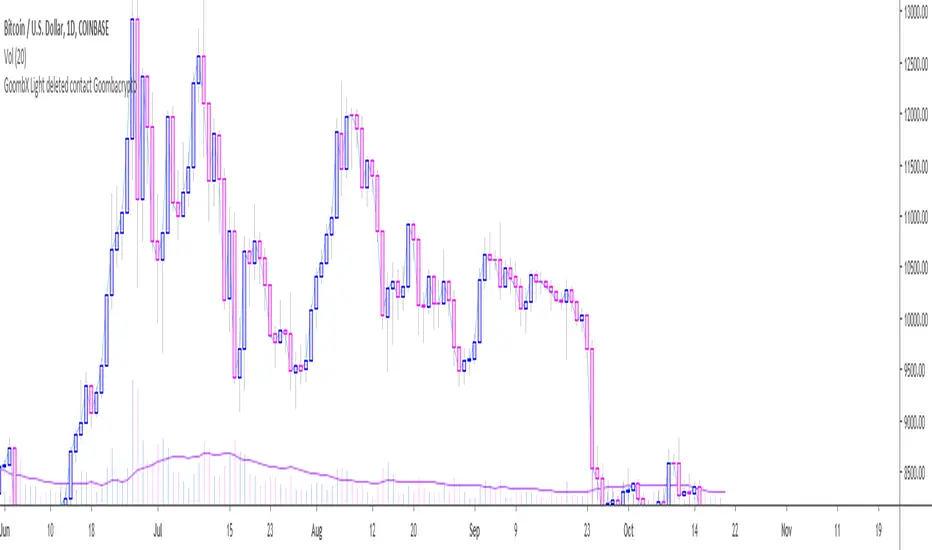
GoombX Light - Get in the trendThis is an MA and stoch RSI based indicator which looks for particular crosses to identify strong trends.
It produces clear signals for:
- BUY when it detects a significant MA cross and the right stoch RSI conditions OR when the SELL signal hits a Stop Loss (adjustable in settings)
- SELL when it detects a significant MA cross and the right stoch RSI conditions OR when the BUY signal hits a Stop Loss (adjustable in settings)
In testing it it performed best on daily chart with a 14 days Lookback window.
NOTE that a signal is only definitive once the trigger candle has closed.
I offer a full featured version which prints STOPS and trade CLOSE. Contact me on Twitter for details on how to gain access.
To setup an alert with GoombX Light, follow these steps:
- Set up GoombX Light on your chart with the desired parameters and Time Frame
- Click on alerts in the right side of the screen and then Add (+)
- Under Conditions, choose the alert you are looking for (BUY or SELL)
- Under Options, choose "Once per bar close"
- Create
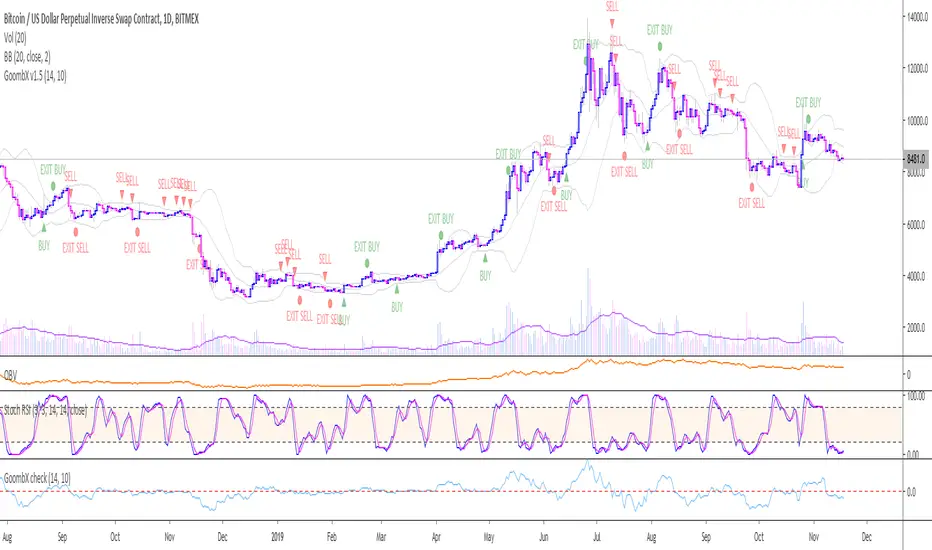
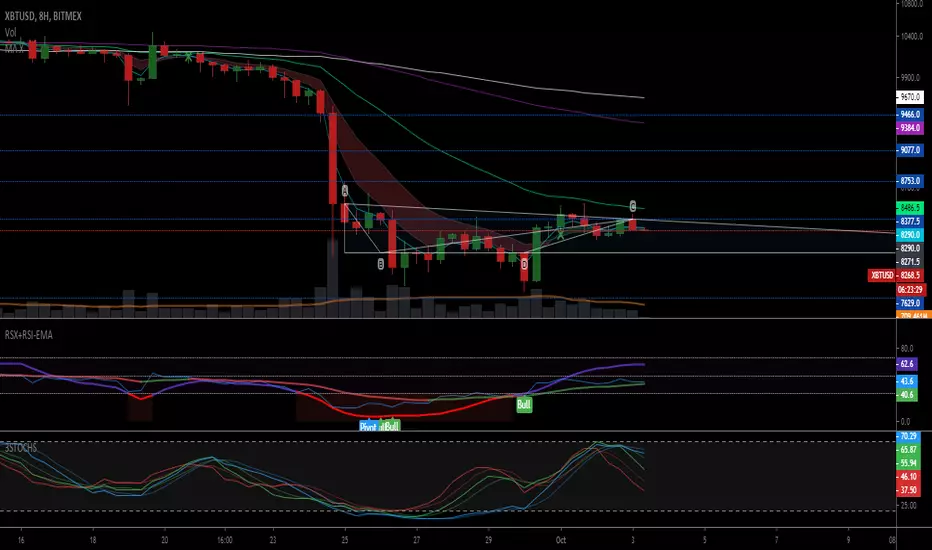
GoombX v1.1 - A trend catcherThis is an MA and stoch RSI based indicator which looks for particular crosses to identify strong trends.
It produces clear signals for:
- LONG ENTRY when it detects a significant MA cross and the right stoch RSI conditions
- LONG EXIT when certain stoch RSI conditions are met
- LONG STOP when price moves x% below entry (default 10%)
- SHORT ENTRY when it detects a significant MA cross and the right stoch RSI conditions
- SHORT EXIT when certain stoch RSI conditions are met
- SHORT STOP when price moves x% above entry (default 10%)
In testing it it performed best on daily chart with a 14 days Lookback window and 10% stop loss
NOTE that a signal is only definitive once the trigger candle has closed
To setup an alert with GoombX, follow these steps:
- Set up GoombX on your chart with the desired parameters and Time Frame
- Click on alerts in the right side of the screen and then Add (+)
- Under Conditions, choose the alert you are looking for (LONG ENTRY, LONG STOP,....)
- Under Options, choose "Once per bar close"
- Create
GoombX Light v1.1 - Get in the trendThis is an MA and stoch RSI based indicator which looks for particular crosses to identify strong trends.
It produces clear signals for:
- LONG ENTRY when it detects a significant MA cross and the right stoch RSI conditions
- SHORT ENTRY when it detects a significant MA cross and the right stoch RSI conditions
In testing it it performed best on daily chart with a 14 days Lookback window.
NOTE that a signal is only definitive once the trigger candle has closed.
I offer a full featured version which prints STOPS and trade CLOSE. Contact me on Twitter for details on how to gain access.
To setup an alert with GoombX Light, follow these steps:
- Set up GoombX on your chart with the desired parameters and Time Frame
- Click on alerts in the right side of the screen and then Add (+)
- Under Conditions, choose the alert you are looking for (LONG ENTRY or SHORT ENTRY)
- Under Options, choose "Once per bar close"
- Create
Fast-Slow MA Cross on custom timeframe (with alerts)A simple script for tracking your moving average crossing with an option for a fixed time frame and a 3 additional MAs for reference.
TN MA CrossPotential entry when the MA 5 crosses the MA 13 on an uptrend. This indicator is not meant for a you to buy and sell. It is a way to see if your fav coins are heading in an uptrend.

TN MA Cross Potential entry when the MA 5 crosses the MA 13 on an uptrend. This indicator is not meant for a you to buy and sell. It is a way to see if your fav coins are heading in an uptrend.

TN MA Cross Potential entry when the MA 5 crosses the MA 13 on an uptrend. This indicator is not meant for a you to buy and sell. It is a way to see if your fav coins are heading in an uptrend.

TN MA Cross Potential entry when the MA 5 crosses the MA 13 on an uptrend. This indicator is not meant for a you to buy and sell. It is a way to see if your fav coins are heading in an uptrend.

Bitazu MA 5,10Displays 5,10 MAs on a single indicator.
Useful for Crypto trading and reduced the number of indicators needed to view multiple EMAs
When shorter MA crosses over the longer it's a good sign of Bullish/Bearish reversal.
This sentiment is more true at longer timeframes, such as daily candles, as the trend has more momentum.

Bitazu MA 10,20Displays 10, 20 MAs on a single indicator.
Useful for Crypto trading and reduced the number of indicators needed to view multiple MAs
When shorter MA crosses over the longer it's a good sign of Bullish/Bearish reversal.
This sentiment is more true at longer timeframes, such as daily candles, as the trend has more momentum.

dual ma cross colored barsSimple Indicator that colors the bars based on whether the fast ma is over or under the slow ma to visually identify trends and when do the crossover occur.

dual moving average crossover Erdal//@version=5
indicator("MA Cross Simple", overlay=true)
// Inputs
fastLen = input.int(10)
slowLen = input.int(100)
// Moving averages
fastMA = ta.sma(close, fastLen)
slowMA = ta.sma(close, slowLen)
// Plot
plot(fastMA, color=color.green)
plot(slowMA, color=color.red)
// Cross signals
bull = ta.crossover(fastMA, slowMA)
bear = ta.crossunder(fastMA, slowMA)
// Labels
if bull
label.new(bar_index, low, "BUY", style=label.style_label_up, color=color.green)
if bear
label.new(bar_index, high, "SELL", style=label.style_label_down, color=color.red)


Moving Average ProjectionDisplays 2-5 moving averages (solid lines) and projects their future trajectory (dashed lines) based on current trend momentum. This helps you anticipate where key MAs are heading and identify potential future support/resistance levels.
Important: Projections show where MAs would move IF the current trend continues—they're not predictions. Market conditions change, so use projections as planning tools, not trading signals.
General Settings
Number of MAs (2-5) controls how many moving averages display on your chart. Start with 2-3 to avoid clutter. Projection Bars (1-100) determines how far into the future to project—use 10-20 for intraday charts and 20-40 for daily charts. Lookback for Slope (2-100) sets the number of bars used to calculate trend slope, where shorter lookbacks are more responsive and longer ones are smoother. The default of 20 works well for most situations.
Individual MA Settings (MA 1-5)
Each MA has four settings: Length sets the period for the MA (common values are 9, 20, 50, 100, and 200), Type lets you choose between SMA, EMA, WMA, HMA, VWMA, or RMA (EMA is most popular), Color sets the historical MA line color, and Projection Color sets the projected line color (usually a lighter or transparent version of the main color).
MA Types Quick Reference: EMA is most popular and responsive to recent prices. SMA gives equal weight to all periods and is the smoothest. HMA is very responsive with low lag. VWMA incorporates volume data.
Quick Setup Examples
Day Trading: 3 MAs (9/21/50 EMA), 10-15 projection bars, 10-15 lookback
Swing Trading: 2 MAs (50/200 EMA), 20-30 projection bars, 20 lookback
Scalping: 2 MAs (9/20 EMA), 5-10 projection bars, 5-10 lookback
How to Use
Trend Identification: An uptrend shows price above rising MAs with projections pointing up. A downtrend shows price below falling MAs with projections pointing down. Consolidation appears as flat MAs with horizontal projections.
Support & Resistance: Rising MA projections act as future dynamic support levels, while falling MA projections act as future dynamic resistance levels.
Anticipating Changes: Watch for projected MA crossovers before they happen. When projections converge, expect volatility or consolidation. Steep projections suggest unsustainable trends, so be cautious. Flat projections indicate ranging markets.
Trade Planning: Check the current trend using MA alignment, then look at projections to gauge trend continuation likelihood. Use projected MA levels for potential targets or stop placement.
Important Tips
When Projections Work Best: Projections are most reliable in stable trending markets with consistent momentum, low volatility environments, and away from major news events.
When to Be Cautious: Use caution during high volatility or choppy price action, around major economic releases, when projections show extreme or parabolic angles, and during trend transitions.
Combine With Other Analysis: Don't trade projections alone. Use them alongside price action, volume, support and resistance levels, and other indicators for confirmation.
Best Practices
Start with 2-3 MAs to avoid chart clutter. Match your projection and lookback bars to your trading timeframe. Use consistent color schemes for quick interpretation. Adjust settings as market conditions change. Always use proper risk management—projections are planning tools, not guarantees.
Troubleshooting
Projections not showing: Check that Projection Bars > 0 and you're viewing the most recent bar
Chart too cluttered: Reduce number of MAs or increase projection color transparency
Projections too volatile: Increase lookback bars or switch to EMA/SMA from HMA
Can't see certain MAs: Verify "Number of MAs" setting includes them (MA 3 won't show if set to 2)

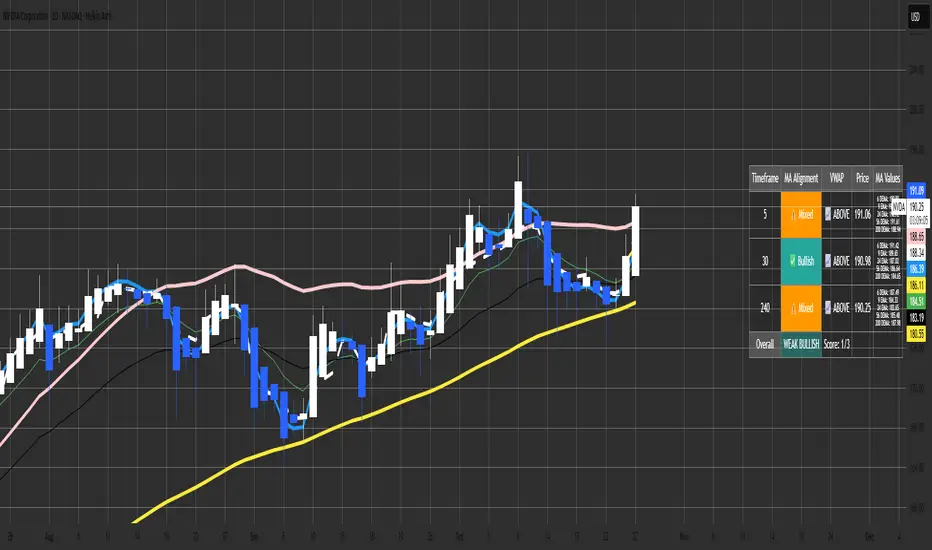
Malama's MTF MA Alignment ScannerMalama's Multi-Timeframe Moving Average Alignment Scanner (MTF MA Scanner) is an overlay indicator designed to simplify trend analysis by evaluating the alignment of multiple moving averages (MAs) across user-defined timeframes. It scans for bullish (MAs stacked ascending), bearish (descending), or mixed/neutral configurations, incorporating a VWAP (Volume Weighted Average Price) filter to contextualize price position relative to volume-based equilibrium. The result is a compact dashboard table summarizing signals from up to three timeframes, helping traders spot confluence for entries or reversals without manually switching charts. This tool draws from classic MA ribbon concepts but adds flexible MA types, dynamic sorting, and an overall trend score for quicker multi-TF insights.
Core Mechanics
The indicator processes data in layers to detect alignment and bias:
Moving Average Calculation: Supports five customizable MAs per timeframe, with types including Simple (SMA), Exponential (EMA), Double Exponential (DEMA for reduced lag), Smoothed (SMMA), or Butterworth 2-Pole filter (a low-lag recursive smoother approximating Ehlers' design for cleaner signals). Defaults use EMAs at lengths 6, 9, 21, 56, and 200—shorter for fast trends, longer for structure. Users enable/disable each independently.
Alignment Detection: For enabled MAs, it dynamically sorts them by length (shortest first) and checks their relative order: All ascending (shortest MA > longest) signals "Bullish" (uptrend strength); all descending signals "Bearish" (downtrend); otherwise "Mixed" or "Neutral" (if <2 MAs). This avoids bias from unsorted plots.
VWAP Integration: Computes session-anchored VWAP (daily/weekly/monthly) as a volume-weighted mean, classifying price as "Above" (bullish bias) or "Below" (bearish) to filter alignments—e.g., bullish MA stack above VWAP strengthens longs.
Multi-Timeframe Aggregation: Pulls MA and VWAP data from up to three timeframes (e.g., current, 5m, 15m) using secure requests without lookahead bias. It consolidates into a table: Per-TF rows show alignment status (with icons: ✅ Bullish, ❌ Bearish, ⚠️ Mixed, ➖ Neutral), VWAP icon/status (📈 Above, 📉 Below), current price, and optional MA values (e.g., "9 EMA: 1.2345").
Overall Summary: Counts bullish/bearish TFs for a net score (e.g., 2/3 bullish = "Weak Bullish"), highlighting confluence in the final row.
This setup emphasizes regime detection: Aligned short-term MAs confirm momentum, while longer ones validate structure, all filtered by VWAP for volume context.
Why This Adds Value & Originality
Standard MA crossovers or ribbons often clutter charts or require manual TF switches, leading to analysis fatigue. Here, the mashup of diverse MA types (e.g., lag-reduced DEMA with smooth Butterworth) into a sortable alignment check creates a "trend thermometer" that's adaptable—e.g., EMAs for responsiveness in forex, SMAs for stocks. The VWAP layer adds a fair-value anchor absent in pure MA tools, while the dashboard condenses MTF data into one glanceable view with a net score, reducing cognitive load. It's not a simple merge: Dynamic UDT-based sorting ensures consistent evaluation regardless of user tweaks, and optional value display aids precise level targeting. This makes it uniquely practical for confluence trading, evolving basic alignment into a scannable system without repainting risks.
How to Use
Setup: Add to your chart (overlay=true). In inputs: Enable TFs (e.g., 1H for structure, 15m/5m for entries); customize MAs (e.g., switch to DEMA for volatile crypto); set VWAP anchor (Daily for intraday). Toggle table position/size and chart plots.
Interpret the Dashboard (top-right default):
Per-TF Rows: Green cells for Bullish (long bias); red for Bearish (short); orange for Mixed (caution); gray for Neutral/low data. Check VWAP for confirmation—e.g., Bullish + Above = strong buy setup.
MA Values Column (if enabled): Lists current levels (e.g., "21 EMA: 4500.50") for support/resistance pulls.
Overall Row: "Strong Bullish" (all green) for aggressive longs; "Weak" variants for scaled entries. Score like "2/3" shows TF agreement.
Trading Application: On a 1H chart, look for 3/3 Bullish with price above VWAP for longs—enter on pullback to shortest MA. Use alerts (e.g., "All Timeframes Bullish") for notifications. Best on liquid assets (e.g., EURUSD, SPX) across 15m-4H. Combine with price action for edges.
Customization Tips: Disable unused MAs to declutter; test Butterworth on noisy data for smoother aligns.
Limitations & Disclaimer
Alignments lag by MA lengths and TF resolutions, so they're directional filters—not precise entries (pair with candlesticks). VWAP resets on anchors, potentially skewing mid-session. In sideways markets, "Mixed" dominates—avoid forcing trades. No built-in risk management; backtest on your symbols (e.g., via Strategy Tester) to validate. Results use historical data without guarantees—markets evolve. Not financial advice; trade at your own risk. For feedback, comment publicly.1.1s
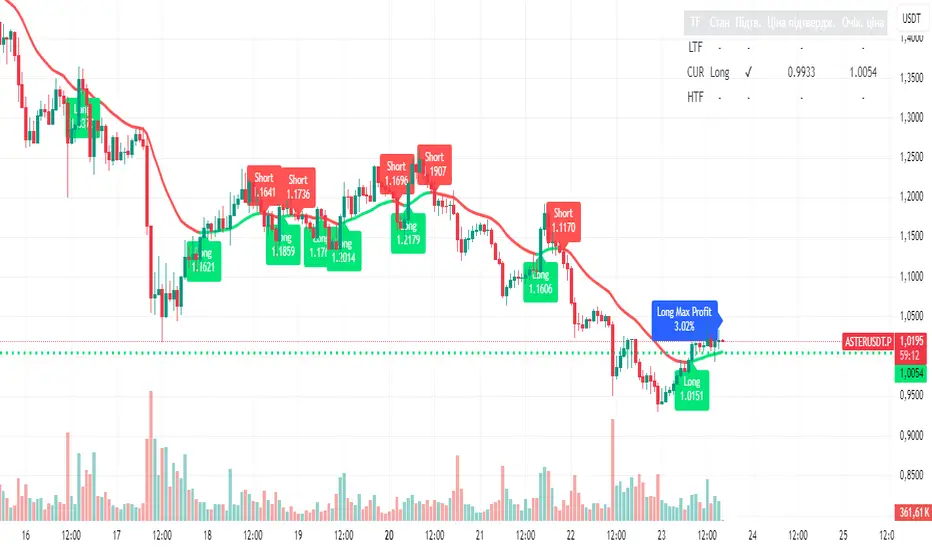
Unified Moving Average V5 (EN/UA)## Title
Unified Moving Average V5 — Practical Trend Tool (EN/UA UI)
## Short description
Practical trend tool that colors market direction, highlights potential turns with optional confirmation, and supports multi‑timeframe alignment. Includes live Max% tracking and a compact status panel. Bilingual EN/UA UI.
or quick bias assessment
- Potential turn signals with optional confirmation
- Multi‑timeframe (LTF/HTF) alignment tools
- Live Max% move tracking since the last turn
- A status panel showing state, confirmation, and key reference levels
## How to use (high level)
1) Pick your preferred MA family and length for the asset/timeframe you trade.
2) Enable trend coloring to see bias (up/down/neutral) instantly.
3) Turn on confirmation if you prefer additional validation on potential turns.
4) Use HTF as a directional filter and LTF for timing.
5) Watch the status panel for current state, confirmation state, and reference levels.
## Inputs (practical)
- Source: which price the MA reads (Close/Open/High/Low/HL2/HLC3/OHLC4)
- MA Type & Length: choose family (SMA/EMA/RMA/WMA/VWMA/HMA) and period (1–500)
- Display: line width, stepline, color‑by‑trend, colors, right‑side value label
- Alerts: potential turn alerts; price/MA cross alerts
- Profit / Max %: optional leverage multiplier and label colors
- Confirmation: adds additional validation on potential turns; debounce with Min bars between turns
- MTF: enable LTF/HTF, set timeframes, show lines, colors, entry labels, compact labels, append price
- Status panel: toggle table, choose corner, adjust offsets
## Signals & Alerts
- Potential turn (with optional confirmation)
- Price/MA cross
- LTF/HTF turn notifications## Overview
Unified MA V5 helps you read trend direction at a glance and align entries with your preferred timeframe stack. It offers:
- Trend coloring f
## Recommended presets (no strategy advice)
- Swing Trend Following
- MA: HMA or EMA; Length 100–200
- Confirmation: On; Min bars between turns: 2–4
- MTF: HTF = 4× current; LTF Off
- Display: Stepline On; Line width 3
- Alerts: Potential turn + Price/MA cross
- Intraday Momentum
- MA: EMA; Length 34–55
- Confirmation: On; Min bars between turns: 1–2
- MTF: HTF = 2–4×; LTF = 0.25–0.5×
- Display: Stepline On
- Alerts: Potential turn + Price/MA cross
- Scalping
- MA: WMA or HMA; Length 20–34
- Confirmation: Optional; Min bars between turns: 0–1
- MTF: LTF = 0.2–0.5×; HTF Optional
- Display: Stepline On; Consider disabling some labels to reduce clutter
- Alerts: Potential turn (short horizon)
- Mean‑Reversion Bias
- MA: RMA or SMA; Length 50–100
- Confirmation: On
- MTF: HTF = 2–4×; LTF Optional
- Display: Color‑by‑trend On
- Alerts: Price/MA cross emphasis
## Notes
- Labels can accumulate during volatile sessions; disable some if needed.
- Table offsets and placement options may vary by platform.
- This is a tool for visualization and alerts, not financial advice.
## Indicator direction
Trend-Following / Trend Change Detection with optional confirmation via MA retest.
Best MA Finder: Sharpe/Sortino ScannerThis script, Best MA Finder: Sharpe/Sortino Scanner, is a tool designed to identify the moving average (SMA or EMA) that best acts as a dynamic trend threshold on a chart, based on risk-adjusted historical performance. It scans a wide range of MA lengths (SMA or EMA) and selects the one whose simple price vs MA crossover delivered the strongest results using either the Sharpe ratio or the Sortino ratio. Reading it is intuitive: when price spent time above the selected MA, conditions were on average more favorable in the backtest; below, less favorable. It is a trend and risk gauge, not an overbought or oversold signal.
What it does:
- Runs individual long-only crossover backtests for many MA lengths across short to very long horizons.
- For each length, measures the total number of trades, the annualized Sharpe ratio, and the annualized Sortino ratio.
- Uses the chosen metric value (Sharpe or Sortino) as the score to rank candidates.
- Applies a minimum trade filter to discard statistically weak results.
- Optionally applies a local stability filter to prefer a length that also outperforms its close neighbors by at least a small margin.
- Selects the optimal MA and displays it on the chart with a concise summary table.
How to use it:
- Choose MA type: SMA or EMA.
- Choose the metric: Sharpe or Sortino.
- Set the minimum trade count to filter out weak samples.
- Select the risk-free mode:
Auto: uses a short-term risk-free rate for USD-priced symbols when available.
Manual: you provide a risk-free ticker.
None: no risk-free rate.
- Optionally enable stability controls: neighbor radius and epsilon.
- Toggle the on-chart summary table as needed.
On-chart output:
- The selected optimal MA is plotted.
- The optional table shows MA length, number of trades, chosen metric value annualized, and the annual risk-free rate used.
Key features:
- Risk-adjusted optimization via Sharpe or Sortino for fair, comparable assessment.
- Broad MA scan with SMA and EMA support.
- Optional stability filter to avoid one-off spikes.
- Clear and auditable presentation directly on the chart.
Use cases:
- Traders who want a defensible, data-driven trend threshold without manual trial and error.
- Swing and trend-following workflows across timeframes and asset classes.
- Quick SMA vs EMA comparisons using risk-adjusted results.
Limitations:
- Not a full trading strategy with position sizing, costs, funding, slippage, or stops.
- Long-only, one position at a time.
- Discrete set of MA lengths, not a continuous optimizer.
- Requires sufficient price history and, if used, a reliable risk-free series.
This script is open-source and built from original logic. It does not replicate closed-source scripts or reuse significant external components.

MK_OSFT - Multi-Timeframe MA Dashboard with Alerts - v1.0Multi-Timeframe Moving Average Dashboard with Advanced Alerts
A comprehensive multi-timeframe moving average indicator that displays MA levels from 6 different timeframes simultaneously on your chart, complete with intelligent labeling, customizable alerts, and performance-optimized plotting.
*** Key Features ***
Multi-Timeframe Analysis
Monitor MA levels from 6 timeframes: 5m, 15m, 1H, 4H, Daily, and Weekly
Clean visual separation with customizable colors for each timeframe
Smart label positioning prevents overlapping and ensures readability
Intelligent Alert System
Individual alert toggles for each timeframe
Cross-above and cross-below MA alerts with once-per-bar frequency
Alerts only trigger on confirmed timeframe closes (no false signals)
Works across all trading pairs on your current chart
Flexible Display Options
Toggle individual timeframe visibility
Choose between SMA and EMA calculations
Adjustable MA length (default: 12 periods)
Two source options: Current Bar or Last Confirmed Bar
Customizable line widths, label sizes, and colors
Advanced Plotting System
Optional plot lines that don't clutter your Style tab
Performance-optimized line drawing with historical data support
"Wait till close" behavior for smooth higher timeframe representation
Clean horizontal segments that update only on timeframe closes
Real-Time Information Table
Live countdown timers showing time remaining until each timeframe closes
Visual indicators for current price position relative to each MA
Cross direction indicators (↑/↓) for quick trend assessment
Show/Alert status display for easy configuration verification
*** Settings Overview ***
Moving Average Settings
MA Length: Adjustable period (default: 12)
MA Type: SMA or EMA
Source: Current bar vs Last confirmed bar
Individual Timeframe Controls
Show/Hide toggles for each timeframe
Individual alert enable/disable
Optional plot line with custom width
Color customization per timeframe
Visual Customization
Label size options (tiny, small, normal, large)
Label offset positioning
Minimum gap between labels to prevent overlap
Drawing order preference (larger timeframes first/last)
Smart Features
Automatic label collision detection and adjustment
Real-time countdown timers (only on live bars)
Debug table with comprehensive timeframe information
Built-in alert setup instructions
Perfect For
Swing traders monitoring multiple timeframe confluences
Day traders seeking higher timeframe bias confirmation
Anyone wanting clean, organized multi-timeframe MA analysis
Traders who need reliable alerts without false signals
Performance Optimized
Efficient line drawing system (no Style tab clutter)
Smart historical data handling
Minimal resource usage with intelligent update cycles
Works smoothly on all timeframes and symbols
Transform your chart into a comprehensive multi-timeframe analysis dashboard with this professional-grade moving average indicator.

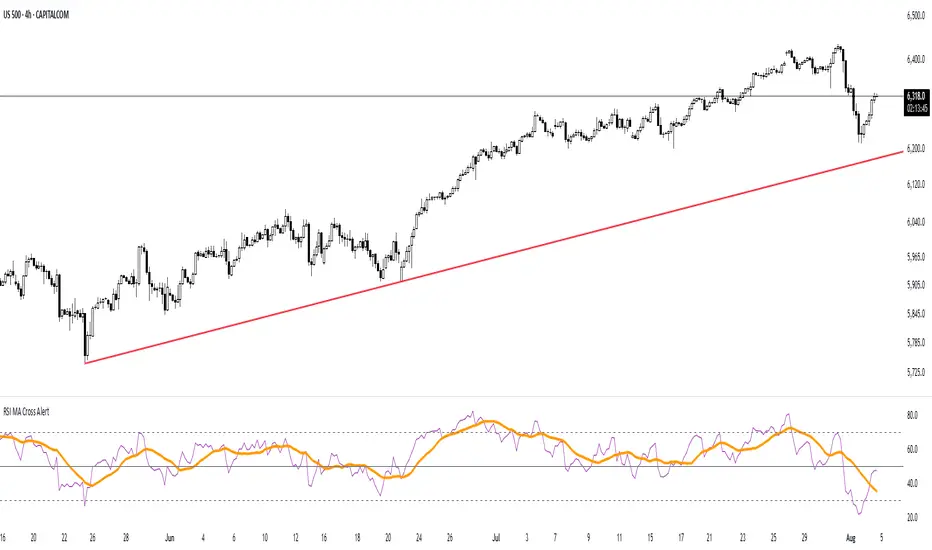
RSI MA Cross AlertAlerts when RSI-based Moving Average crosses above 50. Can be used on any symbol and timeframe. Displays RSI, RSI-MA, and levels 30/50/70.